

1
Vessels
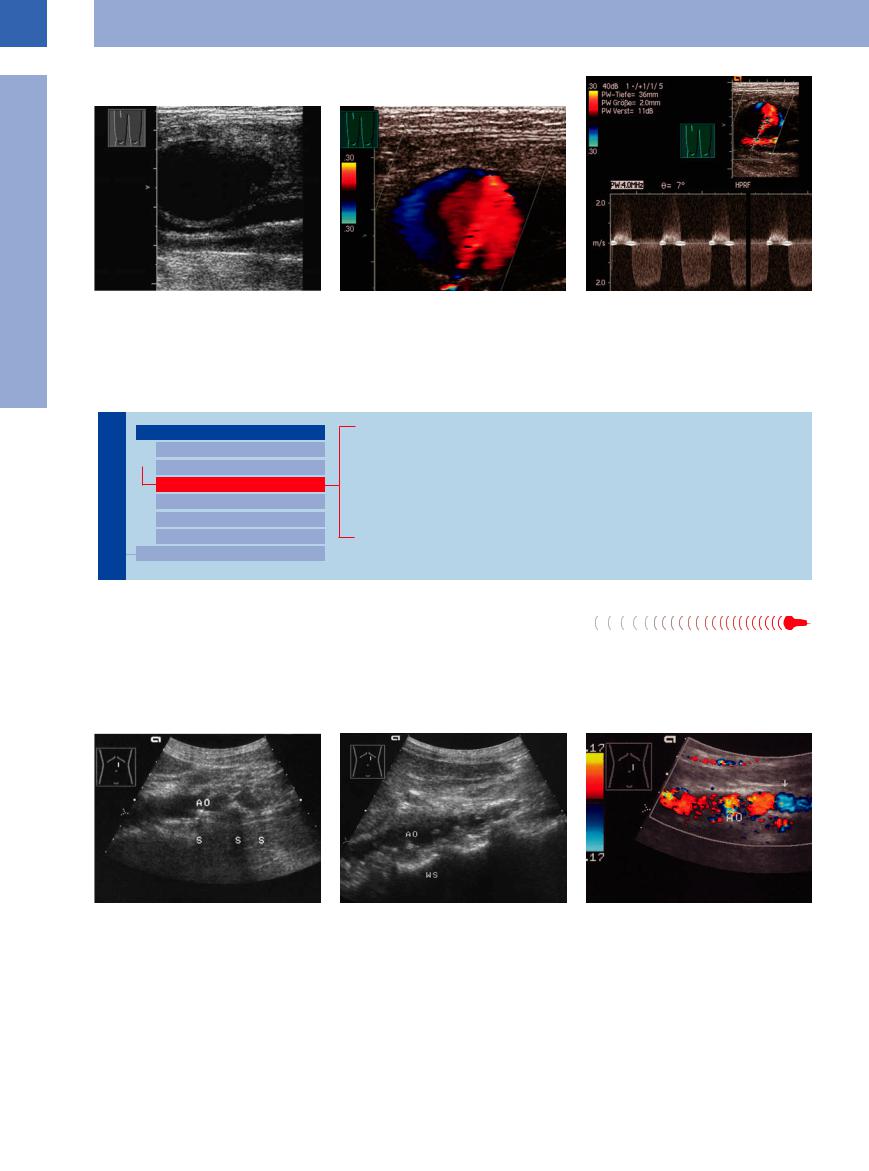
Fig. 1.20 False aneurysm or pseudoaneurysm of the fem- |
b Color-coded jet (red) and reverse flow (blue) within the |
c Flow situation and velocity can be demonstrated with |
oral artery.22 |
aneurysm. |
the pulsed Doppler. Peak systolic velocity in the backflow |
a B-mode: nearly anechoic mass in the right inguinal |
|
about 2 m/s, in the inflow greater than 2 m/s. |
region, dorsally anechoic vessels. |
|
|
Stenosis
Vessels

Aorta, Arteries
Anomalies and Variant Positions
Dilatation
Stenosis
Wall Thickening
Intraluminal Mass
Perivascular Mass
Vena Cava, Veins
Aortic Stenosis
Arterial Stenosis
Aortic/Arterial Embolism
Arteriosclerotic Aortic/Arterial Occlusion
Anastomotic/Bypass Stenosis
Tumor Stenosis/Infiltration
Aortic Stenosis 


Stenosis of the aorta may be depicted directly |
above), most often these are multiple or exten- |
in B-mode imaging, or it can be demonstrated |
sive atherosclerotic stenoses. A peak systolic |
by color-flow Doppler and spectral analysis of |
velocity of more than 200 cm/s in the Doppler |
the blood flow. Apart from the congenital nar- |
spectral analysis is indicative of hemodynami- |
rowing due to coarctation of the aorta (see |
cally significant arterial stenosis.6 |
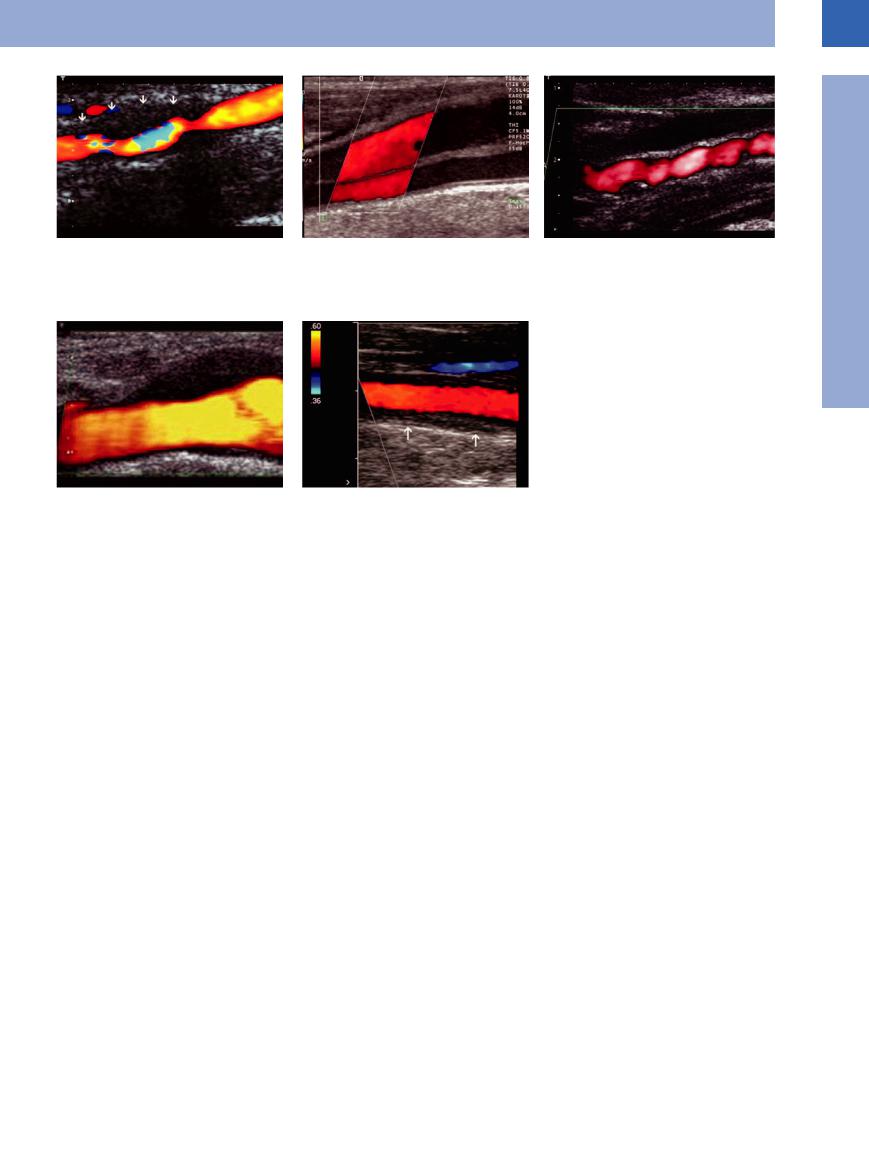
Arteriosclerotic stenotic lesions also exhibit complex protuberances that produce luminal stenosis of varying significance. Generalized sclerosis of the aorta will lead to severe narrowing of the aortic lumen (Fig.1.21).
Fig. 1.21
a Arteriosclerotic sclerosis of the aorta: severe narrowing of the distal aortic lumen (AO) due to complex calcified plaques with posterior shadowing (S).
b Disseminated arteriosclerotic sclerosis of the aorta. Multiple stenoses of the aorta (AO) due to complex calcified plaques with posterior shadowing (S).
c Thickening of the aortic wall with multiple consecutive stenoses and turbulence-induced color changes. Arrow: color change at the origin of the iliac artery.
12
1
Aorta, Arteries
Fig. 1.228 |
b Stanford A dissection of the common carotid artery. |
a Internal carotid artery dissection with wall hematoma: |
Detection of two lumina and dissection membrane. |
asymmetrical hypoechoic enlargement of the vascular |
|
wall with lumen constriction (aliasing in the color Doppler |
|
image) and expansion to the outside. |
|
Arterial Stenosis


Splanchnic arteries. Although stenosis of the intraperitoneal and peripheral arteries is quite a common finding, the narrowing of the lumen tends to be of no hemodynamic significance. Usually even severe splanchnic artery stenosis does not result in clinical symptoms because these vessels are heavily interlinked via various branches (e. g., the arcade of Riolan):
●Left gastric artery (celiac axis) → right gastric artery (common hepatic artery)
●Superior pancreaticoduodenal artery (celiac axis) → inferior pancreaticoduodenal artery (superior mesenteric artery)
●Middle colic artery (superior mesenteric artery) → left colic artery (inferior mesenteric artery)
Hemodynamically significant stenosis is confirmed by the increased systolic velocity in color-flow Doppler spectral analysis. The normal systolic velocity of the celiac axis, the splenic and hepatic artery shows a biphasic profile with a high diastolic residual flow. In the branches of the celiac axis the regular systolic velocity is 138 ± 99 cm/s.7 The peak systolic velocity of the superior mesenteric artery can increase postprandially up to 250 cm/s with a biphasic spectrum (normally 100–180 cm/s at a triphasic spectrum). A peak systolic velocity of more than 220 cm/s in the celiac axis or superior mesenteric artery is indicative of arterial stenosis. In B-mode imaging these stenoses are seen as arteriosclerotic plaques with narrowing of the lumen. However, even if there is no inflow stenosis, this does not rule out intestinal ischemia since duplex scan-
ning may easily miss the more peripheral stenosis or embolism. In this case the clinical symptoms and angiography settle the diagnosis ( 1.3a–i).
Median arcuate ligament syndrome. Among the functional obstructions, the median arcuate ligament syndrome is a special case. The median arcuate ligament is a ligamentous arch across the surface of the aorta, interconnecting the crura of the diaphragm. Particularly in young women, postprandial epigastric pain mimicking ulcer may be due to compression of the celiac axis by the median arcuate ligament. Ultrasound confirms this diagnosis by color-flow Doppler with the non-respiration- dependent change in velocity: during expiration there is a clear-cut increase in velocity above 180 cm/s because of the stenosis, while during inspiration the velocity will drop. If the stenosis is fixated, the velocity increases during inspiration as well as expiration. Dissection of the ligament should eliminate the complaints (and the ultrasound pathology) ( 1.3a).
Renal artery stenosis. Arteriosclerosis is the underlying cause in most cases of renal artery stenosis, which is frequently found at the origin of the renal artery. Fibromuscular stenosis of the middle and peripheral segments of the renal artery is far less common. Ultrasound demonstrates alternating zones of vasoconstriction and vasodilation with segmental manifestation at medium-sized arteries. The ICA is affected particularly frequently (Fig 1.22c).
c Fibromuscular dysplasia of the internal carotid artery with alternating zones of vasoconstriction and vasodilation in an extracranial vascular segment far above the bifurcation.
d Hypoechoic wall thickening at the carotid bifurcation in the case of idiopathic carotidynia.
e Typical vasculitis finding of the common carotid artery in Takayasu arteritis: long hypoechoic wall thickening visualized in the color Doppler image as a dark halo around the vascular lumen.
The sonographic criteria of proximal renal artery stenosis are ( 1.3j–l):
● Demonstration of a localized thickening of the wall, and in the B-mode image narrowing of the lumen (quite often not identifiable)
● Turbulence before and after the stenosis with color changes (“confetti phenomenon”)
● Increased velocity of more than 180 cm/s; increase in the end-diastolic velocity to above 50 cm/s
● Poststenotic drop in the velocity presents a higher diastolic plateau, indicating a reduced resistance
● Decrease in the resistance ratio below 0.5 or a difference of more than 5% ( RI 0.05) when comparing both sides (poststenotic or at the intrarenal arteries)
 1.3 shows typical examples of splanchnic and renal artery stenosis.
Carotid artery. Ultrasonography of the carotid arteries and possibly the aortic arch may be of vital importance in internal medicine and neurology. B-mode imaging will demonstrate any stenosis and thrombosed plaques, while the severity is ascertained by duplex scanning. This is mainly relevant to the consequences of arteriosclerosis. The other most important nonarteriosclerotic diseases of the cervical arteries are (see Arning8) dissection, fibromuscular dysplasia, vasculitis, and idiopathic carotidynia (Fig.1.22a–e).
13
1
Vessels
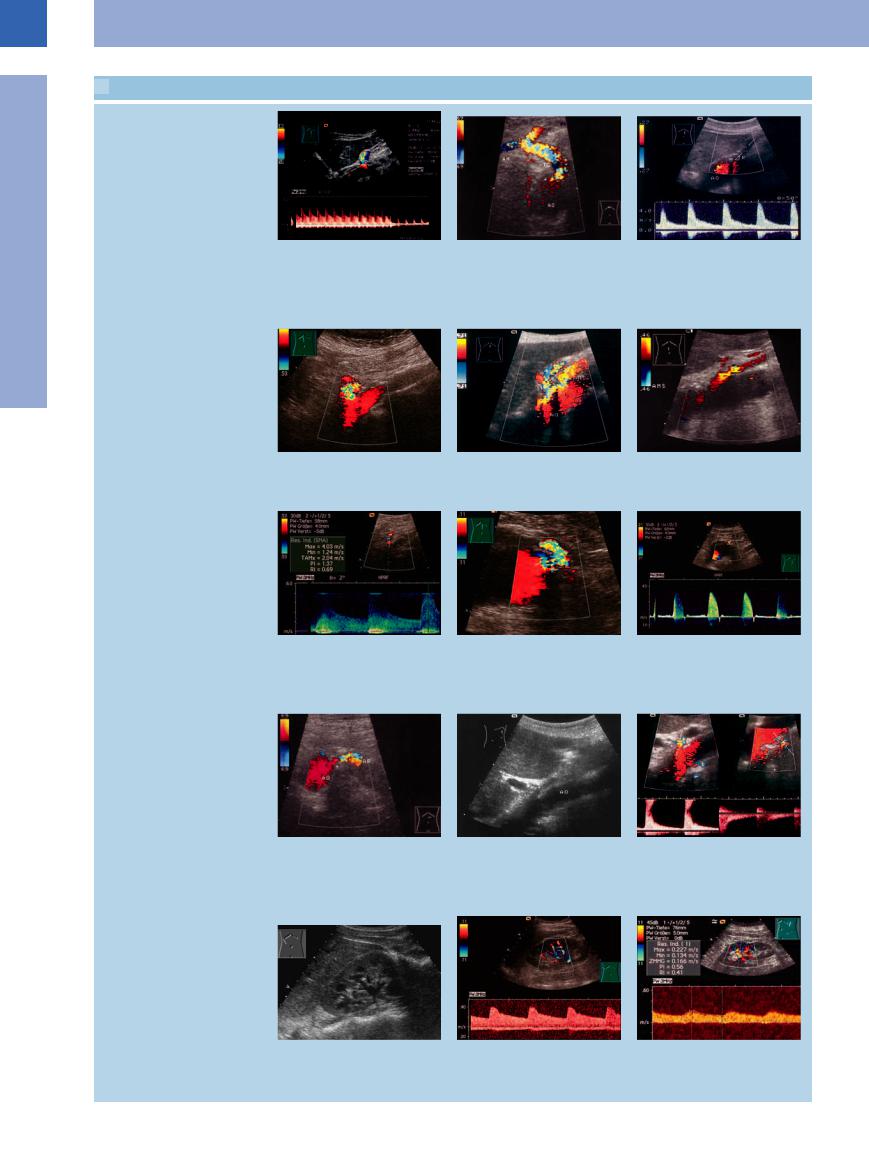
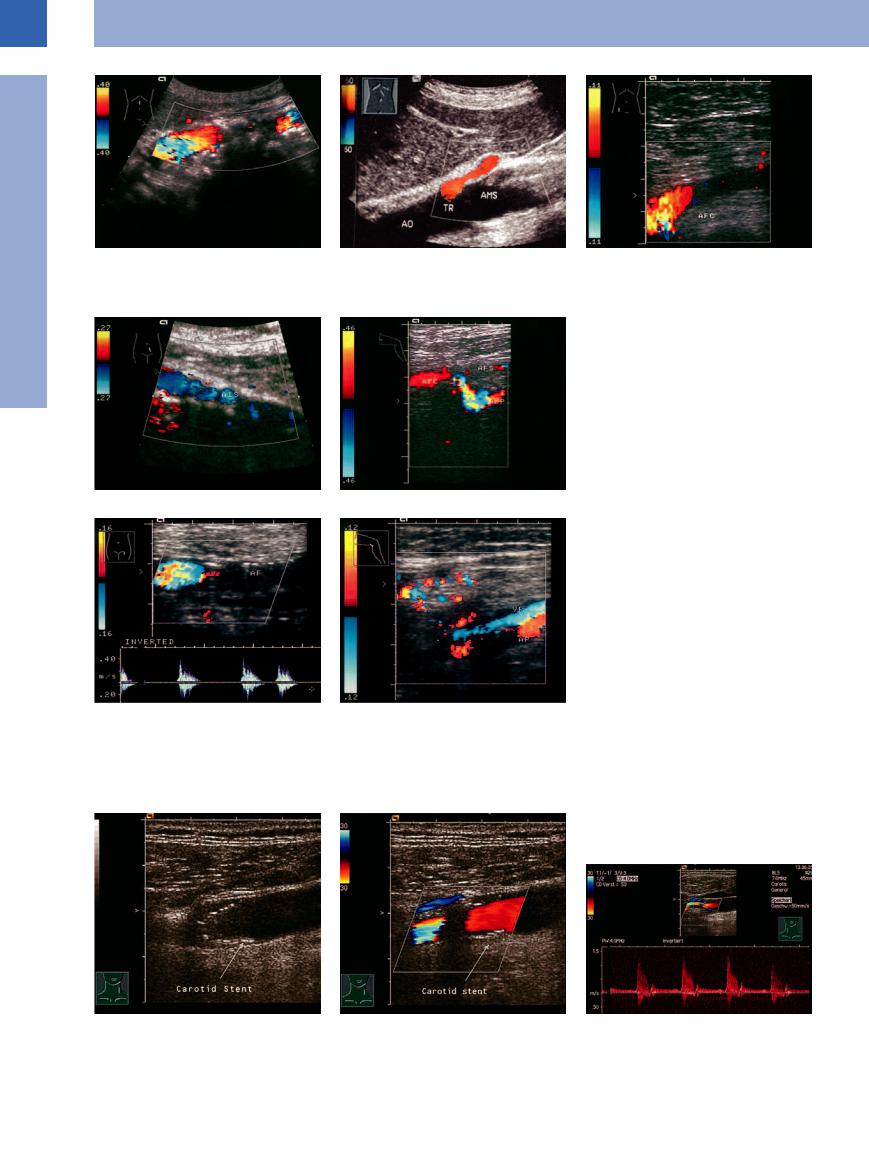
 1.3 Splanchnic Artery Stenosis
Celiac trunk stenosis
Mesenteric artery stenosis (stenosis of the inferior mesenteric artery)
a Median arcuate ligament syndrome: Turbulent flow in the celiac trunk, high peak velocity 4 m/s in expiration; in inspiration normal flow velocity: respiratorydependent stenosis (!) confirmed by operation, no further symptoms postoperatively.
d Branching o stenosis of the mesenteric artery. The artery is quite visible in CDS and here shows turbulence with color changes.7
g Stenosis of the aortic origin of the superior mesenteric artery. Demonstration of the spectral waveform with a peak velocity of 4.03 m/s. Successful treatment.7
b Significant color changes indicating highspeed turbulence induced by the stenosis (arrow). AH = common hepatic artery; AL = splenic artery; TC = celiac trunk; AO = aorta.
e Color duplex: turbulent zones in both arteries, indicating significant stenosis. AO = aorta; TR = celiac trunk; AMS = superior mesenteric artery.
h Stenosis of the inferior mesenteric artery. The mixed color is caused by the stenosis and aliasing at low pulse repetition frequency (PRF): amelioration in the color-coded signals of the aorta at low PRF.22
c High-grade stenosis of the celiac trunk, showing no detectable flow even at a low pulse repetition frequency (PRF). Doppler spectrum shows marked flow acceleration to (a velocity of) 400 cm/s. AO = aorta; TR = celiac trunk.
f Stenosis of the mesenteric artery. Colorflow Doppler: color change signifying stenosis-induced turbulence.
i Stenosis of the inferior mesenteric artery in an aortic aneurysm. In the spectral analysis with pulsed-wave Doppler a flow acceleration up to 3.20 m/s in the region of the stenosis is detectable.
Renal artery stenosis
j Origins of the renal arteries (arrows, B- mode image). Penetration ~80 mm, colorflow Doppler velocity 69 cm/s. Severe stenosis (arrow) at the aortic origin (AO) of the renal artery (AR); the color changes signify increased velocity with turbulence.
m Kidney with vessels in the renal sinus.22
k Gray-scale image, atypical section from the right side to the left, longitudinal scan (“banana-peel” phenomenon). AO = aorta.
n Intrarenal vessels. In CDS the hypoechoic structures in the renal sinus can be di erentiated. Spectral waveform and analysis can be helpful in the estimation of blood flow.22
l Color duplex with spectral analysis: color reversals in the renal arteries plus flow acceleration to 200 cm/s, indicating significant stenosis.
o Spectral wave of a renal artery stenosis: elongated acceleration time, low systolic flow velocity (RI = 0.41).
14
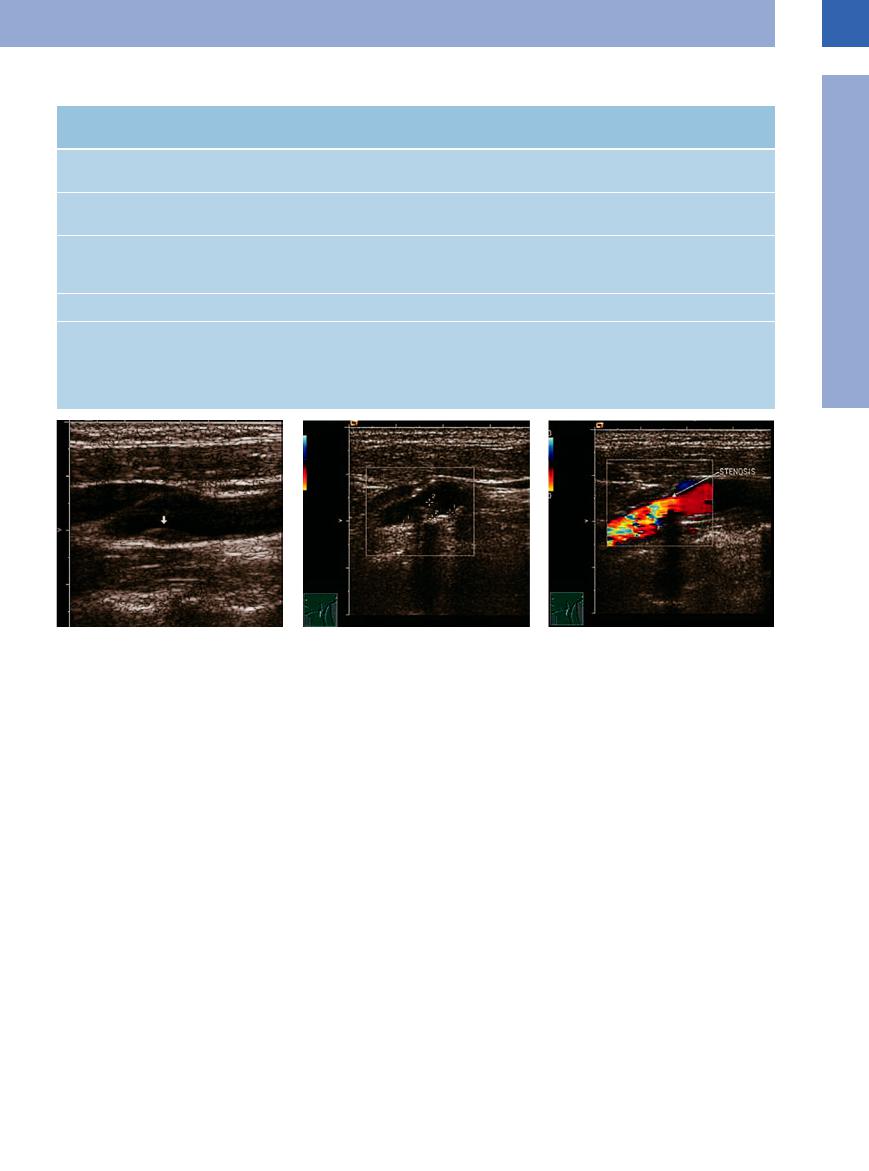
Table 1.1 Severity of stenosis—verified by B-mode imaging, spectral analysis, and color-flow Doppler scanning (modified after Neuerberg-Heusler and Hennerici6 and Widder et al9)
Severity of local |
No stenosis (< 40%) |
Slight (40–60%) |
Moderate (60–70%) |
stenosis |
|
|
|
B-mode image: |
+++ |
+++ |
++ |
quality of detection |
|
|
|
B-mode image: |
Slight plaque forma- |
Slight plaque forma- |
Moderate narrowing of |
findings |
tion |
tion |
the lumen |
Spectral analysis |
Unremarkable |
Widening of the |
Widening of the spec- |
|
|
spectrum |
trum, larger fraction of |
|
|
|
lower frequencies |
Peak systolic velocity |
< 120 cm/s |
> 120 cm/s |
> 120 cm/s |
Color-flow Doppler |
No or just localized |
Extended segmental |
Circumscribed seg- |
|
turbulence |
systolic increase in |
mental systolic in- |
|
|
velocity |
crease in velocity |
Severe (ca. 80%) |
Subtotal (> 90%) |
+ |
+ |
Severe narrowing of |
Almost complete ob- |
the lumen |
struction of the lumen |
Inverse frequencies |
Inverse frequencies |
within the widened |
within the reduced |
spectrum |
spectrum |
> 240 cm/s |
Variable |
Tightly circumscribed |
|
segmental increase in |
|
velocity of high se- |
|
verity, with some |
|
backflow components |
|
1
Aorta, Arteries
Fig. 1.23
a Small, soft plaque (arrow) in the CCA: faint, smoothly curved area of luminal narrowing without an acoustic shadow.23
Dissection. Dissection (predominantly of the internal carotid or vertebral artery) is spontaneously caused by the diversion of blood into the artery wall, either following intimal tear or due to bleeding of the vasa vasorum. It may be also caused by a Stanford type A aortic dissection with spreading into the supraaortic vessels or vascular injury including an iatrogenic lesion due to puncture or surgery.
The sonography of a spontaneously occurring dissection as an intramural hematoma without intimal rupture shows an extended and distal asymmetrical localized hematoma without a double-layer lumen.
Dissections of the ICA with severe stenosis (associated with a high risk of stroke) and dissections including milder stenosis can be detected with an overall sensitivity of 70–96%, depending on the degree of stenosis and a specific search for dissections.8
Fibromuscular dysplasia. This is a nonatheromatous, noninflammatory arteriopathy of unclear etiology with segmental manifestation at medium-sized arteries, the renal arteries and the ICA, often with alternating zones of
b Luminal narrowing in the region of the carotid bulb: complex lesion (cursors) with secondary calcification, shadowing.
vasoconstriction and vasodilation in an extracranial vascular segment far above the bifurcation.
Vasculitis. Two forms of immunovasculitis can manifest at the large extracranial vessels and be detected with ultrasound: Takayasu arteritis and giant-cell arteritis (Horton disease).
Takayasu arteritis manifests with stenoses and secondary thrombotic occlusion, or with aneurysms at the aortic arch and the supraaortic arteries. Since the subclavian artery is often affected to a greater extent than other vessels, hypoperfusion of the arms can be the main symptom (“pulseless disease”). In typical cases, the CCA exhibits long, homogeneously hypoechoic, concentric wall thickening (the “macaroni sign”), resulting in lumen narrowing. On color Doppler imaging the thickened, hypoechoic wall appears as a dark halo surrounding the colorful lumen.
Giant-cell arteritis manifests in mediumsized and large arteries, particularly the supraaortic arteries and their branches, the abdominal and pelvic arteries and vessels. Sonography shows long, concentric, homogeneously hypo-
c Luminal narrowing in the internal carotid artery by hard plaque with zones of turbulent flow behind the stenosis (red, yellow, blue).
echoic wall thickening visualized on the color Doppler image as a dark halo surrounding the bright lumen (for diagnosis on the temporal artery, see Fig.1.41, p. 21).
Idiopathic carotidynia. Affected patients complain of severe pain on one side in the upper cervical region that responds well to cortisone or nonsteroidal anti-inflammatory drugs (NSAIDs). Sonography shows hypoechoic thickening of the vascular wall resulting not only in minimal lumen narrowing but also a pronounced hypoechoic thickening of either the cranial CCA, or the junction to the ICA. Because spontaneous dissection is more cranially located, hemodynamic signs of stenosis are not detectable.8
Arteriosclerotic stenoses. According to Neuer- burg-Heusler and Hennerici6 and Widder et al.,9 stenosis of the common, external, and internal carotids may be classified according to five possible degrees of severity (Table 1.1,
Fig.1.23, Fig.1.24).
15
1
Vessels
Fig. 1.24 Spectral analysis for determination of the se- |
b Doppler spectrum sampled just in front of the stenosis: |
verity of stenosis (Fig. 1.23c). |
marked decrease in flow velocity. |
a Decreased flow velocity proximal to the stenosis, with |
|
unchanged frequency spectrum. |
|
Peripheral arteries. In the peripheral arteries the hemodynamic effects of a stenosis depend on its severity. B-mode imaging and color-flow Doppler scanning will directly demonstrate the stenosis of a peripheral artery. In color-flow Doppler spectral analysis the iliac and femoral arteries normally show a triphasic spectrum with a peak systolic velocity of about 80–100 cm/s, and in the external iliac artery up to 110 cm/s (see Fig.1.25a, Fig.1.26). A blood flow impairment is indicated when the peak velocity decreases to less than 70 cm/s.
A peripheral artery in the extremities will be deemed to exhibit clinically significant stenosis (> 50%, also known as critical stenosis), if the following criteria are present:
●Localized thickening of the vessel wall with reduction in the lumen diameter by more than 50% in color Doppler imaging: widening of the spectral curve and disappearance of the triphasic spectrum
●More than twofold increase in the peak systolic velocity
Certain locations of the iliac–femoral axis are predisposed to obstruction: the bifurcation of the common femoral artery into the superficial and deep femoral arteries; Hunter’s canal, where the tendon of the adductor magnus muscle crosses the superficial femoral artery; and the trifurcation of the popliteal artery. Even during routine ultrasound studies, it is usually possible to deliberately look for obstruction in the peripheral arteries of the limbs; clinical symptoms and the result of duplex scanning will be sufficient to indicate any need for angiography. The differential diagnosis of a supposed stenosis of the external iliac artery which appears to be too small may indicate a persisting ischiadic artery, if at the same time the internal iliac artery appears to be unusually prominent.
Panoramic imaging of the vessel facilitate the search for stenosis in long peripheral arteries. One definite indication for detailed vascular work-up is the syndrome of the neuroischemic diabetic foot with its accompanying
c Doppler spectrum sampled in the stenosis: Vmax is increased to 140 cm/s, indicating 50% stenosis.
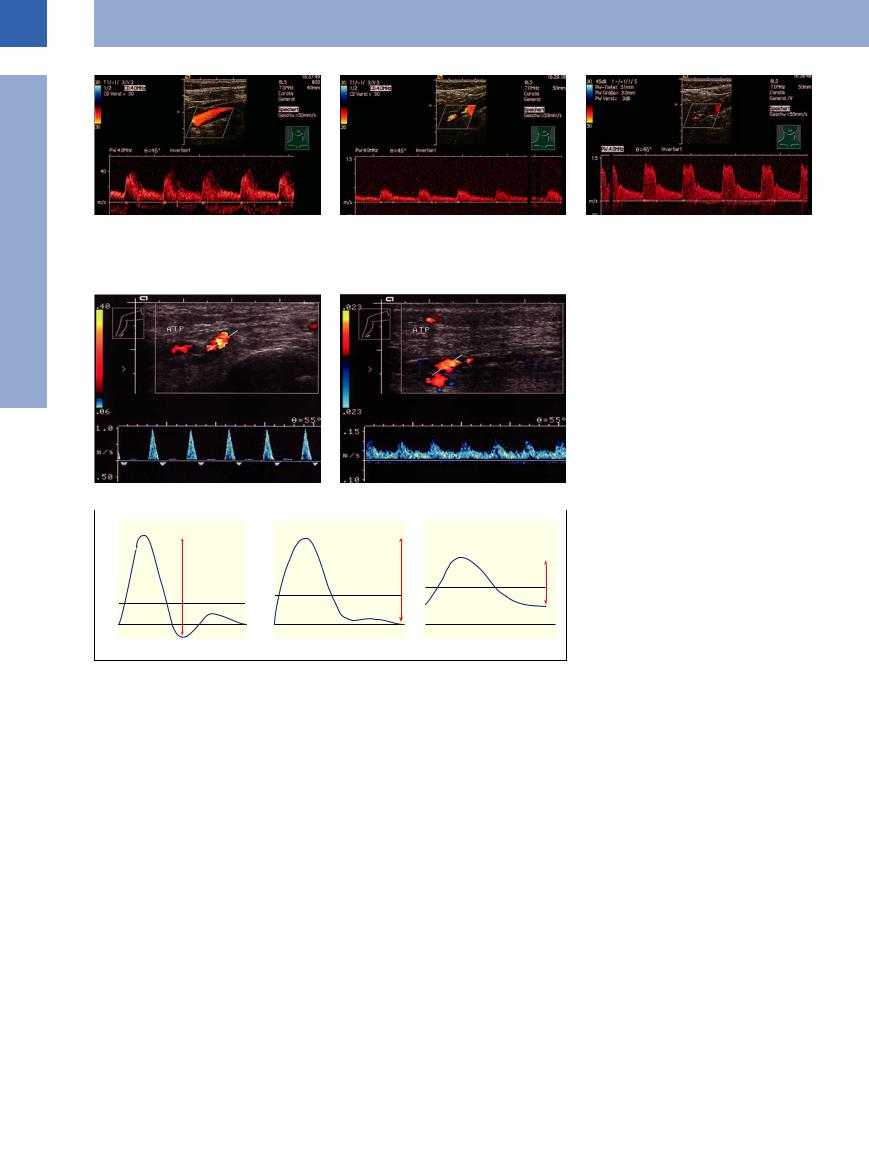
Fig. 1.25 Color-flow duplex scan with spectral analysis and measurement of the pulsatility index. ATP = posterior tibial artery.
a A solely neuropathic foot (plantar ulcer): normal arterial spectral profile, pulsatility index 7.67.
b A neuroischemic foot (deep plantar ulcer Wagner grade II): marked decrease in the peak systolic velocity (10 cm/s), high diastolic plateau, pulsatility index 0.87; critical ischemia of the lower extremity.
Fig. 1.26 Pulsatility index (PI) and velocity as a function of the severity of the obstruction in normal and pathological extremity flow pulses. The PI is computed by dividing the difference between peak and minimum flow velocity (h) by the mean flow velocity (Vm) (see Neuerberg-Heusler and Hennerici6).
sclerosis of the media, where the pedal pulses are not palpable, even in the absence of any clinically significant obstruction, and the parameters generated by Doppler ultrasound are meaningless. Here, a subtle search for obstruction may be called for to differentiate and assess the status of the ischemic leg in the presence of any concomitant neuropathy. In our studies the diabetic foot, solely neuropathic and without any vascular obstruction, will yield a pulsatility index (PI) greater than 4, while in the neuroischemic foot PI lies between 4 and 1.2; in critical ischemia of the lower extremity the PI drops below 1.2 (Fig.1.25).10
Determination of the peak and minimum flow velocities as well as the PI of Gosling and King in the poststenotic segment of the artery is easier to perform. This will resemble the curves illustrated in Fig.1.26 (after Gosling as quoted in Neuerberg-Heusler and Hennerici6). Figures 1.27 and 1.28 are images of iliac and femoral artery stenoses, respectively.
16
Fig. 1.27 Stenosis (AID) of the right iliac artery. AO = aorta.
a B-mode image: severe narrowing of the origin (arrow) of the iliac artery.
b Color-flow Doppler scan: stenosis (arrow), the color changes signifying turbulent flow.
Fig. 1.28 Stenosis (arrow) of the femoral artery (AF), colorflow Doppler scan: prestenotic color changes denoting turbulence. The stenosis is due to a massive calcified plaque (note the shadowing, S) encroaching on the lumen.
1
Aorta, Arteries
Aortic/Arterial Embolism


Acute aortic embolism (like acute thrombosis |
peripheral arteries is still common although |
of the aorta, aortic bifurcation syndrome) is a |
its incidence has decreased dramatically since |
rare event; however, acute embolism of the |
the introduction of anticoagulant therapy for |
atrial fibrillation (see Fig.1.44; the incidence of embolism at the various sites of the arterial tree is given in the schematic Fig.1.45).11
Arteriosclerotic Aortic/Arterial Occlusion


In ultrasound imaging, arteriosclerotic occlusion of the aorta and the other arteries is demonstrated by a complete loss of continuity in the lumen and no flow in color-flow Doppler scanning. Adjacent collateral vessels become
visible. Spectral analysis identifies decreased systolic and diastolic flow velocity proximal to the occlusion, with no flow (or collaterals) or decreased systolic velocity combined with a high end-diastolic flow velocity distal to the
obstruction. Sensitivity for stenosis and occlusions is 100%, and specificity is 98% (Fig.1.29,
Fig.1.30).
17
1
Vessels
Fig. 1.29 Aortic occlusion.
a The interrupted color flow is caused by the shadowing due to wall calcification.
b Occlusion of the superior mesenteric artery: no arterial flow. AO = aorta; TR = celiac trunk (see  1.3 d–g).
c Acute thrombotic occlusion of the common femoral artery (AFC).
dand e Chronic limb ischemia.
dHigh-grade stenosis of the left iliac artery (AIS).
e Following complete occlusion of the superficial femoral artery (AFS). Stenosis of the profound femoral artery (AFP).
Fig. 1.30 Chronic long segment occlusion of the femoral artery (AF).
a Slowed preocclusive flow, absence of color flow distally, slight increase of echogenicity.
b Collaterals refill the popliteal artery (AP). VP = popliteal vein.
Anastomotic/Bypass Stenosis


Stenosis within a bypass, at its proximal segment, or at the anastomosis is easily identified sonographically by localized thickening of the
wall with encroachment of the lumen, while color-flow Doppler scanning will demonstrate increased peak systolic velocity. An insufficient
bypass is assumed when flow velocity decreases below 40 cm/s (Fig.1.31).
Fig. 1.31 Stent in the CCA (a and b)23 and in the region of the ECA.
a The stent (arrow) appears as an interrupted echogenic band.
b Carotid stent. Segments are devoid of color flow due to acoustic shadowing.
c Carotid stent for external carotid artery stenosis. Vmax indicates 70% stenosis.
18