

- •Contents
- •Preface
- •Contributors
- •1 Vessels
- •1.1 Aorta, Vena Cava, and Peripheral Vessels
- •Aorta, Arteries
- •Anomalies and Variant Positions
- •Dilatation
- •Stenosis
- •Wall Thickening
- •Intraluminal Mass
- •Perivascular Mass
- •Vena Cava, Veins
- •Anomalies
- •Dilatation
- •Intraluminal Mass
- •Compression, Infiltration
- •1.2 Portal Vein and Its Tributaries
- •Enlarged Lumen Diameter
- •Portal Hypertension
- •Intraluminal Mass
- •Thrombosis
- •Tumor
- •2 Liver
- •Enlarged Liver
- •Small Liver
- •Homogeneous Hypoechoic Texture
- •Homogeneous Hyperechoic Texture
- •Regionally Inhomogeneous Texture
- •Diffuse Inhomogeneous Texture
- •Anechoic Masses
- •Hypoechoic Masses
- •Isoechoic Masses
- •Hyperechoic Masses
- •Echogenic Masses
- •Irregular Masses
- •Differential Diagnosis of Focal Lesions
- •Diagnostic Methods
- •Suspected Diagnosis
- •3 Biliary Tree and Gallbladder
- •3.1 Biliary Tree
- •Thickening of the Bile Duct Wall
- •Localized and Diffuse
- •Bile Duct Rarefaction
- •Localized and Diffuse
- •Bile Duct Dilatation and Intraductal Pressure
- •Intrahepatic
- •Hilar and Prepancreatic
- •Intrapancreatic
- •Papillary
- •Abnormal Intraluminal Bile Duct Findings
- •Foreign Body
- •The Seven Most Important Questions
- •3.2 Gallbladder
- •Changes in Size
- •Large Gallbladder
- •Small/Missing Gallbladder
- •Wall Changes
- •General Hypoechogenicity
- •General Hyperechogenicity
- •General Tumor
- •Focal Tumor
- •Intraluminal Changes
- •Hyperechoic
- •Hypoechoic
- •Nonvisualized Gallbladder
- •Missing Gallbladder
- •Obscured Gallbladder
- •4 Pancreas
- •Diffuse Pancreatic Change
- •Large Pancreas
- •Small Pancreas
- •Hypoechoic Texture
- •Hyperechoic Texture
- •Focal Changes
- •Anechoic Lesion
- •Hypoechoic Lesion
- •Isoechoic Lesion
- •Hyperechoic Lesion
- •Irregular (Complex Structured) Lesion
- •Dilatation of the Pancreatic Duct
- •Marginal/Mild Dilatation
- •Marked Dilatation
- •5 Spleen
- •Nonfocal Changes of the Spleen
- •Diffuse Parenchymal Changes
- •Large Spleen
- •Small Spleen
- •Focal Changes of the Spleen
- •Anechoic Mass
- •Hypoechoic Mass
- •Hyperechoic Mass
- •Splenic Calcification
- •6 Lymph Nodes
- •Peripheral Lymph Nodes
- •Head/Neck
- •Extremities (Axilla, Groin)
- •Abdominal Lymph Nodes
- •Porta Hepatis
- •Splenic Hilum
- •Mesentery (Celiac, Upper and Lower Mesenteric Station)
- •Stomach
- •Focal Wall Changes
- •Extended Wall Changes
- •Dilated Lumen
- •Narrowed Lumen
- •Small/Large Intestine
- •Focal Wall Changes
- •Extended Wall Changes
- •Dilated Lumen
- •Narrowed Lumen
- •8 Peritoneal Cavity
- •Anechoic Structure
- •Hypoechoic Structure
- •Hyperechoic Structure
- •Anechoic Structure
- •Hypoechoic Structure
- •Hyperechoic Structure
- •Wall Structures
- •Smooth Margin
- •Irregular Margin
- •Intragastric Processes
- •Intraintestinal Processes
- •9 Kidneys
- •Anomalies, Malformations
- •Aplasia, Hypoplasia
- •Cystic Malformation
- •Anomalies of Number, Position, or Rotation
- •Fusion Anomaly
- •Anomalies of the Renal Calices
- •Vascular Anomaly
- •Diffuse Changes
- •Large Kidneys
- •Small Kidneys
- •Hypoechoic Structure
- •Hyperechoic Structure
- •Irregular Structure
- •Circumscribed Changes
- •Anechoic Structure
- •Hypoechoic or Isoechoic Structure
- •Complex Structure
- •Hyperechoic Structure
- •10 Adrenal Glands
- •Enlargement
- •Anechoic Structure
- •Hypoechoic Structure
- •Complex Echo Structure
- •Hyperechoic Structure
- •11 Urinary Tract
- •Malformations
- •Duplication Anomalies
- •Dilatations and Stenoses
- •Dilated Renal Pelvis and Ureter
- •Anechoic
- •Hypoechoic
- •Hypoechoic
- •Hyperechoic
- •Large Bladder
- •Small Bladder
- •Altered Bladder Shape
- •Intracavitary Mass
- •Hypoechoic
- •Hyperechoic
- •Echogenic
- •Wall Changes
- •Diffuse Wall Thickening
- •Circumscribed Wall Thickening
- •Concavities and Convexities
- •12.1 The Prostate
- •Enlarged Prostate
- •Regular
- •Irregular
- •Small Prostate
- •Regular
- •Echogenic
- •Circumscribed Lesion
- •Anechoic
- •Hypoechoic
- •Echogenic
- •12.2 Seminal Vesicles
- •Diffuse Change
- •Hypoechoic
- •Circumscribed Change
- •Anechoic
- •Echogenic
- •Irregular
- •12.3 Testis, Epididymis
- •Diffuse Change
- •Enlargement
- •Decreased Size
- •Circumscribed Lesion
- •Anechoic or Hypoechoic
- •Irregular/Echogenic
- •Epididymal Lesion
- •Anechoic
- •Hypoechoic
- •Intrascrotal Mass
- •Anechoic or Hypoechoic
- •Echogenic
- •13 Female Genital Tract
- •Masses
- •Abnormalities of Size or Shape
- •Uterus
- •Abnormalities of Size or Shape
- •Myometrial Changes
- •Intracavitary Changes
- •Endometrial Changes
- •Fallopian Tubes
- •Hypoechoic Mass
- •Anechoic Cystic Mass
- •Solid Echogenic or Nonhomogeneous Mass
- •14 Thyroid Gland
- •Diffuse Changes
- •Enlarged Thyroid Gland
- •Small Thyroid Gland
- •Hypoechoic Structure
- •Hyperechoic Structure
- •Circumscribed Changes
- •Anechoic
- •Hypoechoic
- •Isoechoic
- •Hyperechoic
- •Irregular
- •Differential Diagnosis of Hyperthyroidism
- •Types of Autonomy
- •15 Pleura and Chest Wall
- •Chest Wall
- •Masses
- •Parietal Pleura
- •Nodular Masses
- •Diffuse Pleural Thickening
- •Pleural Effusion
- •Anechoic Effusion
- •Echogenic Effusion
- •Complex Effusion
- •16 Lung
- •Masses
- •Anechoic Masses
- •Hypoechoic Masses
- •Complex Masses
- •Index
2
Liver
■ Diffuse Changes in Hepatic Parenchyma
The settings of the equipment used will have a profound impact on the sonographer’s ability to recognize and assess diffuse changes in the hepatic parenchyma. Apart from a careful analysis of the actual shape, texture, echogenicity, and distribution of the individual echoes representing the parenchyma, a successful overall assessment of the liver has to include as many additional criteria as possible (Table 2.6). Only by putting together the various criteria like pieces of a puzzle will a reliable assessment of this organ be achieved. One possibility, although to be used with caution, is a comparison of the hepatic parenchyma with that of other organs (kidney, spleen, pancreas, psoas muscle) ( 2.2a). This caveat has to do with the fact that apart from disease one has to take into
Parametric Ultrasonography
Parametric ultrasonography generates numbers, not images. This is supposed to neutralize any subjective bias on the part of the sonographer as well as any possible objective bias due to the presettings and/ or equipment used. Not only can tissues be detected and described objectively, but it is also possible to quantify and document the
account that aging will alter the characteristics of the different parenchymas differently (Table 2.7).
Thus, assessment of diffuse changes in the hepatic parenchyma is still influenced by any
brightness and homogeneity. These digital signals are then processed and compared by various statistical computer programs, and the result opens up the possibility of noninvasive classification of diffuse tissue changes in ultrasonography, objective quality control in ultrasound equipment, and improved imaging.
number of subjective aspects, and to a large extent depends on the sonographer’s experience.
Table 2.7 Comparison of hepatic parenchyma with other organs |
|
|
|
|
||
Criterion |
|
Liver |
Spleen |
Kidney |
Pancreas |
Psoas muscle |
Single echo |
Size |
++ |
+ |
+++ |
+ |
++ |
|
Echogenicity |
++ |
+++ |
+ |
+ – +++ |
+ – ++ |
|
Brightness |
++ |
+ |
++ |
+ |
++ |
|
Distribution |
Homogeneous |
Homogeneous |
Inhomogeneous |
Homogeneous |
Structured |
Age-dependent changes |
|
Slight |
Yes |
Slight |
Distinct |
Slight |
Function-dependent changes |
|
– |
– |
Yes |
– |
Distinct |
Disease-dependent changes |
|
++ |
+ |
++ |
+++ |
+ |
Enlarged Liver
|
|
|
Diffuse Changes in Hepatic |
||
Liver |
|||||
Parenchyma |
|||||
|
|
|
|||
|
|
|
|
Enlarged Liver |
|
Small Liver
Homogeneous Hypoechoic Texture
Homogeneous Hyperechoic Texture
Regionally Inhomogeneous
Texture
Diffuse Inhomogeneous Texture
Localized Changes in Hepatic
Parenchyma
Differential Diagnosis of Focal Lesions
Congested Liver
Fatty Liver
Fatty Liver Hepatitis
Fatty Cirrhosis
Diffuse Infiltration
When the liver increases in volume, this does |
may be compensated by a change in shape. |
nized finding that is often overlooked and be- |
not necessarily become evident on a quantita- |
Sometimes the increase is noticed and docu- |
comes evident only in its more advanced |
tive level because of the distinct interpersonal |
mented only during follow-up studies. En- |
stages. |
variability of this organ or because the change |
largement of the liver is therefore an unrecog- |
|
70

Determining the Size of the Liver
Sonographic assessment of the size of the liver is fraught with problems.
Volumetric measurements yield a value of around 1/40 of the body weight (2.3–3%); for the average adult male this would mean 1500–1800 mL and for the adult female 1200–1500 mL.
Organ measurements yield a width (right– left) of 25–30 cm, a length (cephalocaudad) of 12–20 cm, and a sagittal depth (anteroposterior) of 6–10 cm. Different shapes are encountered depending on the build: in asthenic persons the liver expands mostly in the longitudinal direction, while in thick-set persons the largest dimension is in the sagittal plane. Therefore, the build alone will account for different normal values of size.
In ultrasonography the size of the liver is determined in the right midclavicular line (MCL), a normal value being 12 cm (9 cm in pyknics, up to 15 cm in asthenics). Assessment of the superior diaphragmatic aspect is critical, since ultrasound may not be able to clearly delineate the boundary because of superposition of the phrenicocostal sinus, and percussion is rather imprecise.
One option would be assessment of the inferior border at the costal margin; however, this value also varies widely depending on the build of the patient (normal: inferior edge at the costal margin), and cannot be relied on because of the respiratory motion of the liver or abnormal position of the diaphragm (emphysema, phrenic nerve palsy). Sagittal measurements also display a rather wide margin of error since there are no fixed markers to be used in reconstruction.
Determining the size of the caudate lobe, either in absolute terms or in relation to the right hepatic lobe, may aid in the presumed diagnosis of cirrhosis or Budd–- Chiari syndrome.
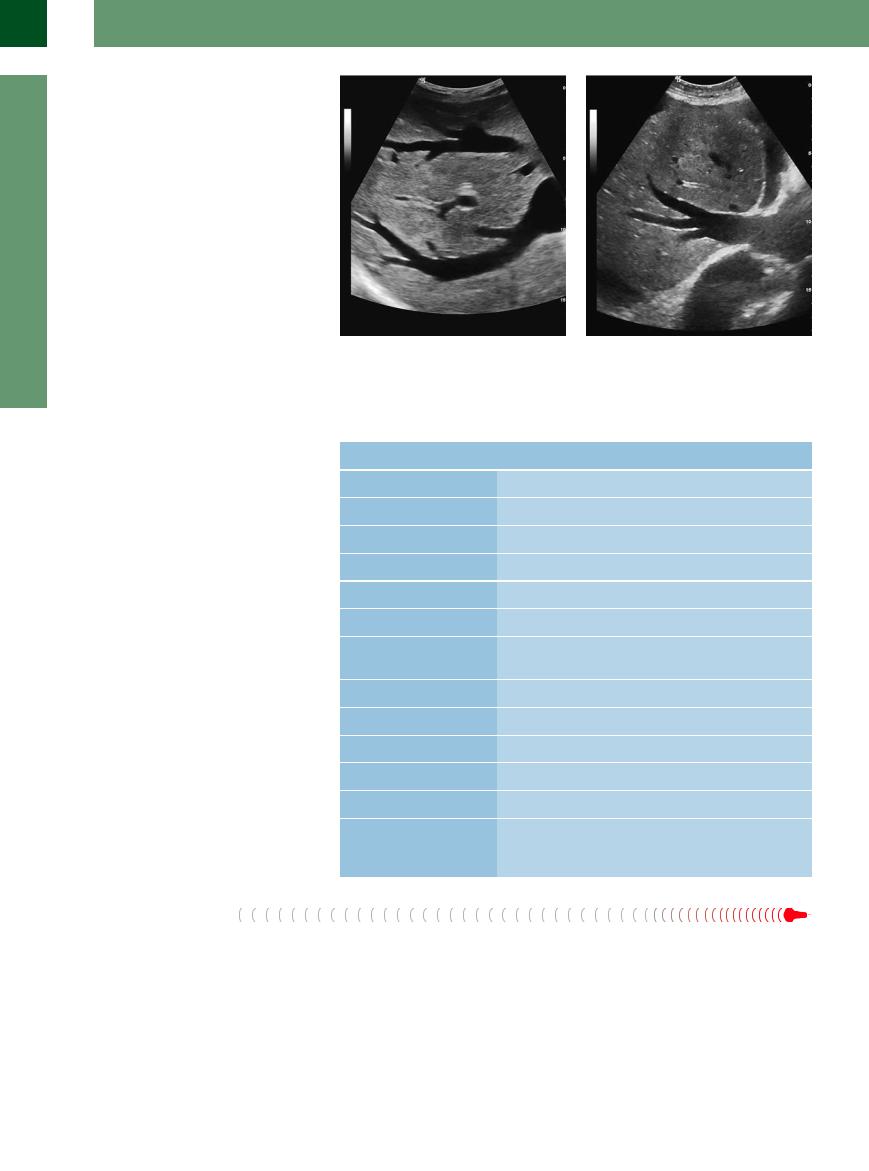
When assessing the size of the liver, the intersegmental comparison and the relation between right and left hepatic lobe (normal: left < right) have to be considered as well. If the left hepatic lobe slides in between the spleen and the diaphragm, displacing the spleen inferiorly, this is a firm sign of an enlarged left hepatic lobe (Fig. 2.16).
Fig. 2.16 Hepatomegaly should be documented by measurement. An enlargement of the left liver lobe may be identified by its position between the diaphragm and the spleen (“kissing phenomenon”): cranial, the hyperechoic liver (fatty liver); caudal, the normal spleen.
Congested Liver
Liver


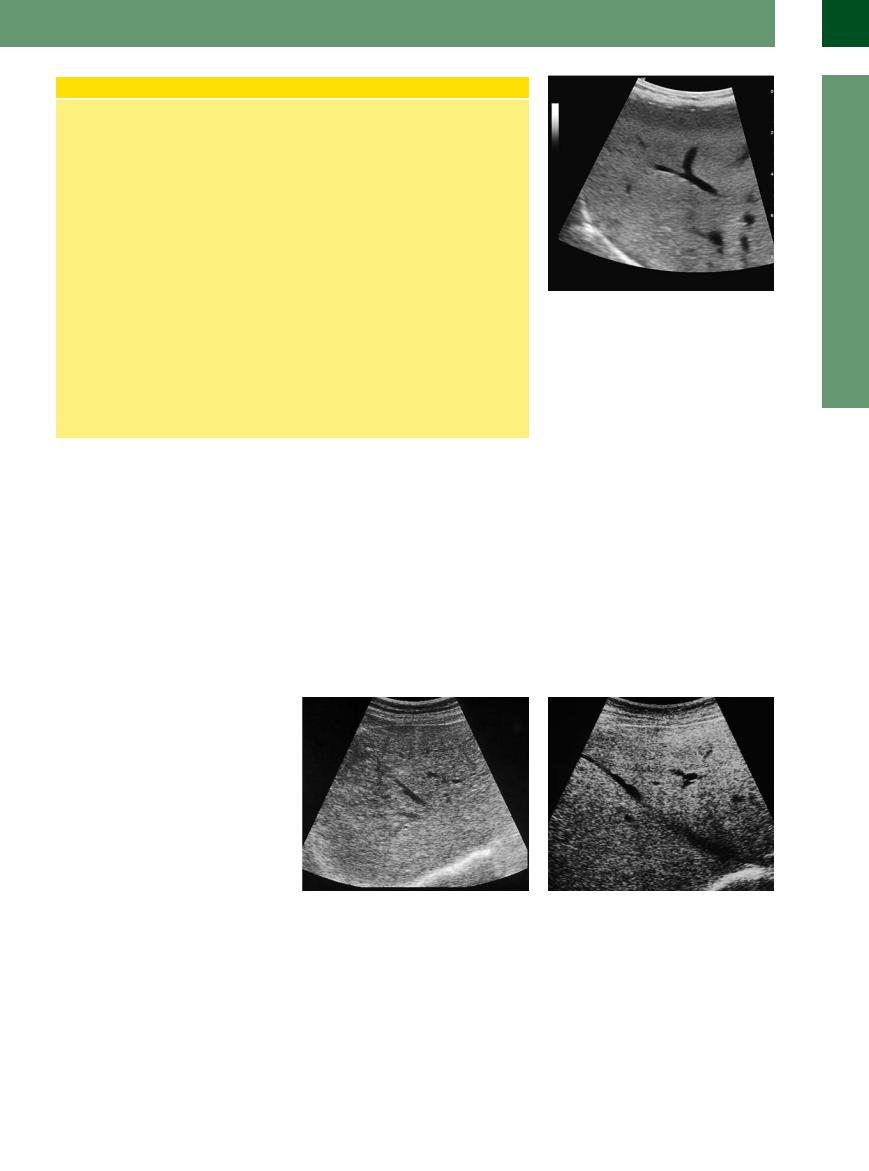
Acute congestion of the liver (Fig. 2.17, Fig. 2.18). In cases of acute liver congestion the liver is usually characterized by a significant increase in size; this is due to congestion of the vena cava, normally caused by cardiac insufficiency, which leads to blood backing up into the liver, thus increasing its volume (edema) and providing the explanation for the decreased echogenicity as well as the improved ultrasound image of the organ. On the other hand, quite often this will lead to capsular tension and pain. The liver has a smooth surface; the inferior margin is obtusely angled or round. The organ is tightly elastic/firm and quite tender (on palpation); sometimes an expansive hepatic pulse may be palpated. The hypoechoic parenchyma has a “fluffy” appearance with improved conduction of the ultrasound beam. Characteristic signs are the distended hepatic veins, which can be visualized all the way into the periphery of the liver, and the engorged junction of the hepatic veins at the vena cava (“venous star”). Regular B-mode imaging already displays realtime turbulent flow in the hepatic veins, which is shown rather impressively in duplex and color-flow duplex scanning with an increased percentage of flow reversal and the typical change in the pulsed Doppler curve (see “Venous Flow Pattern”, p. 64).
The diagnosis of acute congestion of the liver, suspected on abdominal ultrasound, is firmed up by additional findings, such as ascites, pleural effusion, incompressible enlarged lumen of the vena cava, and congestion-in- duced sequelae in other organs (kidneys, spleen, stomach).
Fig. 2.17 Junction of the hepatic veins in acute hepatic congestion. Hypoechoic homogeneous parenchyma of the liver resulting from the edema: rigid engorged hepatic veins and vena cava signifying congestion of the vena cava. Other criteria are increased size and consistency, possibly tenderness on palpation.
Chronic congestion of the liver (Fig. 2.19, Fig. 2.20,  2.4a,b). Although chronic congestion of the liver also may present as substantial enlargement of the organ, it is primarily characterized by extended fibrotic changes; in other words, the increase in size may not be quite apparent or it might be mimicked by a low position of the liver in the abdomen without any actual increase in size (e. g., in emphysema). These fibrotic changes (“cardiac cirrho-
Fig. 2.18 Junction of the hepatic veins in acute failure of preexisting chronic hepatic congestion. Homogeneous parenchyma with an increased number of diffusely dispersed, finely grained echoes; rigid engorged hepatic veins and vena cava.
sis”) may result in the organ becoming smaller and would explain the distinct increase in consistency as well as the increasing echogenicity. The hepatic surface is smooth, possibly slightly irregular because of the ongoing fibrosis, the inferior margin is blunt or sharply angled. Sometimes an expansive hepatic pulse may be palpated. Capsular tension with concomitant pain would be unusual for chronic hepatic congestion, as it is more characteristic of acute
2
Diffuse Changes in Hepatic Parenchyma
71
2
Liver
decompensation of the underlying congestion of the vena cava. As is also the case in acute hepatic congestion, the engorged hepatic veins can be visualized far into the periphery of the liver, and the junction of the hepatic veins at the vena cava is enlarged too.
Just as in acute congestion of the liver, duplex and color-flow duplex scanning demonstrate the impressive flow changes. The cardiac modulation may affect the duplex curve of the portal system. Sometimes there may be additional findings, such as ascites, pleural effusion, rigid enlarged lumen of the vena cava, and congestion-induced changes in other organs (kidneys, spleen, stomach). Table 2.8 is a summary of the criteria relevant in acute and chronic congestion of the liver.
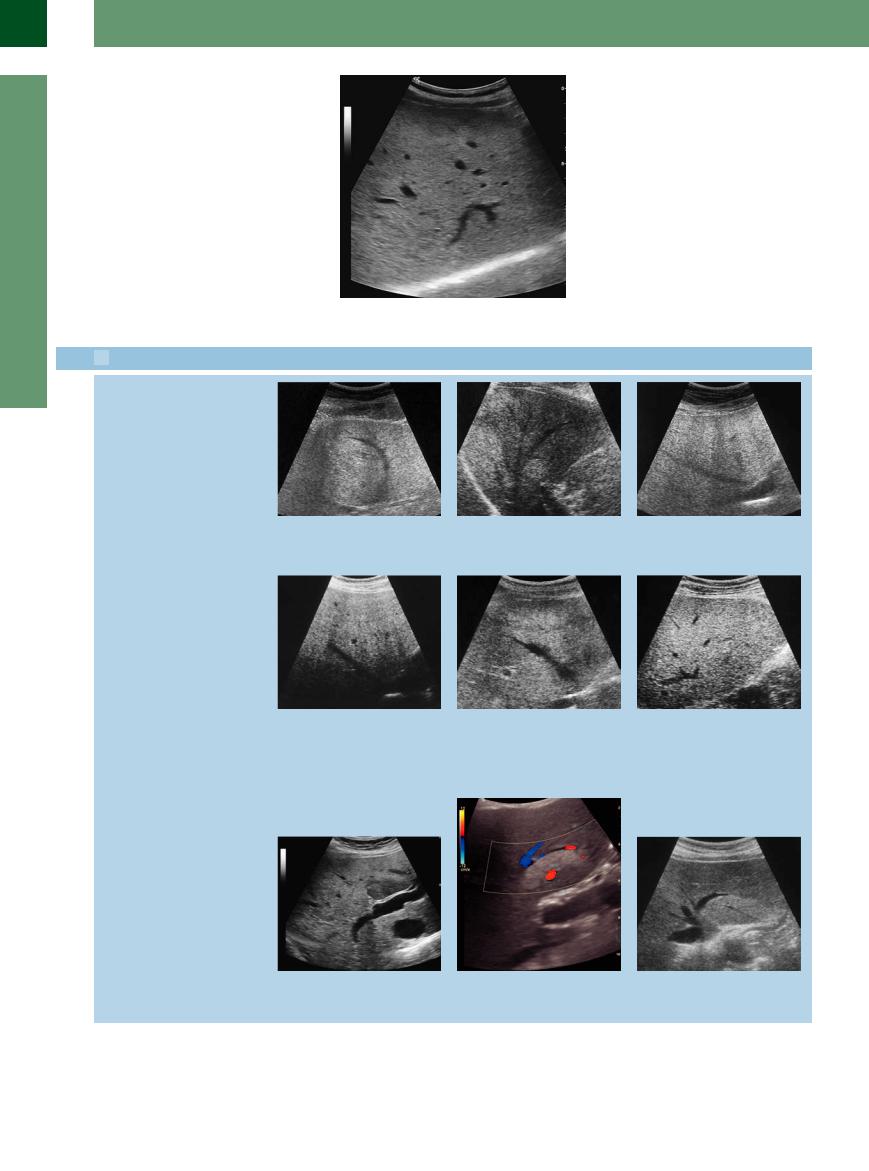
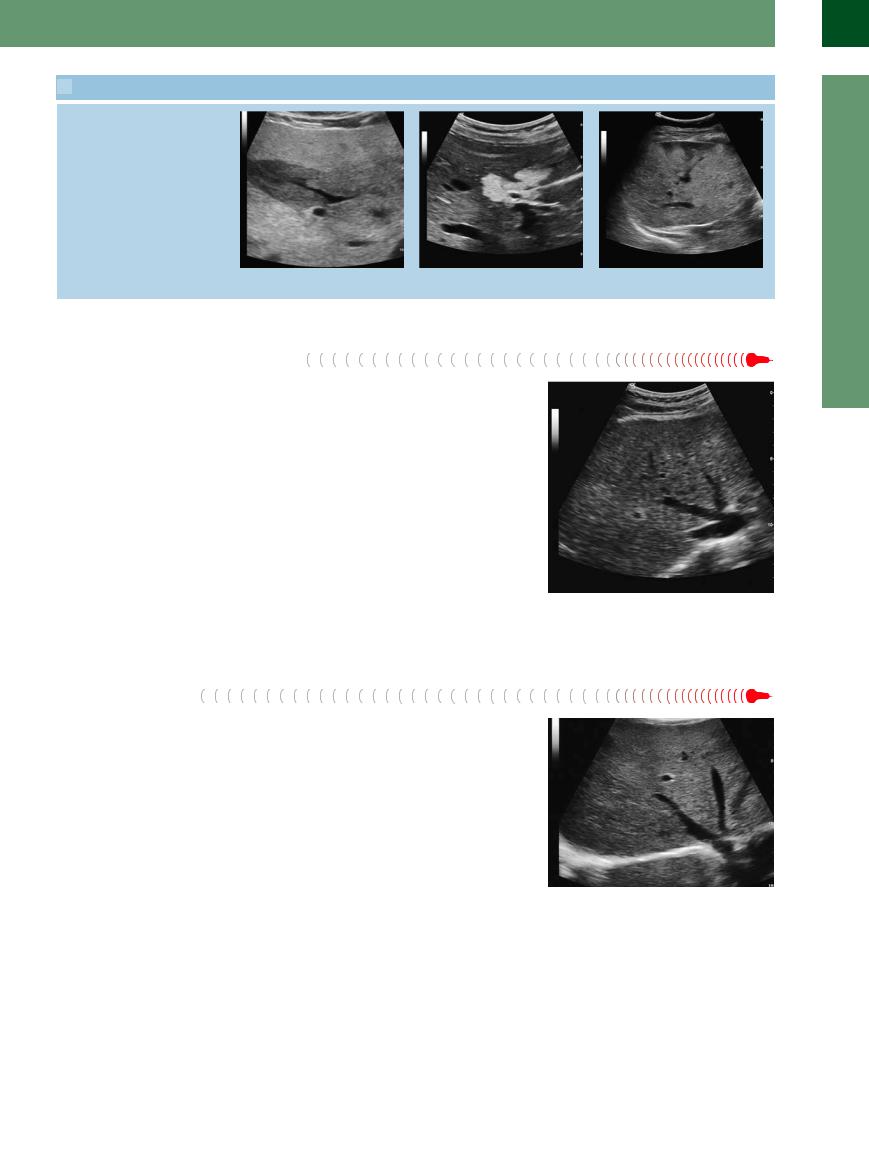
Fig. 2.19 The same congestive liver seen in Fig. 2.18; the congested liver veins are reaching into the peripheral regions of the liver parenchyma.
Fig. 2.20 Cardiac cirrhosis. Irregular surface and homogeneous parenchyma; the engorged hepatic vein is visible far into the periphery. Signs of ascites and right pleural effusion (not seen here).
Fatty Liver (
(
 2.6)
2.6)
Extrinsic and dynamic criteria. Fatty infiltration of the hepatic parenchyma is a frequent but nonspecific finding, increasing the volume of the liver and thus its size. Initially, this increase in total organ volume manifests itself by a change in the shape; the increased size of the liver as such becomes evident and can be quantified only in the more advanced stages. But even then the organ will still have a smooth surface and exhibit a normal soft consistency.
Table 2.8 Sonographic diagnostic criteria used in acute/chronic congestion of the liver
Criterion |
Acute hepatic congestion |
Chronic hepatic congestion |
Size |
Enlarged |
Normal or enlarged |
Shape |
Biconvex |
Biconvex |
Surface |
Smooth |
Smooth/irregular |
Contour of margin |
Blunt |
Blunt |
Parenchymal structure |
Hypoechoic, homogeneous |
Hyperechoic, homogeneous |
Ultrasound conduction |
Improved |
Normal |
Hepatic veins |
Engorged, can be imaged far |
Engorged, can be imaged far |
|
into the periphery |
into the periphery |
Portal veins |
(Marked) |
(Marked) |
Hepatic artery |
No characteristic change |
No characteristic change |
Respiratory motion |
Present or lessened |
Present or lessened |
Consistency |
Tightly elastic |
Firm |
Tenderness |
Marked |
None |
Other |
Ascites/pleural e usion/peri- |
Ascites/pleural e usion/peri- |
|
cardial e usion, rigid engorged |
cardial e usion, rigid en- |
|
vena cava |
gorged vena cava |
The inferior margin of the liver becomes more and more blunt while the angle increases. The left hepatic lobe becomes biconvex and the inferior margin almost round (so-called rounding of the organ).
Intrinsic criteria. Since fatty infiltration of the cells goes hand in hand with an increased liver volume, the vessels are pushed apart, the hepatic veins take a somewhat curved course, and
their branching is no longer sharply angled but obtuse (Fig. 2.21). The regular well-defined contour of the hepatic veins becomes blurred: this artifact is due to the increased refraction and scattering of the ultrasound waves at the numerous boundaries of the individual fatty vesicles within the hepatocytes and can be demonstrated at all contours.
72
Fatty Changes of the Liver
Definition. Fatty liver or steatosis hepatis is present if the moist mass of the liver contains >10% fat, or if more than 50% of the hepatic cells display medium-sized or large lipid vacuoles and there is a diffuse pattern of distribution.
Pathogenesis. The causes of underlying fatty change may be exogenous:
●Increased fat transport
●Increased carbohydrate intake
or endogenous:
●Increased peripheral mobilization of fat
●Inhibited intracellular utilization of fat in the hepatic cells
●Increased fat synthesis in the hepatic cells
●Decreased removal of fat
Morphology. Morphology differentiates between small, medium, and large lipid vacuoles with low (5% of the moist mass
of the liver), moderate (6–8%), and marked (8–9%) involvement of the liver. The distribution pattern of the fatty change can be classified as peripheral, centroacinar, zonal, or diffuse.
Etiology. In terms of etiology, fatty liver is encountered as a nonspecific reaction in numerous diseases and conditions; these include:
●Overweight
●Metabolic disorders
●Alcohol
●Medication
●Chemical substances
●Phytotoxins and mycotoxins
●Infection
●Hypoxia
●Endocrine disorders
●Pregnancy
Fig. 2.21 Fatty liver/fatty liver hepatitis. Large right hepatic lobe with a diffuse increase in the delicate to moderate echotexture, which appears more densely packed, and signals fatty infiltration; the beginning inflammation is characterized by the irregular contour of the hepatic veins.
This increase in boundaries is also the reason for the typical increased echogenicity and degraded ultrasound conduction (i. e., attenuation). The degree of fatty infiltration, the type of fatty deposits in the hepatocytes (large vesicles = few additional boundaries; or small vesicles = numerous additional boundaries), the type of fat, and additional factors (severity of any concomitant inflammation, degree of fibrosis) will define any changes in the echotexture, in particular any changes in the num-
ber, size, and density of the echoes as well as in the degree of attenuation (Figs. 2.22, 2.23, 2.24). The homogeneous distribution of the echoes may vary between segments or regions but still remains one of the basic characteristics of fatty liver.
Causes. By itself, the sonographic finding of fatty liver cannot tell us anything about the underlying cause. Nutrition may be assumed as probable cause if there are also fatty changes
in other organs (abdominal wall, pancreas, body mass index (BMI) > 24), in which case the fatty changes in the liver could be regarded as “normal” findings. However, if a slim patient with a thin abdominal wall (BMI < 24) exhibits fatty liver whose consistency is significantly softer or harder than normal, this finding would have to be assessed as pathological and would mandate further work-up.
Fatty Liver Hepatitis
 (
( 2.6)
2.6) 


In fatty liver hepatitis (Figs. 2.22, 2.23, 2.24) (e. g., alcoholic hepatitis (ASH), nonalcoholic steatohepatitis (NASH), chemotherapy-associ- ated steatohepatitis (CASH), diabetic fatty liver), the fatty infiltration is accompanied by necrosis and inflammatory changes with fibrosis. Apart from the sonographic signs of fatty deposits discussed above, this results in sclerosis of the liver and a decreased plasticity. The surface still remains smooth.
Fig. 2.22 Fatty liver hepatitis. Large right hepatic lobe with |
Fig. 2.23 Chronic toxic fatty liver hepatitis. Large right |
a diffuse increase in the delicate and particularly the |
hepatic lobe with a marked diffuse increase in the mod- |
moderate echotexture, which appears more densely |
erate echotexture, which appears more densely packed |
packed and with irregular graininess; the hepatic veins |
and with irregular graininess. The hepatic veins appear |
exhibit a network-like and disjointed appearance, the |
irregular and smooth-margined vessels are a sign of in- |
fatty infiltration and inflammation blurring their con- |
flammatory reaction. The fatty infiltration is detectable |
tours. |
by the echogenic structure and blurring contour; the |
|
inflammatory reaction is progressing. |
2
Diffuse Changes in Hepatic Parenchyma
73
2
Liver
The decisive aspect is the changes in the hepatic veins: contrary to their somewhat curved course in simple fatty liver, they now appear as an entire network but can only be imaged in a disjointed fashion, with some fragments visible while whole other segments are missing. Artifacts will blur the contours of the hepatic veins and ultrasonography will show irregular walls due to perivenous inflammation. Ultimately, increasing fibrosis and scarring will lead to fatty cirrhosis, the transition between these states being fairly fluid.
Fig. 2.24 Chronic toxic fatty liver hepatitis. Large right hepatic lobe with a marked diffuse increase of more densely packed echoes; the hepatic veins exhibit a net- work-like and disjointed appearance. The surface is smooth. No evidence of attenuation of the ultrasound beam.

 2.6 Fatty Liver, Fatty Liver Hepatitis, and Focal Fatty Infiltration
Fatty liver leads to increased structural density, curved course of the liver veins, attenuation, diffraction, and dispersion on the boundary interfaces, and runtime artifacts with blurring of the contour
Fatty liver/fatty liver hepatitis
Regional differences in fatty infiltration (FFI); the fatty liver may occur diffusely but also focally with regionally differing fatty infiltration
a–c Fatty liver.
a The displaced hepatic veins no longer run in a straight line but are slightly curved and poorly delimited.
d Increasing fatty infiltration will diminish the echodensity and increase the attenuation.
b Inhomogeneity.
e The additional inflammatory changes in diabetic or toxic fatty liver or nonalcoholic steatohepatitis induce irregular margins of the hepatic veins; here, a case of diabetic fatty liver hepatitis with focal inhomogeneous fatty infiltration.
c Increased fine echoes in near-normal conduction of sound.
f The inflammatory changes with increased echogenicity may prevail, leading to inhomogeneous and coarsened parenchymal structures inducing irregular margins and rarefied hepatic veins; here, a case of diabetic fatty liver hepatitis and toxic fatty liver.
g FFI: hypoechoic formation in a typical location at the inferior aspect of segment IV in the left hepatic lobe anterior to the portal bifurcation.
h and i FFI of segment II in the left hepatic lobe; the parenchyma with its increased fatty infiltration appears hyperechoic.
74
 2.6 Fatty Liver, Fatty Liver Hepatitis, and Focal Fatty Infiltration (Continued)
j–l FFI may parallel the vessels and display bizarre, map-like irregular margins.
Fatty Cirrhosis


In fatty cirrhosis (Fig. 2.25) the liver has turned into a densely firm organ. In many cases there is a distinct shift in the mass relation of the lobes from right to left, with a more significant increase in the mass of the left lobe, and the right hepatic lobe even appearing smaller than normal. The caudate lobe may become quite prominent. The fine nodular surface in fatty cirrhosis can only be visualized by high-reso- lution probes; during routine studies the liver presents with a smooth surface. The individual echoes of the hepatic parenchyma are coarse, hyperechoic, and arranged as a homogeneous texture. A marked degradation in ultrasound
conduction can be detected. One typical finding is the hepatic veins beginning to rarify; however, in contrast to posthepatitic cirrhosis, they are still easily recognized. The portovenous system is prominent and exhibits distinct so-called periportal reinforcement, a scabby knotted bifurcation of the portal vein, enlarged central aspect of the vascular tree, and distinct caliber changes at the more peripheral segments. Other criteria of cirrhosis may also be evident: e. g., ascites, splenomegaly, thickening of the gallbladder wall, and collaterals in portal hypertension.
Fig. 2.25 Fatty cirrhosis. Liver with marked diffuse increase in moderately and coarsely textured echoes, which display irregular graininess and are more densely packed; the junction of the hepatic veins appears stunted, and the peripheral segments of the hepatic veins seem rarefied.
Diffuse Infiltration
Diffuse infiltration with an increased liver size may be the result of extracellular or intracellular substrate deposits.
Intracellular deposits. Apart from fatty infiltration as discussed above, these deposits are also encountered in other storage diseases such as hemochromatosis (Fig. 2.26) and the glycogen storage diseases. Just as in fatty liver, not only the echogenicity of the parenchyma increase but so also does sclerosis of the liver. The vascular architecture, particularly that of the hepatic veins, remains unchanged for a long time.
Extracellular infiltrations. These may be caused by fluid (edema) or cellular mechanisms (e. g., chronic lymphocytic leukemia) and lead to increased size and sclerosis of the
organ, with a typical decrease in parenchymal echogenicity but improved conduction. In many cases the echoes display a homogeneous/diffuse distribution, though regional differences (perivenous) or segmental patterns are also quite common.
Hepatomegaly can be caused by a diffuse infiltration of the liver by clusters of tumor cells or metastasis. These might not be distinguishable from the surrounding liver tissue due to low echogenic differentiation and missing indirect tumor signs (see below) or be only slightly detectable as a parenchymal inhomogeneity (e. g., diffuse liver metastasis in breast cancer or hepatomegaly in CASH seen during ultrasound monitoring in tumors with known liver metastasis; in these cases CEUS is a possibility for further assessment (see below)).
Fig. 2.26 Hemochromatosis. Early stage with diffuse induration of the parenchyma with normal vascular structure. In contrast to the fatty liver, sharp and smooth-margined vessels.
2
Diffuse Changes in Hepatic Parenchyma
75