

- •Contents
- •Preface
- •Contributors
- •1 Vessels
- •1.1 Aorta, Vena Cava, and Peripheral Vessels
- •Aorta, Arteries
- •Anomalies and Variant Positions
- •Dilatation
- •Stenosis
- •Wall Thickening
- •Intraluminal Mass
- •Perivascular Mass
- •Vena Cava, Veins
- •Anomalies
- •Dilatation
- •Intraluminal Mass
- •Compression, Infiltration
- •1.2 Portal Vein and Its Tributaries
- •Enlarged Lumen Diameter
- •Portal Hypertension
- •Intraluminal Mass
- •Thrombosis
- •Tumor
- •2 Liver
- •Enlarged Liver
- •Small Liver
- •Homogeneous Hypoechoic Texture
- •Homogeneous Hyperechoic Texture
- •Regionally Inhomogeneous Texture
- •Diffuse Inhomogeneous Texture
- •Anechoic Masses
- •Hypoechoic Masses
- •Isoechoic Masses
- •Hyperechoic Masses
- •Echogenic Masses
- •Irregular Masses
- •Differential Diagnosis of Focal Lesions
- •Diagnostic Methods
- •Suspected Diagnosis
- •3 Biliary Tree and Gallbladder
- •3.1 Biliary Tree
- •Thickening of the Bile Duct Wall
- •Localized and Diffuse
- •Bile Duct Rarefaction
- •Localized and Diffuse
- •Bile Duct Dilatation and Intraductal Pressure
- •Intrahepatic
- •Hilar and Prepancreatic
- •Intrapancreatic
- •Papillary
- •Abnormal Intraluminal Bile Duct Findings
- •Foreign Body
- •The Seven Most Important Questions
- •3.2 Gallbladder
- •Changes in Size
- •Large Gallbladder
- •Small/Missing Gallbladder
- •Wall Changes
- •General Hypoechogenicity
- •General Hyperechogenicity
- •General Tumor
- •Focal Tumor
- •Intraluminal Changes
- •Hyperechoic
- •Hypoechoic
- •Nonvisualized Gallbladder
- •Missing Gallbladder
- •Obscured Gallbladder
- •4 Pancreas
- •Diffuse Pancreatic Change
- •Large Pancreas
- •Small Pancreas
- •Hypoechoic Texture
- •Hyperechoic Texture
- •Focal Changes
- •Anechoic Lesion
- •Hypoechoic Lesion
- •Isoechoic Lesion
- •Hyperechoic Lesion
- •Irregular (Complex Structured) Lesion
- •Dilatation of the Pancreatic Duct
- •Marginal/Mild Dilatation
- •Marked Dilatation
- •5 Spleen
- •Nonfocal Changes of the Spleen
- •Diffuse Parenchymal Changes
- •Large Spleen
- •Small Spleen
- •Focal Changes of the Spleen
- •Anechoic Mass
- •Hypoechoic Mass
- •Hyperechoic Mass
- •Splenic Calcification
- •6 Lymph Nodes
- •Peripheral Lymph Nodes
- •Head/Neck
- •Extremities (Axilla, Groin)
- •Abdominal Lymph Nodes
- •Porta Hepatis
- •Splenic Hilum
- •Mesentery (Celiac, Upper and Lower Mesenteric Station)
- •Stomach
- •Focal Wall Changes
- •Extended Wall Changes
- •Dilated Lumen
- •Narrowed Lumen
- •Small/Large Intestine
- •Focal Wall Changes
- •Extended Wall Changes
- •Dilated Lumen
- •Narrowed Lumen
- •8 Peritoneal Cavity
- •Anechoic Structure
- •Hypoechoic Structure
- •Hyperechoic Structure
- •Anechoic Structure
- •Hypoechoic Structure
- •Hyperechoic Structure
- •Wall Structures
- •Smooth Margin
- •Irregular Margin
- •Intragastric Processes
- •Intraintestinal Processes
- •9 Kidneys
- •Anomalies, Malformations
- •Aplasia, Hypoplasia
- •Cystic Malformation
- •Anomalies of Number, Position, or Rotation
- •Fusion Anomaly
- •Anomalies of the Renal Calices
- •Vascular Anomaly
- •Diffuse Changes
- •Large Kidneys
- •Small Kidneys
- •Hypoechoic Structure
- •Hyperechoic Structure
- •Irregular Structure
- •Circumscribed Changes
- •Anechoic Structure
- •Hypoechoic or Isoechoic Structure
- •Complex Structure
- •Hyperechoic Structure
- •10 Adrenal Glands
- •Enlargement
- •Anechoic Structure
- •Hypoechoic Structure
- •Complex Echo Structure
- •Hyperechoic Structure
- •11 Urinary Tract
- •Malformations
- •Duplication Anomalies
- •Dilatations and Stenoses
- •Dilated Renal Pelvis and Ureter
- •Anechoic
- •Hypoechoic
- •Hypoechoic
- •Hyperechoic
- •Large Bladder
- •Small Bladder
- •Altered Bladder Shape
- •Intracavitary Mass
- •Hypoechoic
- •Hyperechoic
- •Echogenic
- •Wall Changes
- •Diffuse Wall Thickening
- •Circumscribed Wall Thickening
- •Concavities and Convexities
- •12.1 The Prostate
- •Enlarged Prostate
- •Regular
- •Irregular
- •Small Prostate
- •Regular
- •Echogenic
- •Circumscribed Lesion
- •Anechoic
- •Hypoechoic
- •Echogenic
- •12.2 Seminal Vesicles
- •Diffuse Change
- •Hypoechoic
- •Circumscribed Change
- •Anechoic
- •Echogenic
- •Irregular
- •12.3 Testis, Epididymis
- •Diffuse Change
- •Enlargement
- •Decreased Size
- •Circumscribed Lesion
- •Anechoic or Hypoechoic
- •Irregular/Echogenic
- •Epididymal Lesion
- •Anechoic
- •Hypoechoic
- •Intrascrotal Mass
- •Anechoic or Hypoechoic
- •Echogenic
- •13 Female Genital Tract
- •Masses
- •Abnormalities of Size or Shape
- •Uterus
- •Abnormalities of Size or Shape
- •Myometrial Changes
- •Intracavitary Changes
- •Endometrial Changes
- •Fallopian Tubes
- •Hypoechoic Mass
- •Anechoic Cystic Mass
- •Solid Echogenic or Nonhomogeneous Mass
- •14 Thyroid Gland
- •Diffuse Changes
- •Enlarged Thyroid Gland
- •Small Thyroid Gland
- •Hypoechoic Structure
- •Hyperechoic Structure
- •Circumscribed Changes
- •Anechoic
- •Hypoechoic
- •Isoechoic
- •Hyperechoic
- •Irregular
- •Differential Diagnosis of Hyperthyroidism
- •Types of Autonomy
- •15 Pleura and Chest Wall
- •Chest Wall
- •Masses
- •Parietal Pleura
- •Nodular Masses
- •Diffuse Pleural Thickening
- •Pleural Effusion
- •Anechoic Effusion
- •Echogenic Effusion
- •Complex Effusion
- •16 Lung
- •Masses
- •Anechoic Masses
- •Hypoechoic Masses
- •Complex Masses
- •Index
2
Liver
Regionally Inhomogeneous Texture
Liver

Diffuse Changes in Hepatic
Parenchyma
Enlarged Liver
Small Liver
Homogeneous Hypoechoic Texture
Homogeneous Hyperechoic Texture
Regionally Inhomogeneous
Texture
Diffuse Inhomogeneous Texture
Localized Changes in Hepatic
Parenchyma
Differential Diagnosis of Focal Lesions
Focal Fatty Infiltration
Necrosis
Portal Venous Gas Embolism
The sonographic texture of the hepatic parenchyma is determined by the size, density, brightness, and distribution/arrangement of the individual echoes. In other words, irregular ultrasound texture is the sequel to changes in one or more of these echo characteristics. These changes may pertain uniformly to the entire organ or just to a segment, region, or zone.
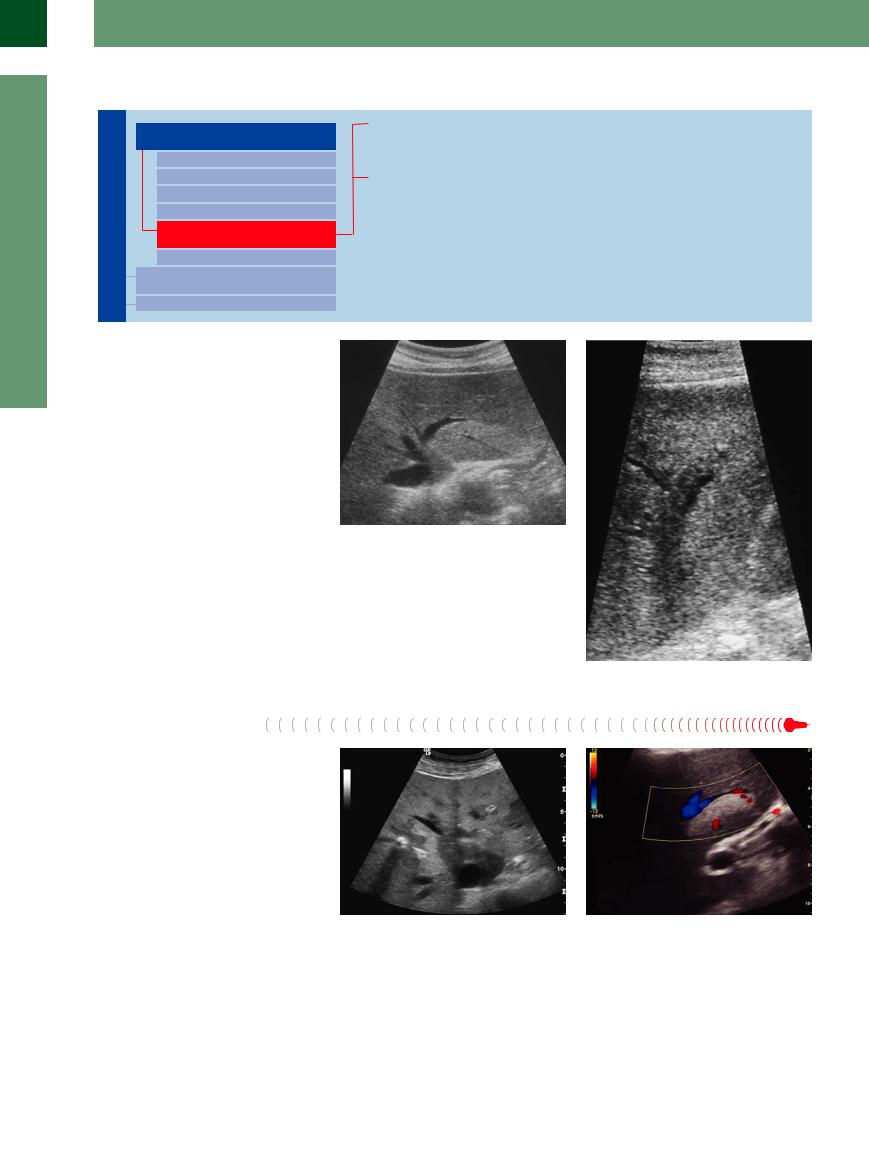
In parenchyma with limited segmental, regional or zonal irregularities (parenchyma with circumscribed “splotches”) one has to differentiate between changes found in one or more segments (Fig. 2.35), or those developing in typical perivenous fashion or along the portal structures ( 2.2 g and h), and those whose distribution appears without any semblance of order. In the latter case, in B-mode ultrasonography it becomes rather difficult to distinguish these changes from infiltrating metastatic changes (Fig. 2.36).
Fig. 2.35 Segmental inhomogeneity: varying degree of fatty infiltration of the liver (segment II): varying degree of fatty infiltration and/or heterogenetic fatty infiltration of the parenchyma, the segmental limits are respected; the portal branch runs unrestrained within this segment.
Fig. 2.36 Example of periportal inhomogeneity: periportal infiltration in metastatic pancreatic cancer.
Focal Fatty Infiltration
Focal fatty infiltration of the liver (FFI) appears as a mass within the classic findings of fatty liver ( 2.6, Figs. 2.35, 2.37, 2.38, 2.39) (see above). It is a rather common finding, characterized by the juxtaposition of two different areas of the parenchyma with echoes of the same size/brightness, which may be densely (hyperechoic) packed as a sign of high fat content or more loosely (hypoechoic) packed when fat content is low, but always displaying a homogeneous arrangement. The underlying pathologic etiology of this difference in density of the fatty infiltration is caused by an organic (aberrant vessels) or a functional failure of perfusion. These regional differences in density of the fatty infiltration can be seen more often in certain situations, such as nutritionally related or after narcosis fatty infiltration.
There are a number of prime locations for focal fatty infiltration (posteriorly in segment IV, at the gallbladder fossa, around the veins, left > right). Quite often they exhibit a smooth map-like delineation toward the neighboring
Fig. 2.37 Focal fatty infiltration. Inhomogeneous splotches of hyperechoic/hypoechoic parenchyma in the left hepatic lobe without involvement of the vessels.
Fig. 2.38 Segmental fatty infiltration. Hyperechoic parenchyma with fatty infiltration along segment II of the left hepatic lobe; tongue-like delineation of the fatty infiltration without any changes in the surface or the course of the vessels.
80

parenchyma but still fit in harmoniously with the hepatic architecture, i. e., they do not deform any boundaries, or change the surface, or alter the course of any vessels. Focal fatty infiltration seems to take place more frequently in certain situations, such as severe nutritional steatosis or after anesthesia. If B-mode ultrasonography is the only diagnostic modality used, it is sometimes impossible to differentiate between focal infiltration and diffuse metastasis, in which case abdominal CT or hepatobiliary scintiscanning would have to be employed. However, the difference can be easily detected if the homogeneous isoechogenic contrasting of the parenchyma of both densities can be seen in the portal phase of CEUS after the introduction of the contrast agent.
Fig. 2.39 Segmental fatty infiltration. Pseudotumorous pseudonodular hyperechoic areas respecting the boundaries and surfaces of vessels and segments.
Necrosis 


Segmental necrosis requires a break in the |
tion and is characterized by swelling and |
blood supply from the corresponding branch |
edema, with a hypoechoic, somewhat broken- |
of the portal vein as well as from the hepatic |
up, parenchyma. Older necrosis presents as |
artery. The early phase usually evades detec- |
segmental coarse changes in the parenchymal |
Portal Venous Gas
Gas Embolism


Necrotizing intra-abdominal disease (e. g., acute mesenteric ischemia, pancreatitis), diseases with a breakdown in the barrier between the intestinal lumen and the portal venous system (e. g., penetrating gastrointestinal ulcer, diverticulitis, ileus), and septic conditions with gas-producing pathogens from the portal catchment areas (e. g., toxic colon, necrotizing enterocolitis) may sweep gas bubbles into the liver via the portal vein. In ultrasonography, these bubbles appear as coarse turbulent echoes within the portal vein; in the hepatic parenchyma they are deposited first in the periportal regions and present there as coarse echoes (Fig. 2.40). Eventually, these coarse echoes spread across the entire parenchyma, and within just a few hours portal venous gas embolism can develop into life-threatening acidosis (Kussmaul respiration) and fatal hepatic failure.
texture, with an irregular arrangement of echoes of varying coarse graininess and brightness.
Fig. 2.40 Portal venous gas embolism. Small particles (gas bubbles) are detectable within the portal branches. Initial periportal deposits of gas bubbles (abundant gas leads to hyperechoic echoes within the whole liver).
2
Diffuse Changes in Hepatic Parenchyma
81

2
Liver
Diffuse Inhomogeneous Texture
Liver

Diffuse Changes in Hepatic
Parenchyma
Enlarged Liver
Small Liver
Homogeneous Hypoechoic Texture
Homogeneous Hyperechoic Texture
Regionally Inhomogeneous
Texture
Diffuse Inhomogeneous Texture
Localized Changes in Hepatic
Parenchyma
Differential Diagnosis of Focal Lesions
Chronic Hepatitis
Cirrhosis
Disseminated Tumor Growth
Diffuse Tumor Growth
Chronic Hepatitis 


During the course of hepatitis there will be periportal and parenchymal inflammation, accompanied by edema and necrosis. As a result size, density, brightness, and distribution of the individual echoes within all of the hepatic parenchyma will exhibit coarse inhomogeneity of varying degree. The surface becomes increasingly irregular and displays fibrotic dimpling, which also will be found along the hepatic veins where it leads to irregular margins (“nibbling away”). Eventually the veins will become tortuous and increasingly rarefied in the periphery. The branches of the portal veins present with multiple periportal echoes, while
the consistency of the liver becomes increasingly firm and in the end hard (Fig. 2.41). The extent of the sonographic changes depends not so much on the possible etiology of chronic hepatitis but rather on its duration and severity. Any pathologically enlarged lymph nodes at the porta hepatis will correlate with the severity and activity of chronic hepatitis caused by autoimmune or chronic viral infections. There is a fluid transition between the sonographic findings of chronic hepatitis and cirrhosis of the liver.
Fig. 2.41 Chronic hepatitis. Irregular surface, inhomogeneous parenchyma, irregular corkscrew-like hepatic vein with so-called “nibbling away.” Other criteria: firmer consistency.
Cirrhosis


In a liver with cirrhotic changes, the diffuse irregular parenchymal echotexture by itself is a rather poor criterion for the presence or absence of any cirrhosis. Irregular surface, typical changes in the shape, firm/hard consistency of the organ, rarefied hepatic veins, splenomegaly, and collateralization in portal hypertension are much more reliable indicators of any cirrhotic transformation (Figs. 2.42, 2.43, 2.44, 2.45, 2.46, 2.47,  2.2 l,
  2.4f–h,
  2.7). The types of parenchymal disturbance may differ: a relatively homogeneous hyperechoic texture is more typical of fatty cirrhosis, while a parenchymal change characterized by large nodules is most probably due to autoimmune or chronic viral inflammation. The vascular architecture could also provide clues about the possible etiology: rarefied vessels are typical of autoimmune or chronic viral inflammation, whereas in toxic cirrhosis quite often the vessels can still be imaged, and in cardiac cirrhosis the hepatic veins will always be easy to visualize.
Fig. 2.42 Chronic autoimmune hepatitis. Irregular surface, inhomogeneous and coarse parenchyma. Hepatic veins already rarefied. Other criteria: firmer consistency, splenomegaly; in this case ascites.
Fig. 2.43 Cirrhosis of the liver. Irregular surface, ascites, coarse inhomogeneous parenchyma, rarefied hepatic veins. Other criteria: firmer consistency at one-finger palpation.
82

 2.7 Cirrhosis of the Liver
Surface and structure
a Cardiac cirrhosis with engorged hepatic vein visible far into the periphery; homogeneous dense parenchyma with subtly irregular surface, ascites.
d In the longitudinal view at the midline, typical beak-like/dolphin-nosed appearance, large caudate lobe.
b Atrophic posthepatitic liver cirrhosis with coarse, irregular surface, inhomogeneous surface and coarser parenchyma, rarefied liver veins, ascites. Accessory finding: gallbladder stone.
e Plug-like parenchymal hump beside the gallbladder (echogenic wall thickening) in liver cirrhosis; ascites.
c Primary biliary cirrhosis: irregular surface, inhomogeneous coarsened parenchyma, rarefied liver veins.
f Rigid inferior right lobe with coarsely irregular surface, ascites.
Parenchyma in liver cirrhosis
Liver veins and portal veins in liver cirrhosis
g Inhomogeneous coarse parenchyma, subtly irregular surface, the rarefied hepatic veins cannot be visualized.
j Parenchyma of a liver cirrhosis with rarefied hepatic veins (same scan as in k, grayscale image).
h Necrotizing liver cirrhosis with inhomogeneous coarse parenchyma, irregular surface, rarefied hepatic veins, “amputated” portal vein.
k Rarefied hepatic veins, visible in CDS.
i Differential diagnosis of irregular parenchymal echotexture; in this case, hepatocellular carcinoma (HCC) in underlying cirrhosis.
l Normal hepatic flow in the portal vein.
2
Diffuse Changes in Hepatic Parenchyma
83

2
Liver
 2.7 Cirrhosis of the Liver (Continued)
m Arterial multiperfusion with readily de- |
n Arterial multiperfusion of the left liver |
o Hepatopetal flow in the proximal portal |
tectable hepatic artery in the liver hilum. |
lobe. No detectable flow in the portal vein, |
vein with occlusion of the intrahepatic |
|
due to low pulse repetition frequency |
segment in liver cirrhosis with collateral |
|
(PRF). |
varicosity in the gallbladder fossa. |
Extrahepatic findings in liver cirrhosis
p Hepatomegaly of the left liver lobe may |
q Thickened gallbladder wall in liver cir- |
r Liver cirrhosis with portal hypertension; |
be identified by its position between the |
rhosis. |
noncompressible splenic vein and inho- |
diaphragm and the spleen; varicosity with |
|
mogeneous pancreas—concomitant reac- |
enlarged veins in the splenic hilum. |
|
tion of the pancreatic parenchyma in |
|
|
portal congestion caused by toxic origin. |
Fig. 2.46 Cirrhosis of the liver: small organ with coarse inhomogeneous parenchyma, rarefied hepatic veins, thickened gallbladder wall.
Fig. 2.44 Cirrhosis of the liver. Irregular surface, ascites, |
Fig. 2.45 Toxic liver cirrhosis, irregular surface, inhomoge- |
coarse inhomogeneous parenchyma, with regenerative |
neous and coarse parenchyma. Rarefied hepatic veins in |
nodules protruding the ventral contour; rarefied hepatic |
the beginning. Other criteria: firmer consistency. |
veins. Other criteria: firmer consistency. |
|
Fig. 2.47 Coarse nodular liver cirrhosis of posthepatic origin (HBV) with coarse regenerative nodules, rarefied hepatic veins.
84

Disseminated Tumor Growth


Metastatic infiltration of the liver by tumors |
others) can sometimes only be suspected by |
missing. The use of CEUS is indispensable in |
with isoechogenic metastasis (often stomach |
an unspecified structural “disturbance” of the |
these cases. |
cancer, pancreatic cancer, breast cancer and |
parenchyma if distinct signs of malignancy are |
|
Diffuse Tumor Growth


Diffuse infiltration of the liver by a tumor is an infrequent finding; in rare cases, it may simply lead to increased liver size and coarse hypoechoic parenchyma (e. g., in chronic lymphocytic leukemia), but more often it is seen as an irregular region within the liver (e. g., breast
cancer) (Figs. 2.48, 2.49, 2.50). The decisive diagnostic aspect is the presence of criteria for malignancy (see below). On the other hand, diffuse tumor growth is rather the rule in hepatocellular carcinoma (HCC) and cannot be clearly differentiated from the cirrhotic tis-
sue. Secondary signs of malignancy (see above) and the use of CEUS can be an option for locating tumor tissue.
2
Diffuse Changes in Hepatic Parenchyma
Fig. 2.48 Differential diagnosis of irregular parenchymal echotexture; in this case, large metastasis of a colonic carcinoma in the right liver lobe.
Fig. 2.49 Metastasis (Fig. 2.48) unmasked by a hypoenhancement in CEUS.
Fig. 2.50 Unmasked metastasis of gastric cancer in the center of the right liver lobe, not visible in native ultrasound.
Contrast-enhanced Ultrasound (CEUS)
CEUS and intravascular contrast agents (e. g., Levovist, SonoVue) make use of defined vascular phases caused by the dual blood supply of the hepatic artery and the portal vein (see Table 2.10, Fig. 2.51). In this way a vascular structure with increased
Table 2.10 Vascular phases in contrast-enhanced ultrasound (CEUS) of the liver
Phase |
Phase time |
Early arterial |
< 10 s |
Arterial |
10–15 s |
Capillary |
15–30 s |
Portal venous |
30–90 s |
Parenchymal |
> 120 s |
These vascular phase times are individual hemodynamic situations in a healthy adult person. The individual circulatory regulation will influence the time of onset of the three vascular phase times.
and decreased dispersion can be observed in every region of interest (ROI) and a different vascular density can be documented for each ROI. This allows the characterization of focal masses in the liver (see Tables 2.11 and 2.12) as well as the detection (and
characterization) of native (in B-mode) isoechogenic or nondifferentiable lesions which can be traced by their different vascular density in comparison to their surrounding tissue.
Fig 2.51 Measurement and course over time through all phases of enhancement of the aorta, hepatic artery, portal veins, and liver sinusoids. The dual vascular supply of the liver—artery earlier than portal vein—establishes the role of CEUS in the diagnostic algorithm.
85

2
Liver
Table 2.11 Enhancement patterns of benign focal liver lesions in CEUS4,5 |
|
||
Tumor entity |
Arterial phase |
PV phase |
Delayed phase |
Hemangioma |
Peripheral nodular enhancement |
Partial/complete centripetal filling |
Complete enhancement |
FNH |
Feeding artery, hyperenhancing, cen- |
hyperenhancing, central scar |
Iso/hyperenhancing, central scar |
|
trifugal filling, spoke-wheel arteries |
|
|
Regenerative nodule |
Isoenhancing, hypo/hyperenhancing |
Isoenhancing |
Isoenhancing |
Cyst |
Nonenhancing |
Nonenhancing |
Nonenhancing |
Focal fatty change |
Isoenhancing |
Isoenhancing |
Isoenhancing |
Adenoma |
Flush, hyperenhancing, nonenhancing |
Isoenhancing, hyperenhancing |
Isoenhancing |
|
areas (necrosis) |
|
|
Abscess |
Nonenhancing, no central enhancing |
Hyper/isoenhancing, rim, no central |
Hypoenhancing rim, no central en- |
|
|
enhancing |
hancing |
FNH = focal nodular hyperplasia; PV = portal venous.
Table 2.12 Enhancement patterns of malignant focal liver lesions in CEUS4,5 |
|
||
Tumor entity |
Arterial phase |
PV phase |
Delayed phase |
HCC |
Hyperenhancing, complete nonenhancing |
Iso/hypoenhancing |
(Iso-)hypoenhancing |
|
areas (necrosis) chaotic vessels, vasculated |
|
|
|
tumor thrombus |
|
|
Cholangiocarcinoma |
Rim enhancement nonenhancing |
Hypoenhancing, nonenhancing |
Hypoenhancing, nonenhancing |
Hypervascular Mets |
Hyperenhancing, complete chaotic vessels |
Hypoenhancing |
Hypoenhancing, nonenhancing |
Hypovascular Mets |
Rim enhancement |
Hypoenhancing, nonenhancing areas |
Hypoenhancing, nonenhancing |
|
|
(necrosis) |
|
Lymphomas |
|
Hypoenhancing, nonenhancing |
Hypoenhancing, nonenhancing |
HCC = hepatocellular carcinoma; Mets = metastases; PV = portal venous.
■ Localized Changes in Hepatic Parenchyma
The detection and identification of focal masses in the liver largely depends on their size, the difference in echogenicity and echotexture compared to the adjacent hepatic parenchyma, the location of the mass within the liver, the impairment of the surrounding tissue, and the diligence with which the sonographer studies the organ.
It is vital to cover all possible views (longitudinal, transverse, along the costal margin, intercostals, and those adapted to the particular findings) in order to image the liver completely. Despite all efforts, there remain some problem areas (subphrenic, surrounding the round ligament of the liver, capsular) where focal masses might be missed owing to location, technical reasons, or the finding itself (Table 2.13).
Despite this caveat, B-mode ultrasonography is the prime diagnostic modality of choice when it comes to imaging focal masses in the liver, particularly when one takes into account its easy availability and only minor discomfort for the patient.
After the mass has been detected by B-mode ultrasonography, its analysis, characterization, and assessment according to visual criteria is of vital importance (Fig. 2.52).
Sonographic criteria. The following criteria are used.
●Number. The quantity is detailed as “solitary”, as a specific number (e. g., “4”), or as “multiple”. It is useful to specify the estimated volume of the mass as a percentage of the whole liver.
●Location. For solitary masses or a small number of masses, their location is specified. The distinction is made between central masses and those that have reached the surface of the liver. If at all possible, the segment involved is noted and whether or not the margins of the segment are clear; at minimum, it must be stated whether the mass is in the left or right lobe.
●Distribution. Masses may be disseminated or focal (periportal, perivenous, at the porta hepatis, subcapsular).
●Size. For solitary masses it is quite useful to specify the size, particularly in follow-up studies. The size is defined by two orthogonal diameters and given in centimeters or millimeters; it is better to measure a mass in all three planes (longitudinal, transverse, sagittal). To compare the findings for future reference, reproducible reference structures should be included in the image. Multiple masses are characterized by descriptive terms (e. g., small nodular, large nodular).
●Shape. A mass may be round, oval, bizarre, or map-like; only the shape of solitary masses should be described.
●Margin. This term specifies how the mass is delineated against the surrounding tissue; the margin may be sharp, smooth, and easily detectable, or blurred and irregular, or even undetectable.
●Center/edge. Masses may possess a capsule, a hypoechoic ring of parenchyma (“halo”), and peripheral vasculature. Others present with an anechoic, hypoechoic, or hyper-
86
echoic center signifying central necrosis, liquefaction, or hemorrhage.
●Interrelationship with adjacent tissue.
The surface may be unchanged or it may undergo local bulging or protrusion, while other masses may produce localized indentation of their surface. Vessels may be indented, compressed, or locally displaced. Masses may grow infiltratively into vessels or infiltrate the adjacent tissue with podlike offshoots.
●Changes in the surroundings. It is not always possible to differentiate between marginal changes of a mass and reaction of the adjacent parenchyma. However, hypoechoic coarse parenchyma (usually caused by inflammation/edema) or hyperechogenicity are typical such changes.
●Echogenicity. Masses may be anechoic, hypoechoic, isoechoic, or hyperechoic compared to the surrounding parenchyma. It should be noted that this is not a definite or absolute measure and does not characterize the properties of the mass on a concrete level, but specifies them relative to the surrounding tissue without taking into account that the echogenicity of this parenchyma is by itself not a constant but may vary substantially depending on numerous factors (e. g., disease, nutrition, age).
●Texture. Assessment of the echotexture of a mass is based on its size, brightness, and echogenicity and the distribution/layout of the individual echoes within the mass.
●Architecture. The architecture of a mass takes into account structural changes caused by reaction at the margins, formation of a capsule, peduncle, etc.
●Consistency. Although often the consistency of a mass may not be amenable to direct examination, sometimes it can be assessed by one-finger palpation or by observing the resilience of the liver to vascular pulsation. The terms used are firm, tightly elastic, and soft/pliant.
●Tenderness. Rapid growth of a mass may be painful. The reason may be tension in the wall/capsule or pressure on adjacent tissue by cysts, bleeding, or abscess.
●Vascularization. Vascularization of a focal mass is assessed by color Doppler or pulsed Doppler, or by administration of contrast agent during CEUS. Doppler examinations assess the direction of flow and the type of
Fig. 2.52 Criterion: location of the mass/its relation to the |
Fig. 2.53 Metastatic liver: demonstration of small hyper- |
surface; in this case a regenerative nodule on the surface |
echoic masses transforming by growth into a target |
of the right hepatic lobe at segment V (to the gallbladder |
shape with a hypoechoic and later on an anechoic center |
fossa). Cyst in the gallbladder fossa with impression on |
and a hyperechoic rim. |
the gallbladder wall (additionally: inspissated bile, choles- |
|
terol polyp).
Table 2.13 Detection of intrahepatic masses—problems and possible solutions
Problem |
Example |
Solution |
Location |
● Anterior subphrenic |
● Examine in inspiration/expi- |
|
● At the round ligament |
ration |
|
● Posterior in the caudate lobe |
● Use sector probe |
Technical |
● Mass outside the focal range |
● Alter the focal range |
|
● Frequency-dependent resolution of the probe |
● Use high-frequency probes |
|
● Noise |
● Tissue harmonic imaging |
Finding |
● Small mass |
● Use high-frequency probe |
|
● Isoechoic mass |
● Contrast harmonic imaging |
|
|
● CEUS |
vascularization (arterial, venous, shunting), especially the range of frequencies of the arteries. The use of contrast agents in CEUS allows better detection of small isoechogenic and hidden lesions in addition to B- mode criteria.1 Using the additional assessment criteria of dynamics and density of vascularization in lesions, it is often possible to characterize these lesions and determine their pathogenesis (see below).
●Extrahepatic factors. Proper assessment of a mass has to include any changes in other organs (primary tumor? lymphadenop-
athy?) and clinical parameters (e. g., fever, night sweat).
●Change in or activity of the mass. In fol- low-up studies the sonographer can track any changes taking place spontaneously, under an antibiotic regimen, or with chemotherapy (Figs. 2.53, 2.54, 2.55). Structural changes due to age and size of focal masses, especially in fast-growing tumors, can cause completely different appearances at the time of assessment even if they arise from the same tumor (Fig. 2.56).
2
Localized Changes in Hepatic Parenchyma
87