Добавил:
Опубликованный материал нарушает ваши авторские права? Сообщите нам.
Вуз: Предмет: Файл:
Differential-Diagnosis-in-Ultrasound-Imaging.pdf
Скачиваний:
0
Добавлен:
29.07.2022
Размер:
65.91 Mб
Скачать

2 Liver

Liver 57


Diffuse Changes in

70


Hepatic Parenchyma


Enlarged Liver

70


Congested Liver


Fatty Liver


Fatty Liver Hepatitis


Fatty Cirrhosis


Diffuse Infiltration


Small Liver

76


Atrophy


Cirrhosis


Resection


Homogeneous Hypoechoic

77


Texture


Acute Liver Congestion


Amyloidosis


Acute Hepatitis


Homogeneous Hyperechoic

79


Texture


Fatty Liver


Hemochromatosis


Fibrosis


Regionally Inhomogeneous

80


Texture


Focal Fatty Infiltration


Necrosis


Portal Venous Gas Embolism


Diffuse Inhomogeneous Texture

82


Chronic Hepatitis


Cirrhosis


Disseminated Tumor Growth


Diffuse Tumor Growth


Localized Changes in

86


Hepatic Parenchyma


Anechoic Masses

88


Cysts


Polycystic Liver Disease


Hemorrhage/Hematoma


Bilioma


Abscess


Hydatid Cysts


Hereditary Hemorrhagic


Telangiectasia/Hepatic Peliosis


Lipoma


Lymphoma


Metastases


Vessels/Bile Ducts


96


Hypoechoic Masses


Metastasis


Lymphoma


Abscess


Hematoma


Complicated Cyst


Adenoma


Focal Nodular Hyperplasia


Hepatocellular Carcinoma


Lipoma


Atypical Hemangioma


Focal Fatty Change


Bile Ducts/Vessels


Isoechoic Masses

101


Focal Nodular Hyperplasia


Adenoma


Hepatocellular Carcinoma


Metastasis


Atypical Hemangioma


Hematoma


“Hepatized” Gallbladder


Bile Ducts/Vessels


Localized Changes in

Hepatic Parenchyma (Continued)


Hyperechoic Masses

107


Hemangioma


Bile Duct Hamartomas


Porphyria


Regenerative Nodules


Hepatocellular Carcinoma


Focal Nodular Hyperplasia


Metastasis


Abscess


Necrosis


Diaphragmatic Slips


Round Ligament of the Liver


Focal Fatty Change


Bile Ducts/Vessels


Echogenic Masses

114


“Comet Tails”


Calcification


Calculus


Foreign Body


Air


Irregular Masses

117


Hepatocellular Carcinoma


Thorotrastosis


Diffuse Metastasis


Alveolar Hydatid Disease


Liver Injuries in Multiple Trauma


Differential Diagnosis of Focal Lesions

119


Diagnostic Methods

119


Ultrasonography


CT


MRI


PET


Scintigraphy


Laparoscopy


Needle Biopsy


Angiography


Suspected Diagnosis

121


Hemangioma


Focal Nodular Hyperplasia


Hepatocellular Carcinoma


Metastasis


2Liver

M.W.M. Brandt

The liver is the largest gland as well as the largest single organ in the human body, weighing 1500–1800 g (accounting for about 2.3–3% of body weight). Blood, primarily from the splanchnic region, flows through the liver, where numerous substances are recovered and metabolized. Apart from breaking down and synthesizing substances, the liver is a key element in storage pathways (glycogen, fat). It either releases these metabolites directly into the bloodstream or excretes them via the bile (1500 mL/day). In addition, the liver is characterized by its organ-specific macrophages (Kupffer cells), which are an integral part of the human macrophage system (reticuloendothelial system, RES). In summary, this organ plays a vital role not only in metabolic detoxification but also in the synthesis de novo and storage of proteins, sugar molecules, and fat as well as in the secretion of digestive juices.

In order to carry out these varied functions, the anatomy of the liver is based on the socalled hepatic lobules with their functional unit, the hepatic acinus, according to Rappaport (Fig. 2.1). Splanchnic blood flowing through a branch of the portal vein passes through three successive metabolic zones where the substances transported by the blood are metabolized. All products synthesized by the liver are passed into the bloodstream through the central vein or excreted via a countercurrent mechanism into the bile ducts that parallel the terminal portal branches (Fig. 2.2).

Fig. 2.1 Hepatic lobule and acinus according to Kiernan and Rappaport. The gray hepatic lobule of Kiernan is characterized by its central vein and the peripheral portal areas; the colored hepatic acinus of Rappaport has a terminal branch of the portal vein in its center while the central veins (of the hepatic lobule) are on its periphery, and in between there are three distinct metabolic zones: zone 1 is rich and zone 3 poor in nutrients.

Fig. 2.2 Schematic diagram of a hepatic sinusoid together with a portal triad. In the sinusoids, blood from the terminal branch of the portal vein (joined in the portal triad by the artery and the bile duct) flows through the three successive metabolic zones into the central vein. Excretion into the bile ducts paralleling the branches of the portal vein is by countercurrent principle.

Topography

The liver is located in the right hypochondrium, protected by the ribs (Fig. 2.3). Its general shape is that of a pyramid, with the base pointing to the right side of the body. The average transverse diameter is 25–30 cm, the cephalocaudal length is 12–20 cm, and the normal anteroposterior diameter is 6–10 cm. The superior aspect (diaphragmatic surface) borders the diaphragm and is composed of a fixed and a mobile part; parts of the anterior aspect are in contact with the abdominal wall. The inferior surface of the liver points in a posterocaudal direction; on the left and in the middle the inferior aspect is in contact with the gastric wall, while on the lateral right side it borders the hepatic flexure of the colon. The gallbladder is attached to the inferior surface of the liver in the midclavicular line. The right dorsal aspect of the liver is anterior to the upper pole of the right kidney. The porta hepatis is situated in the middle of the inferior surface, anterior to the caudate lobe (see below) and the dorsal vena cava (Fig. 2.4); the porta hepatis contains the hepatic artery proper and its two branches, the left and right hepatic artery, the extrahepatic bile duct, lymphatic vessels, and nerves.

Fig. 2.3 Topography. Location of the liver in the right hypochondrium, protected by the lower right ribs; note the relationship with the diaphragm, right kidney, major retroperitoneal vessels, colon, and stomach.

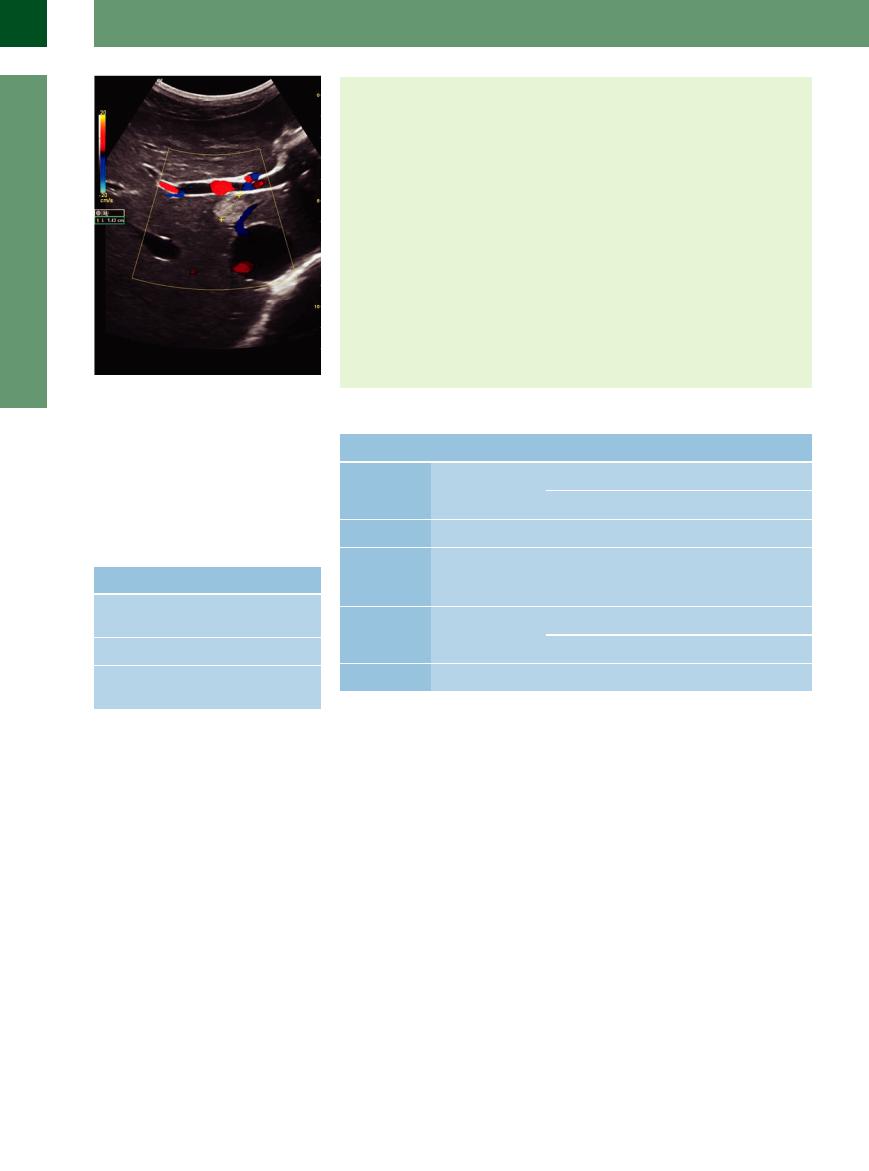
Fig. 2.4 Schematic anatomy of the porta hepatis. Aorta and vena cava are posterior; the portal vein is on the right, coursing obliquely and anteriorly to the vena cava. The portal vein is posterior to the hepatic artery and medial to the extrahepatic bile duct.

2

Liver

57

2

Liver

Table 2.1 Hepatic segments


Segment

Location

Topography, boundary

Name

Tributary

I

Left medial, posterior,

Anterior to vena cava, posterior to segment IVa

Caudate lobe

Left portal vein branch


anterior to vena cava


II

Left lateral, superior,

Superior to segment I , medial to segment IVa,

Superior part is anatomic

Left portal vein branch


subcardial

forms superior left medial margin

left lobe


III

Left lateral, inferior

Inferior to segment II, medial to segment IVb,

Inferior part is anatomic

Left portal vein branch III


forms inferior left medial margin

left lobe


IV

Left medial, anterior

Right lateral to round ligament and lateral to

Quadrate lobe

Left portal vein branch IV


segment II/III, medial to segment V


V

Right medial, inferior

Medial to segment VI/VII, superior to

Forms gallbladder fossa

Right portal vein branch


gallbladder


VI

Right lateral, inferior

Inferior to segment VII, lateral to segment V,


Right portal vein branch


forms right lateral margin


VII

Right lateral, superior,

Superior to segment VI, lateral to segment VIII,


Right portal vein branch


subphrenic

subphrenic, forms right lateral superior margin


VIII

Right medial superior,

Superior to segment V, medial to segment VII,


Right portal vein branch


subphrenic

subphrenic


Anatomy

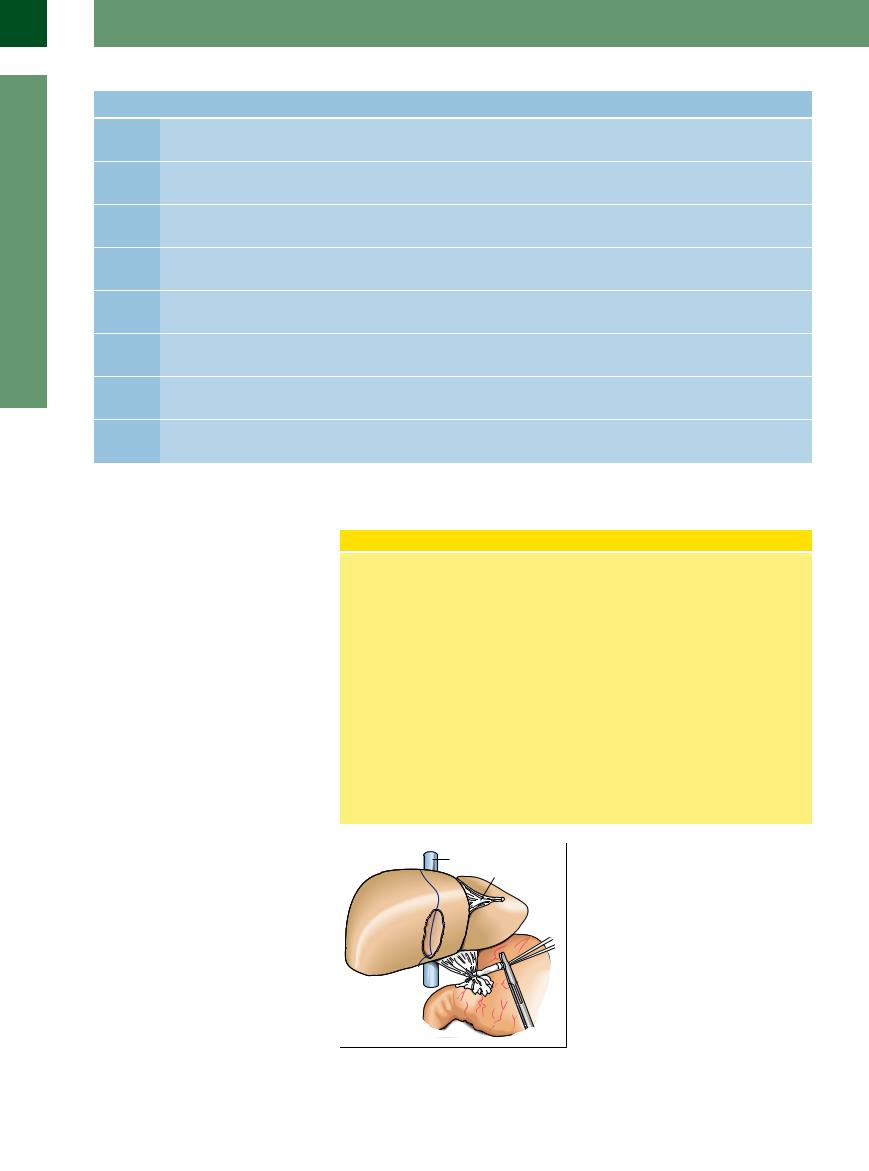
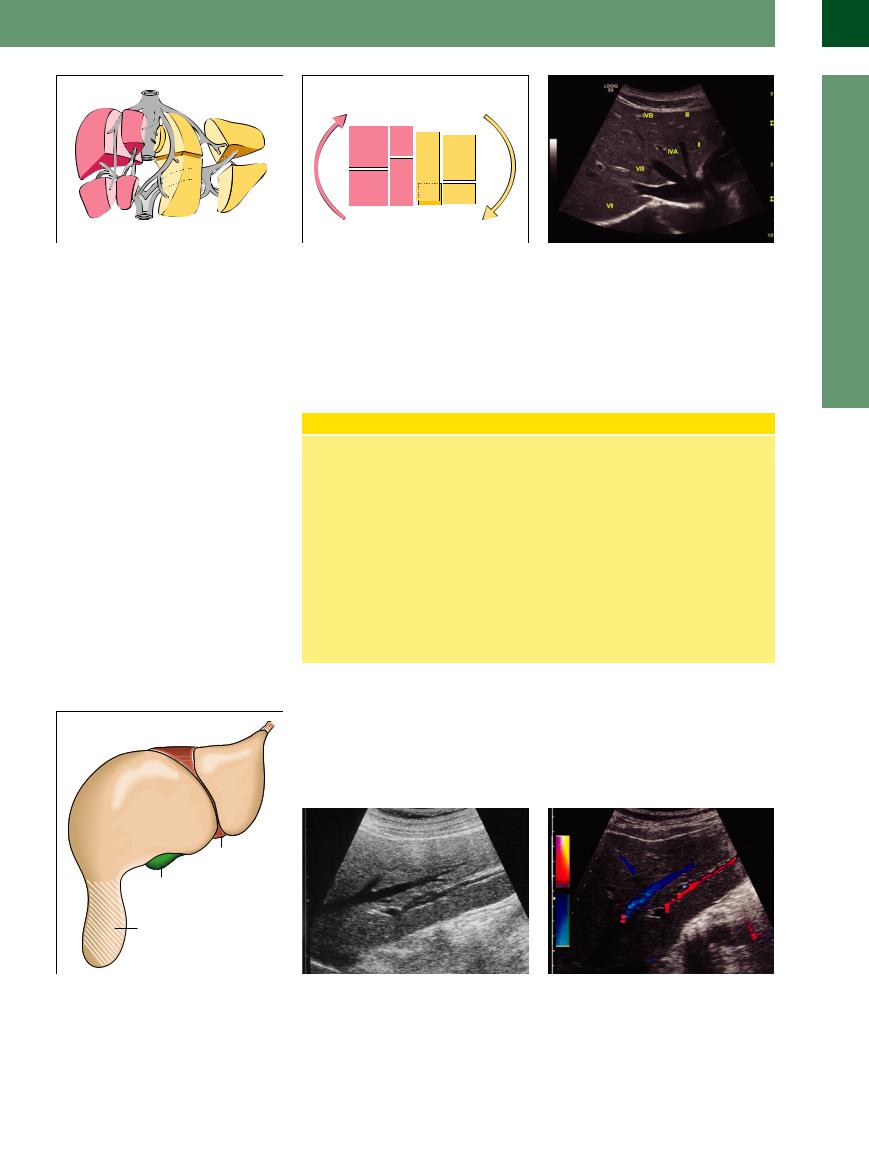
From a macroscopic anatomical point of view, the liver is subdivided into a larger right lobe (representing the base of the pyramid) and a smaller left hepatic lobe (the apex of the pyramid), with the falciform ligament (containing the round ligament or ligamentum teres) dividing the two lobes (Fig. 2.5). In terms of its microanatomy, the liver is made up of eight functionally separate segments that follow the vascular tree (Fig. 2.6; Table 2.1). If circumscribed masses or pathological findings can be correlated to a specific segment, this is extremely helpful in preoperative and intraoperative diagnosis as well as for possible resectability or any planned interventional angiographic procedures. However, since anatomical variants are numerous and not particularly infrequent, segmental correlation is not always certain and thus may be of only limited value in some cases.

Couinaud Segmental Anatomy of the Liver

The microanatomy of the liver consists of eight functionally different segments. When viewed from the front/below they are counted clockwise: the left hepatic lobe made up of segments I–IV and the right lobe of segments V–VIII. Compared to the anatomical division of the liver along the falciform ligament (including the ligamentum teres) into a smaller left lobe (only segments II and III) and a larger right lobe (segments V–VIII plus segments I and IVa/ b), Couinaud segmental anatomy follows the vascular tree (Fig. 2.6, Fig. 2.7). Here the ramifications and branches of the portal vein (accompanied by the branches of the hepatic artery and the bile ducts = portal triad) are the central structures of each segment, while the hepatic veins run-

ning between the segments drain the blood (Fig. 2.8). There are three major hepatic veins—right (lateral right), middle, and left (medial)—all joining the vena cava posteriorly at the bare area of the superior aspect of the liver below the diaphragm. The middle hepatic vein divides the angiographic right hepatic lobe from the left lobe. The left hepatic vein drains between double segments II/III as well as IVa/IVb of the left lobe. The right hepatic vein drains between double segments VI/VII and V/ VIII. Segment I is the caudate lobe and is part of the left hepatic lobe draining the blood directly in to the vena cava. Segment IV corresponds to the quadrate lobe, while segment V forms the base of the gallbladder fossa.

Fig. 2.5 Liver anatomy. Inferior view: the round ligament (falciform) separates the anatomical left hepatic lobe (LL) from the lateral anatomical right lobe, which is larger and is shown with the gallbladder fossa on its inferior aspect. The vena cava can be seen posteriorly. The dotted line marks the imaginary plane running through the gallbladder fossa and vena cava, which is considered the dividing line between the vascular tree of the left and right branches of the portal vein.

58

2

Liver

Fig. 2.6 Segmental hepatic anatomy according to Couinaud. Schematic diagram of the hepatic segments I (caudate lobe) to IV (quadrate lobe, with subsegments cranial IVa and caudal IVb) of the left lobe as well as segments V–VIII of the right lobe; the gallbladder fossa is posteroinferior to segment V and lateral to segment IVb.

Fig. 2.7 The liver segments are counted clockwise: the segments of the left lobe are shown in yellow, the segments V–VIII of the right lobe red (segment I behind/ posterior to segment IVb).

Fig. 2.8 Star-like junction of the hepatic veins (= LV), with the right, middle, and left LV. These large veins run between the double segments II/III—(medial LV)—I/IV—- middle LV—VIII/V—(right lateral LV)—VII/VI.

SonographicMorphology

Ultrasonography of the liver has to assess numerous criteria. Only by putting together these pieces of the puzzle will the sonographer come up with a well-founded diagnosis. The following sections will consider extrinsic, intrinsic, and dynamic criteria, including adjacent findings. Routine study of the sonographic characteristics of the liver is performed with the patient in the supine position (sometimes supplemented by the left lateral decubitus position or with the patient standing). The organ is imaged in the longitudinal and transverse planes and along the lower right costal margin of the ribs, as well as in planes parallel to the intercostal spaces, by sweeping the probe in a fanlike fashion during inspiration, expiration, and breathholding. The examination is completed by specific localized palpation with the probe, if needed.

Normal Variants in Liver Anatomy

Normal variants may impact on the position and shape of the liver and/or its microanatomy (hepatic segmental anatomy) and vascular supply.

One normal variant of position is situs inversus.

Accessory hepatic lobes (the so-called Riedel lobe) (Figs. 2.9, 2.10, 2.11) are most often found around segment VI, less often around segments IV or V. They appear as large fingerlike projections, and are normal variants in segmentation and shape. They differ from malignant masses in their regular parenchymal architecture with its smooth surface and a normal vascular sup-

ply, i. e., a central branch of the portal vein paralleled by a branch of the hepatic artery, a bile duct, and a single accessory central vein which drains the blood separately from the portal branch.

The most common normal variants in the vascular supply are found in the hepatic artery (right hepatic artery originating from the superior mesenteric artery) and the hepatic veins (additional hepatic veins or accessory hepatic veins not terminating at the common venous junction but directly at the vena cava) (Fig. 2.12).

Fig. 2.9 Schematic anatomy of Riedel lobe. Accessory hepatic lobes are normal variants and may appear at various locations of the liver. The most common form is the so-called Riedel lobe, corresponding to a long projection of the right hepatic lobe around segment VI and possessing a regular architectural structure.

Fig. 2.10 Riedel lobe. Lateral longitudinal view: image of

Fig. 2.11 Color-flow duplex scan.

Riedel lobe with absolutely normal structural architecture


of hepatic veins and portal areas, normal parenchyma.


59

2

Liver

Fig. 2.12 The caudate lobe often has an own runoff into the caval vein; this may be the explanation for the hypertrophy in Budd–Chiari syndrome and veno-occlusive disease. Accessory finding: small hemangioma segment I (cursors).

Table 2.2 Assessment of liver size (longitudinal view in right midclavicular line)

Build of patient

Normal values

Slim, long-limbed

< 15 cm

(asthenic)


Normal

< 12 cm

Stocky, short-limbed

< 10 cm

(pyknic)


Extrinsic Criteria

Size—depends on the patient’s build (Table 2.2)

Thick-set: 80 mm

Regular build: 120 mm

Asthenic: 150 mm

Caudate lobe: ca. 50 × 20 mm

Left hepatic lobe < right lobe

Shape

Left hepatic lobe (viewed anteriorly to the aorta): convex/concave

Right hepatic lobe (viewed laterally right): biconvex

Surface

Smooth

Contour

Sharply angled configuration, 30 ° (asthenic)

<45 ° (pyknic)

Anomalies

Situs inversus

Accessory lobe

Table 2.3 Extrinsic criteria


Criterion

Normal

Pathological

Example

Size

12 cm in right MCL

Bigger

Fatty cirrhosis


Smaller

Atrophic cirrhosis

Shape

Convex/concave

Biconvex, rounded

Fatty liver, infiltration

Surface

Smooth

Irregular, localized

Chronic hepatitis, focal


bulging, pitting

mass, metastasis;


status post hepatitis

Contour

Angulated

Blunt, rounded

Fatty liver


Beak-like

Cirrhosis

Normal variants

Riedel lobe

MCL = midclavicular line.


Extrinsic criteria ( 2.1; Table 2.3). The size of the liver, its superior and inferior aspect, its shape, its caudal edge, and any normal variants are assessed on the basis of the following extrinsic criteria.

The size of the liver is determined along the midclavicular line and is given in centimeters; to a large extent this parameter depends on the build of the patient (Table 2.2). In addition, the dimensions of the caudate lobe and the distribution of mass between left and right hepatic lobe have to be assessed.

Usually the surface of the liver is smooth; during routine studies its appearance is better visualized at the inferior aspect of the liver since, because of the physics of the ultrasound beam, the image is blurred in the near field. Another alternative is to switch to a higherfrequency probe to assess the ventral surface.

The shape takes into account the distribution of mass between the right lobe and the left as well as the caudate lobe; in addition, the inferior aspect of the organ is assessed in lon-

gitudinal views, with the left lobe being imaged in the midline anterior to the aorta (the anterior aspect is convex and the posterior one concave), while the right hepatic lobe is scanned in the right axillary line (biconcave).

The inferior contour of the liver is examined, too; for the left lobe it is sharply angulated at 30–45 °, while the lateral edge of the right hepatic lobe is blunt (60 °).

Normal variants are uncommon and, apart from a variant position (situs inversus), the sonographer has to keep accessory lobes in mind (so-called Riedel lobe) (Fig. 2.10,

Fig. 2.11).

Intrinsic criteria (Table 2.4). The intrinsic criteria deal with the actual parenchymal echotexture of the liver, organ-induced attenuation of the ultrasound beam, and in particular the demonstration of and changes in the venous vessels and portal triads with portal vein, bile duct, branches of the hepatic artery, and the lymphatics.

The echotexture of the hepatic parenchyma ( 2.2) is made up of numerous individual echoes. Assessment of these individual echoes has to consider size (graininess), brightness, and uniformity (homogeneity) as well as distribution and position (density). The parenchyma of a normal liver will present as finely dispersed, moderately bright, homogeneously and uniformly distributed individual echoes of moderate echogenicity. With normal presettings of the equipment, no relative amplification or attenuation will be seen: both criteria are highly dependent on the type of equipment used and the presets (time gain compensation, TGC).

The hepatic veins ( 2.3 and 2.4) converge on the so-called venous star (Fig. 2.8, Fig. 2.13), which terminates at the vena cava; they drain the blood from the periphery of the liver, run in straight lines between the segments with sharply angled branching, are smoothly lined, and do not demonstrate any wall echoes. The blood flow within the hepatic

60

2.1 Extrinsic Criteria

Surface, angle, and consistency

a In the median line the liver is convex/

b Misinterpretations may be due to defor-

c On the lateral aspect the liver is bicon-

concave and sharply angled.

mation of the surface with indentation of

vex or convex/concave and obtusely


the anterior surface by the pressure of the

angled.


probe pushing down on the abdominal


wall.


Changes in the hepatic surface

d Usually, the surface of the liver is smooth (most often best assessed at the inferior aspect).

g Localized changes in the surface due to scarring after bypass surgery with subsegmentation in the left lobe.

j Circumscribed changes in the surfaces bulging into the gallbladder wall due to a hemangioma.

e Inflammatory disorders will result in diffuse changes in the entire surface of the liver with an irregular wavy contour, here in chronic autoimmune hepatitis.

h Scar at the inferior aspect of segment VI after partial liver resection, filled with fluid; ascites? bile?

k Gastric cancer metastasis infiltrating and penetrating into the diaphragm with concomitant pleural effusion.

f Irregular nodular hepatic surface in cirrhosis; imaging is facilitated by the presence of ascites.

i Intrahepatic masses can bulge the surface of the liver and indent adjacent organs: here, a unilocular cyst at the inferior aspect of segment III indenting the gallbladder wall.

l Cancerous impression at the inferior aspect of segment VI of the right hepatic lobe with central pit and bulging wall.

2

Liver

61

2

Liver

veins may be assessed qualitatively and quantitatively by duplex and color-flow duplex scanning.

The portal vein (2.5) enters the liver at the termination of the hepatoduodenal ligament, bifurcates at the porta hepatis (Fig. 2.14) into the left and right branch, and supplies the center of the individual hepatic segments via its respective segmental branches. The portal vein branches are characterized by echoes in the wall (periportal reinforcement), and the blood flow in the portal vein and its branches may be assessed and quantified by duplex and colorflow duplex scanning. The portal veins are regularly paralleled by branches of the hepatic artery and bile ducts; these three vessels form the so-called hepatic triads. Blood flow in the various segments of the hepatic artery may also be assessed and quantified by duplex and color-flow duplex scanning. The intrahepatic lymphatics are too small to be assessed with today’s equipment, and all extrahepatic lymph nodes at the porta hepatis visualized by ultrasound are pathological.

Fig. 2.13 View parallel to costal margin: regular hepatic parenchyma with the star-like junction of the hepatic veins.

Fig. 2.14 Portal veins. View parallel to right costal margin: regular hepatic parenchyma with portal vein bifurcating into the left and right branches.

Intrinsic Criteria

Parenchymal echotexture

Homogeneous, finely dispersed, me- dium-sized, moderately bright, individual echoes

Conduction

Normal

Hepatic veins

Drain between segments

Common junction at the vena cava (“venous star”)

Run straight, with angulated branching

No wall echoes

Typical signal on duplex scanning

Portal vein branches

Originate at the hepatoduodenal ligament (bifurcation of the portal vein) and course in the center of the segments

Periportal encasement

Sufficient duplex signal for analysis

Hepatic artery

Parallel the branches of the portal vein

Bile ducts

Parallel the branches of the portal vein

Lymphatics

Parallel the branches of the portal vein

At this time without clinical significance

Pathological lymphadenopathy at the porta hepatis

Table 2.4 Intrinsic criteria


Criterion

Normal

Pathological

Example

Parenchyma

Homogeneous, finely

More echogenic

Fatty liver


dispersed

Less echogenic

Acute congestion


Inhomogeneous

Hepatitis, cirrhosis

Conduction

Normal

Attenuated

Fibrosis


Enhanced

Edema

Hepatic veins

Straight, acute-angled

Rounded, more obtusely angled branching

Fatty liver


branching

Di use delineation

Fatty liver


Sharply delineated,


no wall echoes

Irregular contour

Chronic hepatitis


Unobstructed lumen


Rarefied

Cirrhosis


Occluded

Veno-occlusive disease, Budd–Chiari


syndrome


Enlarged

Congested liver

Portal veins

Sharply delineated,

Scabby

Cirrhosis


wall echoes

Sudden alteration in caliber

Cirrhosis + portal hypertension


62

Lymph Nodes

A healthy liver produces about 1500 mL of lymph in 24 hours. Hepatic lymph vessels drain mainly along the branches of the hepatic arteries and lead to the cisterna chyli. A second set of lymph vessels runs along the branches of the hepatic veins and flows into the thoracic duct. A third system parallels the biliary plexus. Intrahepatic lymphatic vessels cannot yet be detected by sonography. Regular-sized lymph nodes of the porta hepatis are normally not visible either. In pathological conditions lymph nodes which are pathologically enlarged (> 17 mm) can be seen along the hepatic

artery in front of the portal vein, lateral to the bile ducts and the portal vein, as well as behind the portal vein next to the vena cava. These hepatic lymph nodes are detectable especially in infectious diseases (HIV, hepatitis A and B) and in autoimmune diseases (autoimmune hepatitis, primary biliary cirrhosis, and primary sclerosing cholangitis) of the liver and are an important diagnostic marker: it has been shown that their size (lymph node volume) correlates with the inflammatory activity of the disease.

Table 2.5 Dynamic criteria


Criterion

Normal

Pathological

Respiratory motion

2–3 fingerbreadths or

Missing


4–6 cm (ca. 2 inches)


Consistency

Soft

Increased, hardened

Tenderness

None

Tender on palpation

Table 2.6 Sonographic criteria for assessing the liver

Dynamic Criteria

Respiratory motion

During inspiration 2–3 fingerbreadths or 4–6 cm (~2 inches) caudad

Consistency

Squeezable like a wet sponge

Returns to its original shape once the pressure is released

Tenderness

None

Example

Abscess, adhesions

Infiltrative changes, cirrhosis

Capsular tension

Extrinsic criteria

Intrinsic criteria

Dynamic criteria

Supplementary criteria

Size

Parenchymal structure

Respiratory motion

Changes in neighboring organs

Shape

Conductivity of sound

Consistency, malleability

and vessels

Surface

Hepatic veins

Tenderness

Free fluid

Inferior margin

Hepatic arteries


Angle

Portal veins


Normal variants

(Bile ducts)


(Lymphatics)


Dynamic criteria (Table 2.5). The dynamic criteria take into account the respiratory motion of the liver, its consistency, and its (possible) tenderness on palpation.

During inspiration the liver moves caudad by 2–3 fingerbreadths or 4–6 cm (ca. 2 inches). The liver has a soft consistency and the palpating finger (e. g., of the left lobe anterior to the aorta/spine) can squeeze it like a wet sponge; when the pressure is removed it will return to

its original shape. The consistency of the liver can also be assessed around the superior aspect of the left lobe where the diaphragm passes on the pulsations of the adjacent heart. Normally the liver should be free of pain and palpation should not elicit any tenderness.

Supplementary findings. Any pathological findings in other organs and structures of the abdomen must also be noted, for instance in

the gallbladder (wall thickening, visible blood vessels within the wall), spleen (splenomegaly), pancreas (cysts, pancreatitis), and portal vessels (varicosities, collaterals), as well as any free intra-abdominal fluid (amount, type) (Table 2.5).

Table 2.6 is a summary of the criteria used in sonographic assessment of the liver.

2

Liver

63

2

Liver

Venous Flow Pattern

There is a distinct difference between the flow patterns in the hepatic and the portal veins (Fig. 2.15).

Hepatic veins. Here, blood flow is characterized by a physiological triple-peak/tripha- sic curve resembling the pulse curve in the jugular vein; it mirrors the pressure situation in the right heart.

Phase I: first part of the blood flow is toward the heart; at the latter, it corresponds to the mechanical displacement of the valve plane (systolic phase)

Phase II: second part of the blood flow is toward the heart; at the latter, it corresponds to the opening of the atrioventricular valve (diastolic phase)

Phase III: regurgitation (back flow) is from the right atrium; it results from the contraction of the right atrium and the bulging of the tricuspid valve

Measurements are taken at all three major hepatic veins. The flow pathology concerns the make-up of various phases (increased regurgitation in right ventricular failure, vena cava engorgement, tricuspid insufficiency) or the number of phases (biphasic pattern or monophasic pattern in cirrhosis of the liver). A ribbon-like flow profile, solely back flow, or no flow at all are found in Budd–Chiari syndrome or veno-occlusive disease (VOD).

Arterial Flow Patterns in the Proper Hepatic Arteries and Its Branches

The arterial blood flow accounts for 20% of the entire blood flow of the liver in a healthy fasting individual. The remaining 80% flows through the portal vein.

This ratio can be changed by physiological influences (postprandial fall of the arterial flow) as well as pathological influences (e. g., increased arterial flow in portal hypertension, cirrhosis, tumor infiltration, missing decrease of postprandial arterial flow in patients with cirrhosis).

The blood flow in the hepatic artery proper resembles the curve of a parenchymal arterial vessel with a low peripheral resistance

(RI< 0.75); The peak flow rate (Vmax) is 40 cm/s. A lower RI followed by an increase in velocity can be seen in an intrahepatic arteriovenous fistula or shunt, e. g., in hereditary hemorrhagic telangiectasia (Osler’s disease of the liver).

A high RI can indicate a disruption of arterial circulation downstream as seen especially in graft rejection; after transplantation the hepatic artery must therefore be monitored closely, using Doppler sonography.

The arterial vascularization of the liver can be determined in the hepatic artery proper

Fig. 2.15 Portal veins and liver veins can be differentiated by their flow direction. The liver veins drain the blood to the caval vein, away from the transducer (blue-coded): the portal vein drains the blood from the liver hilum into the liver and toward the transducer (red coded).

Portal veins. These exhibit a ribbon-like flow profile with arterial modulation by the pulsations of adjacent arteries or propagated through the liver; there is

Physiological hepatopetal flow (anterograde into the liver)

Pathological hepatofugal flow (retrograde out of the liver)

No flow or oscillating flow

and

Thrombosis of the portal vein. A localized one-sided reversal of the flow can be seen regularly in functioning contralateral shunts (TIPSS). Measurements of the flow direction and the flow velocity are taken at the trunk of the portal vein as well as its left and right branches

in the porta hepatis or in its left and right intrahepatic branches. Additional criteria to assess the liver are supplied by contrastenhanced ultrasound (CEUS). Depending on which contrast agent is used, more criteria can be provided for further differentiation and assessment. Intravasal contrast agents are routinely in use (also see box CEUS, p. 85). A further differentiation is expected from target-specific contrast agents for ultrasound.

64

2.2 Assessing the Hepatic Parenchyma

Normal parenchyma

a–c Compared with the kidney, the regular parenchyma of the liver is slightly more echogenic, finely grained, and homogeneous; in normal sonography there is no ultrasound attenuation.

a Other organs used for comparison are

b Simple fatty degeneration, easily recog-

c Comparison of hepatic parenchyma

the spleen, pancreas, and psoas muscle.

nized by the increased echogenicity when

with other structures: anechoic (cystic,


compared with the (healthy) kidney.

transverse view of gallbladder) and hy-


perechoic mass (small angiolipoma in the


cortical parenchyma of the kidney).

Parenchymal changes in fatty degradation

d Characteristic increased echogenicity.

e The surface becomes rounded (fatty cir-

f Fatty liver hepatitis caused by diabetes,

Despite the excellent conduction of sound

rhosis of the liver); other causes lead to an

alcoholism, or nonalcoholic steatohepati-

in fat, there is definite attenuation in the

inhomogeneous parenchyma due to ir-

tis.

parenchyma because of the increased

regular fat deposits and inflammatory re-


number of boundaries, diffraction, and

action.


dispersion of the sonic beam, and runtime


artifacts.


Regional or segmental fatty degradation

g Fatty degradation may lead to regional,

h Map-like circumscribed pseudotumorous

i Splotchy changes induced by fatty deg-

segmental, or focal differences in the pa-

parenchymal changes in fatty degrada-

radation of the parenchyma.

renchymal changes. As in this case, quite

tion.


often focal differences in parenchymal


changes are found around the veins (like


here), below the capsule as well as in


segment V and VI.


Inflammatory parenchymal changes and cirrhosis of the liver

2

Liver

j–l Acute inflammation does not present with any changes; because of the transformation and the infiltration of the inflammatory cells, only chronic inflammation with its inhomogeneous and coarsened parenchymal structures will be visualized. However, these are nonspecific signs which are completed by other criteria like changes in the surface, ascites, splenomegaly.

Examples: j Autoimmune hepatitis, ascites.

k Chronic toxic fatty liver hepatitis/cirrhosis.

l Posthepatitic cirrhosis with coarse nodules.

65

2

Liver

2.2 Assessing the Hepatic Parenchyma (Continued)

Noninflammatory diffuse parenchymal changes—borderline cases

mo Diffuse coarse inhomogeneities of the hepatic parenchyma are also seen in numerous other diseases and can only be recognized when many other criteria are looked at as well.

n Cholangiofibromatosis = von Meyenburg complexes.

o Portovenous gas embolism with small gas bubbles deposited in the periportal hepatic parenchyma.

Example: m Fibrosis of the liver with unilocular cysts and von Meyenburg complexes in Caroli disease.

2.3 Hepatic Veins

Normal liver veins

a–c The major hepatic veins run in a straight or slightly curved line, and their margins are smooth without any wall echoes. The right lateral hepatic vein (a) and the middle (b) liver vein drain the blood between the segments and run into the star-like junction into the caval vein. Wall echoes are found at the portal vessels (transverse view) and wherever the sound waves strike the hepatic veins at a right angle (large drop in impedance).

a and b Transverse scan. Demonstration of a so-called mirror artifact. c Middle/left hepatic vein.

d Star-like junction with straight line; the hepatic veins drain the blood between the segments of the liver.

e The hepatic veins branch at sharp angles f Hepatofugal flow within the liver veins. into the main veins.

66

2.3 Hepatic Veins (Continued)

Normal variants

2

Liver

g–i Aberrant liver veins run outside of the star-like junction directly into the caval vein (g and h). They are harmless variants and are only important with regard to surgical procedures.

i Normally, the caudad lobe drains directly into the caval vein. This favors the compensatory hypertrophy in the case of Budd–Chiari disease or veno-occlusive disease.

Flow parameters of the liver veins

j Regular triphasic duplex signal of a normal middle hepatic vein.

m and n Color Doppler sonography (CDS) with the duplex signal demonstrates a chronic liver congestion: at different times CDS shows a different flow direction.

m Hepatopetal flow reversal.

Distribution of the liver veins

p Normally, the liver veins branch at acute angles.

k Abnormal monophasic duplex signal of a hepatic vein in cirrhosis of the liver.

n Hepatofugal flow toward the heart.

q Chronic congestive liver; there is also hepatosteatosis. The contour of the veins becomes blurred and irregular in hepatosteatosis and inflammation.

l Systolic–diastolic pendular flow within a liver vein in a case of tricuspid valve insufficiency and liver congestion.

o The phasic course in duplex sonography explains the hepatofugal and hepatopetal flow in CDS at different times in the same hepatic vein. Normally, the reflux phase is very short but it can be prolonged and better documented in the case of lower vein distension.

r Increased volume of the hepatic parenchyma (e. g., in fatty liver) results in more obtuse angle branching (chronic liver congestion).

67

2

Liver

2.4 Pathologic Liver Findings

Chronic liver congestion leads to a rigid, engorged hepatic vein

Inflammatory changes leading to the appearance of contour irregularities of the hepatic veins

In malignancies, vascular disturbances may be influenced in different ways: perivascular infiltration, impression, displacement, and vascular infiltration

a Rigid engorged hepatic vein.

d Pitting and scarred indentations in inflammatory disease.

g Rarefied hepatic vein, sonographic imaging not possible because of the parenchymal changes.

j Lymphoma infiltration and covering of the portal branch, dislocation of the hepatic vein.

b In vena cava congestion, the hepatic vein becomes visible well into the (subcapsular) periphery of the liver.

e Kinking and corkscrew veins.

h Only color-flow duplex scanning of the same area delineates the hepatic vein by its disturbed flow.

k Breast cancer metastasis indenting the hepatic vein.

c Vena cava congestion with enlarged junction of the hepatic veins and right pleural effusion.

f Scarred irregular contour of the vascular wall with obstruction of the lumen resulting in local flow disturbances visualized in color-flow duplex scanning as aliasing.

Progress of the destructive inflammatory changes leading to the appearance of the so-called “rarefied hepatic vein”: typical finding in cirrhosis.

i Differential diagnosis: hepatic vein with fibrous occlusion in veno-occlusive disease.

l Impression of the hepatic vein wall and dislocation of the vein in a liver cell adenoma.

68

2.4 Pathologic Liver Findings (Continued)

Tumor infiltration into the liver vein

m Diffuse metastasis of gastric cancer in-

n Hepatocellular carcinoma (HCC) with

o CDS demonstrates partial tumor infil-

filtrating the wall of the hepatic vein.

typical infiltration of the hepatic vein. Tu-

tration of the hepatic vein by the local


mor infiltration of the hepatic vein.

flow increase and detection of an aliasing


phenomenon.

2.5 Portal Veins

Bifurcation

a–c Bifurcation of the portal vein.

b With the branches for segments I–IV of

c With the branches for segments V–VIII

a Left (LI) and right (RE) branches of the

the left hepatic lobe.

of the right hepatic lobe. RE = liver seg-

portal vein. Liver segments 1, 2, 3, 4.


ments; 5, 6, 7, 8 = right.

Portal vein and cirrhosis

2

Liver

d–f Morphologically in liver cirrhosis there is wall thickening with a curved course, a dilated portal vein and apparently “amputated” lateral and terminal branches.

e and f “Amputated” lateral and terminal branches.

f Color-flow duplex scan of the portal vein in cirrhosis.

Color Doppler sonography of the portal vein in liver cirrhosis

g–i Hepatopetal and hepatofugal flow. g Hepatopetal flow.

h CDS with demonstration of the duplex signals and measurement of the peak velocity.

i Hepatofugal flow with arterial compensation (red).

69

Соседние файлы в предмете [НЕСОРТИРОВАННОЕ]