

- •Contents
- •Preface
- •Contributors
- •1 Vessels
- •1.1 Aorta, Vena Cava, and Peripheral Vessels
- •Aorta, Arteries
- •Anomalies and Variant Positions
- •Dilatation
- •Stenosis
- •Wall Thickening
- •Intraluminal Mass
- •Perivascular Mass
- •Vena Cava, Veins
- •Anomalies
- •Dilatation
- •Intraluminal Mass
- •Compression, Infiltration
- •1.2 Portal Vein and Its Tributaries
- •Enlarged Lumen Diameter
- •Portal Hypertension
- •Intraluminal Mass
- •Thrombosis
- •Tumor
- •2 Liver
- •Enlarged Liver
- •Small Liver
- •Homogeneous Hypoechoic Texture
- •Homogeneous Hyperechoic Texture
- •Regionally Inhomogeneous Texture
- •Diffuse Inhomogeneous Texture
- •Anechoic Masses
- •Hypoechoic Masses
- •Isoechoic Masses
- •Hyperechoic Masses
- •Echogenic Masses
- •Irregular Masses
- •Differential Diagnosis of Focal Lesions
- •Diagnostic Methods
- •Suspected Diagnosis
- •3 Biliary Tree and Gallbladder
- •3.1 Biliary Tree
- •Thickening of the Bile Duct Wall
- •Localized and Diffuse
- •Bile Duct Rarefaction
- •Localized and Diffuse
- •Bile Duct Dilatation and Intraductal Pressure
- •Intrahepatic
- •Hilar and Prepancreatic
- •Intrapancreatic
- •Papillary
- •Abnormal Intraluminal Bile Duct Findings
- •Foreign Body
- •The Seven Most Important Questions
- •3.2 Gallbladder
- •Changes in Size
- •Large Gallbladder
- •Small/Missing Gallbladder
- •Wall Changes
- •General Hypoechogenicity
- •General Hyperechogenicity
- •General Tumor
- •Focal Tumor
- •Intraluminal Changes
- •Hyperechoic
- •Hypoechoic
- •Nonvisualized Gallbladder
- •Missing Gallbladder
- •Obscured Gallbladder
- •4 Pancreas
- •Diffuse Pancreatic Change
- •Large Pancreas
- •Small Pancreas
- •Hypoechoic Texture
- •Hyperechoic Texture
- •Focal Changes
- •Anechoic Lesion
- •Hypoechoic Lesion
- •Isoechoic Lesion
- •Hyperechoic Lesion
- •Irregular (Complex Structured) Lesion
- •Dilatation of the Pancreatic Duct
- •Marginal/Mild Dilatation
- •Marked Dilatation
- •5 Spleen
- •Nonfocal Changes of the Spleen
- •Diffuse Parenchymal Changes
- •Large Spleen
- •Small Spleen
- •Focal Changes of the Spleen
- •Anechoic Mass
- •Hypoechoic Mass
- •Hyperechoic Mass
- •Splenic Calcification
- •6 Lymph Nodes
- •Peripheral Lymph Nodes
- •Head/Neck
- •Extremities (Axilla, Groin)
- •Abdominal Lymph Nodes
- •Porta Hepatis
- •Splenic Hilum
- •Mesentery (Celiac, Upper and Lower Mesenteric Station)
- •Stomach
- •Focal Wall Changes
- •Extended Wall Changes
- •Dilated Lumen
- •Narrowed Lumen
- •Small/Large Intestine
- •Focal Wall Changes
- •Extended Wall Changes
- •Dilated Lumen
- •Narrowed Lumen
- •8 Peritoneal Cavity
- •Anechoic Structure
- •Hypoechoic Structure
- •Hyperechoic Structure
- •Anechoic Structure
- •Hypoechoic Structure
- •Hyperechoic Structure
- •Wall Structures
- •Smooth Margin
- •Irregular Margin
- •Intragastric Processes
- •Intraintestinal Processes
- •9 Kidneys
- •Anomalies, Malformations
- •Aplasia, Hypoplasia
- •Cystic Malformation
- •Anomalies of Number, Position, or Rotation
- •Fusion Anomaly
- •Anomalies of the Renal Calices
- •Vascular Anomaly
- •Diffuse Changes
- •Large Kidneys
- •Small Kidneys
- •Hypoechoic Structure
- •Hyperechoic Structure
- •Irregular Structure
- •Circumscribed Changes
- •Anechoic Structure
- •Hypoechoic or Isoechoic Structure
- •Complex Structure
- •Hyperechoic Structure
- •10 Adrenal Glands
- •Enlargement
- •Anechoic Structure
- •Hypoechoic Structure
- •Complex Echo Structure
- •Hyperechoic Structure
- •11 Urinary Tract
- •Malformations
- •Duplication Anomalies
- •Dilatations and Stenoses
- •Dilated Renal Pelvis and Ureter
- •Anechoic
- •Hypoechoic
- •Hypoechoic
- •Hyperechoic
- •Large Bladder
- •Small Bladder
- •Altered Bladder Shape
- •Intracavitary Mass
- •Hypoechoic
- •Hyperechoic
- •Echogenic
- •Wall Changes
- •Diffuse Wall Thickening
- •Circumscribed Wall Thickening
- •Concavities and Convexities
- •12.1 The Prostate
- •Enlarged Prostate
- •Regular
- •Irregular
- •Small Prostate
- •Regular
- •Echogenic
- •Circumscribed Lesion
- •Anechoic
- •Hypoechoic
- •Echogenic
- •12.2 Seminal Vesicles
- •Diffuse Change
- •Hypoechoic
- •Circumscribed Change
- •Anechoic
- •Echogenic
- •Irregular
- •12.3 Testis, Epididymis
- •Diffuse Change
- •Enlargement
- •Decreased Size
- •Circumscribed Lesion
- •Anechoic or Hypoechoic
- •Irregular/Echogenic
- •Epididymal Lesion
- •Anechoic
- •Hypoechoic
- •Intrascrotal Mass
- •Anechoic or Hypoechoic
- •Echogenic
- •13 Female Genital Tract
- •Masses
- •Abnormalities of Size or Shape
- •Uterus
- •Abnormalities of Size or Shape
- •Myometrial Changes
- •Intracavitary Changes
- •Endometrial Changes
- •Fallopian Tubes
- •Hypoechoic Mass
- •Anechoic Cystic Mass
- •Solid Echogenic or Nonhomogeneous Mass
- •14 Thyroid Gland
- •Diffuse Changes
- •Enlarged Thyroid Gland
- •Small Thyroid Gland
- •Hypoechoic Structure
- •Hyperechoic Structure
- •Circumscribed Changes
- •Anechoic
- •Hypoechoic
- •Isoechoic
- •Hyperechoic
- •Irregular
- •Differential Diagnosis of Hyperthyroidism
- •Types of Autonomy
- •15 Pleura and Chest Wall
- •Chest Wall
- •Masses
- •Parietal Pleura
- •Nodular Masses
- •Diffuse Pleural Thickening
- •Pleural Effusion
- •Anechoic Effusion
- •Echogenic Effusion
- •Complex Effusion
- •16 Lung
- •Masses
- •Anechoic Masses
- •Hypoechoic Masses
- •Complex Masses
- •Index
Hypoechoic Masses
|
|
|
Masses |
|
Atelectasis |
|
|
Lung |
|
||||||
|
Anechoic Masses |
|
Pulmonary Embolism or Infarction |
|
|||
|
Hypoechoic Masses |
|
|
||||
|
|
|
|
|
Pulmonary Tumors and Metastases |
|
|
|
|
|
|
Complex Masses |
|
|
|
|
|
|
|
|
|
|
|
Table 16.2 reviews the differential diagnosis of |
Table 16.2 Differential diagnosis of hypoechoic masses |
||||||
hypoechoic masses in the lung. |
|
Common |
Less common |
||||
|
|
|
|
|
|
||
|
|
|
|
|
|
Atelectasis |
Lobar pneumonia |
|
|
|
|
|
|
Pulmonary embolism or infarction |
Lung abscess |
|
|
|
|
|
|
Pulmonary tumor |
|
Atelectasis


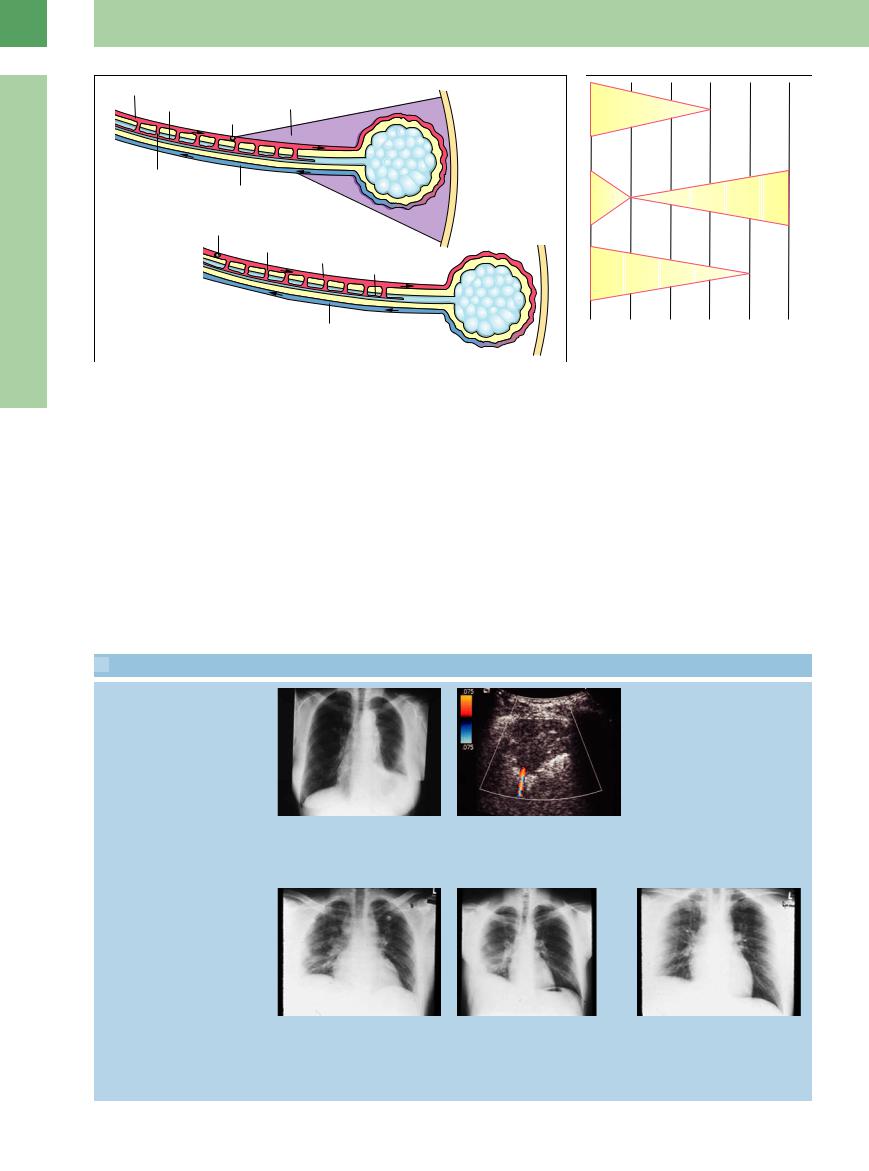
Atelectasis is characterized by an absence of aeration in pulmonary segments, lobes, or an entire lung. It is distinguished from dysatelectasis, in which aeration is decreased.
Compressive and obstructive atelectasis. Atelectasis is classified as compressive or obstructive on the basis of its pathogenesis. Compressive atelectasis is caused by a large pleural effusion in which the external fluid pressure on the lung parenchyma exceeds the internal pressure transmitted by the intrabronchial air ( 16.2). Obstructive atelectasis, also called absorption atelectasis, results from bronchial obstruction and absorption of the air in the occluded area (
 16.3).
Sonographic features. Compression atelectasis appears sonographically as a narrow, relatively well-defined, wedge-shaped area of peripheral lung showing homogeneous hypoechoic transformation. Real-time ultrasound may show partial reinflation of the collapsed area during inhalation. This may produce a conspicuous “air bronchogram.” Partial reinflation may oc-
cur following percutaneous aspiration of the effusion (Table 16.3,  16.2).
Obstructive atelectasis also shows homogeneous low echogenicity. The sectional ultrasound image of the affected lung segment resembles a scan of the liver parenchyma (“hepatization” of the lung) ( 16.3f). An air bronchogram is not observed (Table 16.3). With longstanding atelectasis (usually caused by a central tumor mass), the retention of secretions can produce a “fluid bronchogram” (
 16.3a,b). Ultrasound demonstrates hypoechoic, mucusfilled bronchial lumina surrounded by echogenic bronchial walls. Color Doppler can differentiate the fluid bronchogram from vascular structures. Increased color-flow signals are observed in the atelectatic lung tissue (
16.3f,j,q,r).
In CEUS, atelectasis caused by compression often shows increased pulmonary arterial vascularization ( 16.2 g–j).
Central mass. Central obstructions of the bronchial tree can cause the development of atelectasis. Occasionally the obstructing central mass
can be identified, the atelectatic lung serving as a kind of acoustic window for exploring mediastinal structures ( 16.3c,e,n).
In principle, central masses that are sonographically defined can be percutaneously aspirated through the atelectasis with a fine needle.
Structural nonhomogeneities. The pulmonary vascular tree may account for nonhomogeneities seen with ultrasound in the postobstructive lung. Rounded, predominantly hypoechoic or anechoic areas are caused by retained secretions in the atelectatic lung. When infection is present, poststenotic foci of liquefaction due to abscess formation (obstructive pneumonitis) may be seen ( 16.3 p–r). The positive differentiation of hypoechoic focal masses (incipient abscess, metastasis) is occasionally difficult.
In general, central lesions and parenchymal focal lesions in atelectasis are better detected by CEUS ( 16.3 s–v).
Table 16.3 Possible sonographic findings in compressive and obstructive atelectasis |
|
|
|
|
Compressive atelectasis |
Obstructive atelectasis |
|
B-mode ultrasound |
● Moderate to marked pleural e usion |
● Little or no pleural e usion |
|
|
● Triangular, peaked-cap hypoechoic transformation of |
● Homogeneous, hypoechoic transformation of the |
|
|
the lung parenchyma |
lung parenchyma |
|
|
● Indistinct margins with aerated lung |
● Echogenic bands may be visible (“fluid bronchogram”) |
|
|
● Partial reinflation during inhalation (“air broncho- |
● Intraparenchymal foci may appear due to: |
|
|
gram”) |
– |
parenchymal liquefaction |
|
● Partial reinflation after pleurocentesis |
– |
microabscesses/macroabscesses |
|
|
– |
metastases |
|
|
● A central mass may be seen |
|
|
|
● No reinflation during inhalation |
|
Color Doppler ultrasound |
● Increased flow signals relative to the liver |
● Increased flow signals relative to the liver |
|
|
|
● Triphasic pulmonary artery waveforms (“extremity” |
|
|
|
pattern) |
|
16
Masses
537
16
Lung
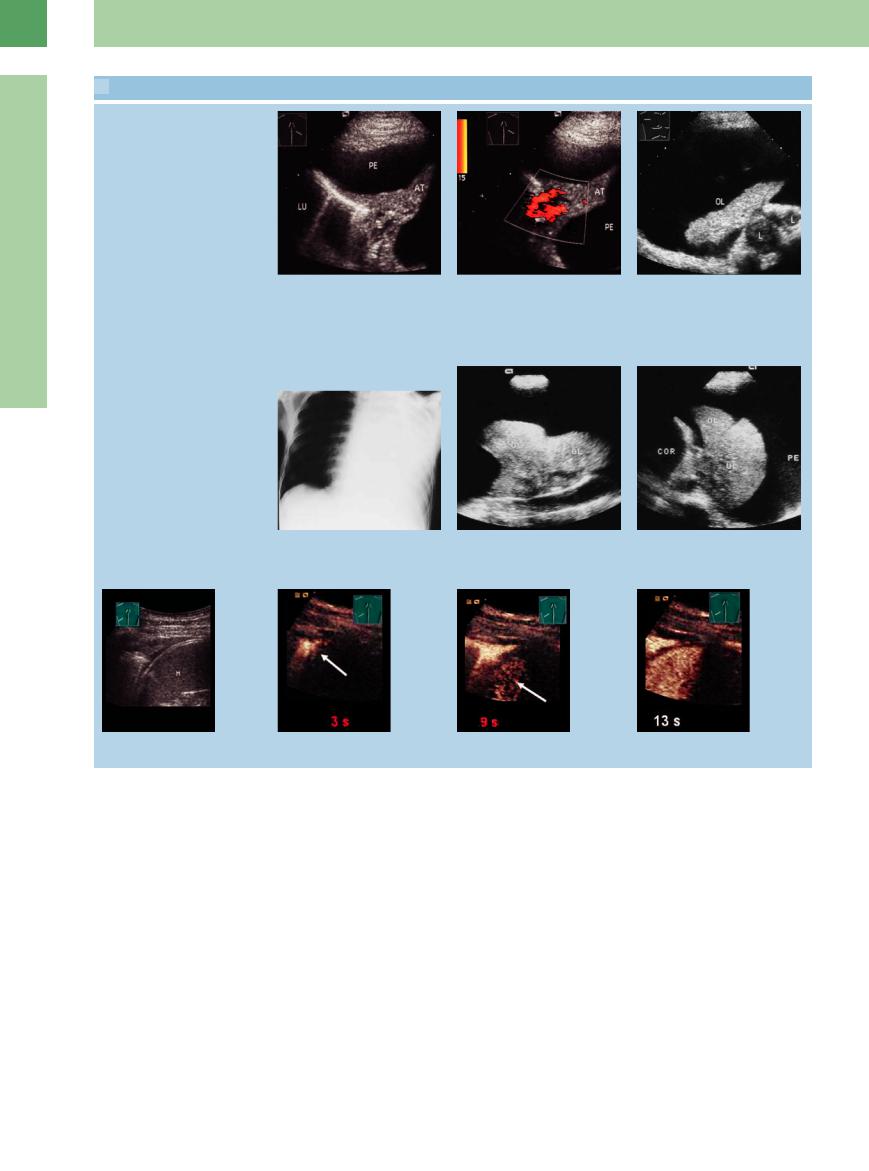
 16.2 Compression Atelectasis
Partial atelectasis
a and b Pleural e usion (PE) in an 87-year- |
b Color Doppler shows increased flow |
old woman. |
signals in the atelectatic area (AT). |
a Compression atelectasis (AT) a ecting |
|
the lower lobe of the right lung (LU). |
|
Atelectasis shown in chest radiograph,
B-mode ultrasound, and CEUS
c A 73-year-old man with squamous cell carcinoma and a radiograph showing a white hemithorax on the right side.
Ultrasound demonstrates e usion and upper lobe atelectasis (UL). The central hypoechoic masses are consistent with lymph node metastasis (L).
d–f A 35-year-old man with bronchial carcinoma.
d Chest radiograph shows complete opacification of the left hemithorax.
e and f Longitudinal and transverse scans show pronounced e usion with atelectasis of upper (UL) and lower (LL) lobes. COR = heart; PE = pleural e usion.
g–j Atelectasis caused by compression in contrast-enhanced ultrasound. The atelectasis shows an earlier contrast accumulation than the spleen (M). This suggests a pulmonary arterial vascularization.
Pulmonary Embolism
 or Infarction


Autopsy studies show that pulmonary embolism is among the leading causes of death (10–30%). An intravital diagnosis is made in just 20–30% of cases. An acute pulmonary embolism is accompanied by hemorrhagic lung infarction in approximately 45–60% of cases.
Diagnosis. Pulmonary embolism is diagnosed with the aid of available methods and includes an overall assessment of clinical findings, chest radiography, pulmonary scintigraphy, CT, echocardiography, and MRI.
Role of ultrasound. Although lung tissue that has undergone hemorrhagic infarction or consolidation can in principle be visualized on the basis of abnormal pulmonary sound transmis-
sion, the role of thoracic ultrasound in the diagnosis of pulmonary infarction cannot be adequately evaluated at present.6,7 For a pulmonary embolism to be detectable with ultrasound, there must be a significant perfusion defect causing compromise of alveolar ventilation. But in many cases a large pulmonary embolism involving pulmonary, lobar and segmental arteries will not produce an infarction because there is an adequate collateral supply, usually via branches of the bronchial rami (Fig.16.5). This type of embolism cannot be visualized with thoracic ultrasound ( 16.4a–c). Embolisms at the subsegmental level are more apt to cause hemorrhage into the alveolar airspace, making them accessible to ultrasound imaging.
Thus, thoracic ultrasound has a special role in the diagnosis of small, scintigraphically negative embolisms and infarctions that are 2 cm or less in diameter.
Although the hemorrhage associated with pulmonary embolism may resolve completely within a matter of days, a pulmonary infarction will show delayed regression in serial ultrasound examinations. Generally these lesions heal by scarring.
Sonographic features. Pulmonary embolism can have various ultrasound appearances ( 16.5). All possible patterns of involvement may be associated with varying degrees of pleural effusion.
538
 16.3 Obstructive Atelectasis
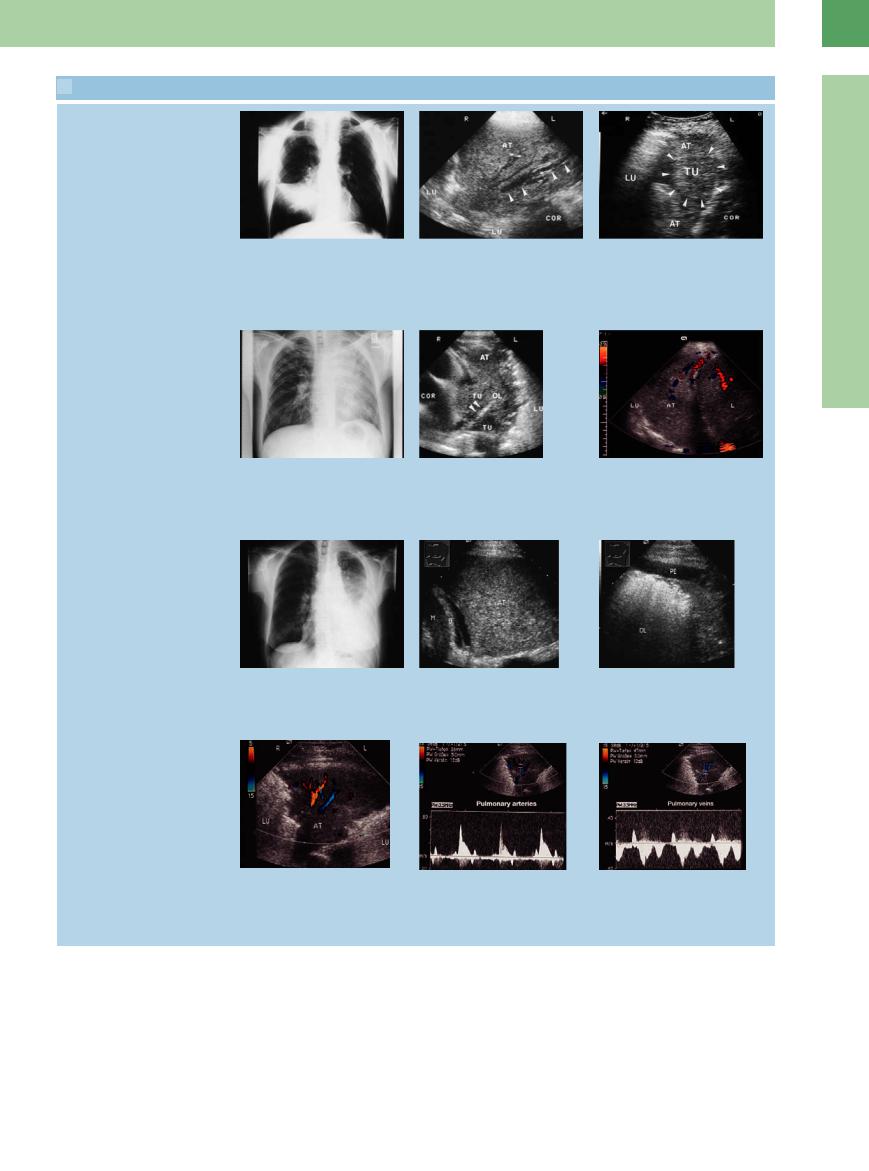
Middle lobe atelectasis
a and b Bronchial carcinoma.
a Chest radiograph shows signs of middle lobe atelectasis.
Atelectasis caused by lung cancer
d and e Bronchial carcinoma.
d Chest radiograph shows almost complete opacification of the left hemithorax.
g–i Bronchial carcinoma in a 74-year-old woman.
g Chest radiograph shows opacification of the left lower lung field.
Flow profile in atelectasis
b Right anterior intercostal scan shows hypoechoic transformation of the lung with an echo-free “fluid bronchogram” caused by central obstruction. AT = atelectasis; LU = lung; COR = heart.
e Transverse scan shows upper lobe atelectasis (AT) with delineation of a central tumor (TU). The arrows point to the severely narrowed upper lobar bronchus. COR = heart; UL = upper lobe; LU = lung.
h Ultrasound shows homogeneous hypoechoic transformation of the left lower lobe consistent with atelectasis (AT). D = diaphragm; M = spleen.
c Bronchial carcinoma in a 67-year-old man, atelectasis of middle lobe seen on radiograph. Right anterior ultrasound scan shows hypoechoic transformation of the lung consistent with atelectasis (AT). A central tumor mass (TU) is identified. LU = lung; COR = heart.
f Patient with bronchial carcinoma. Right lateral intercostal scan shows “hepatization” of the lung characteristic of atelectasis (AT). Color Doppler shows increased flow signals in the atelectatic lung tissue. L = liver; LU = lung.
i The central portions of the upper lobe (UL) are still aerated. Together with scant pleural e usion (PE), this suggests obstructive atelectasis of the lower lobe.
16
Masses
j–l Suspected bronchial carcinoma in a 74- year-old woman.
j Color Doppler mode: in the paravertebral scan direction on the right side, tumor formation of the lung like an atelectasis.
k–l In the color Doppler scanning of atelectasis, characteristic waveforms can usually be sampled from the pulmonary arteries (“extremity” pattern) and pulmonary veins. AT = atelectasis; LU = lung.
Localized irregular entry echo. Irregular entry echoes are a common finding even in patients with deep lower-extremity venous thrombosis who are clinically asymptomatic for pulmonary embolism (“sentinel emboli”). Irregular entry echo refers to a localized disruption in the sharp pleural line measuring less than 2 cm. The foci may be in the millimeter size range.
They may have a wedge or square shape with homogeneous low echogenicity. They may represent hemorrhages and may resolve within a few days. Frequently, no clinical or scintigraphic correlate is found to explain the sonographic change ( 16.4 d–i).
Band-like disruption of the entry echo. This feature is characterized by a lengthy disruption in the normal pleural entry echo. It is less common than a localized disruption and frequently has a scintigraphic correlate (“tip of the iceberg”;  16.4 g–i).
539
16
Lung
 16.3 Obstructive Atelectasis (Continued)
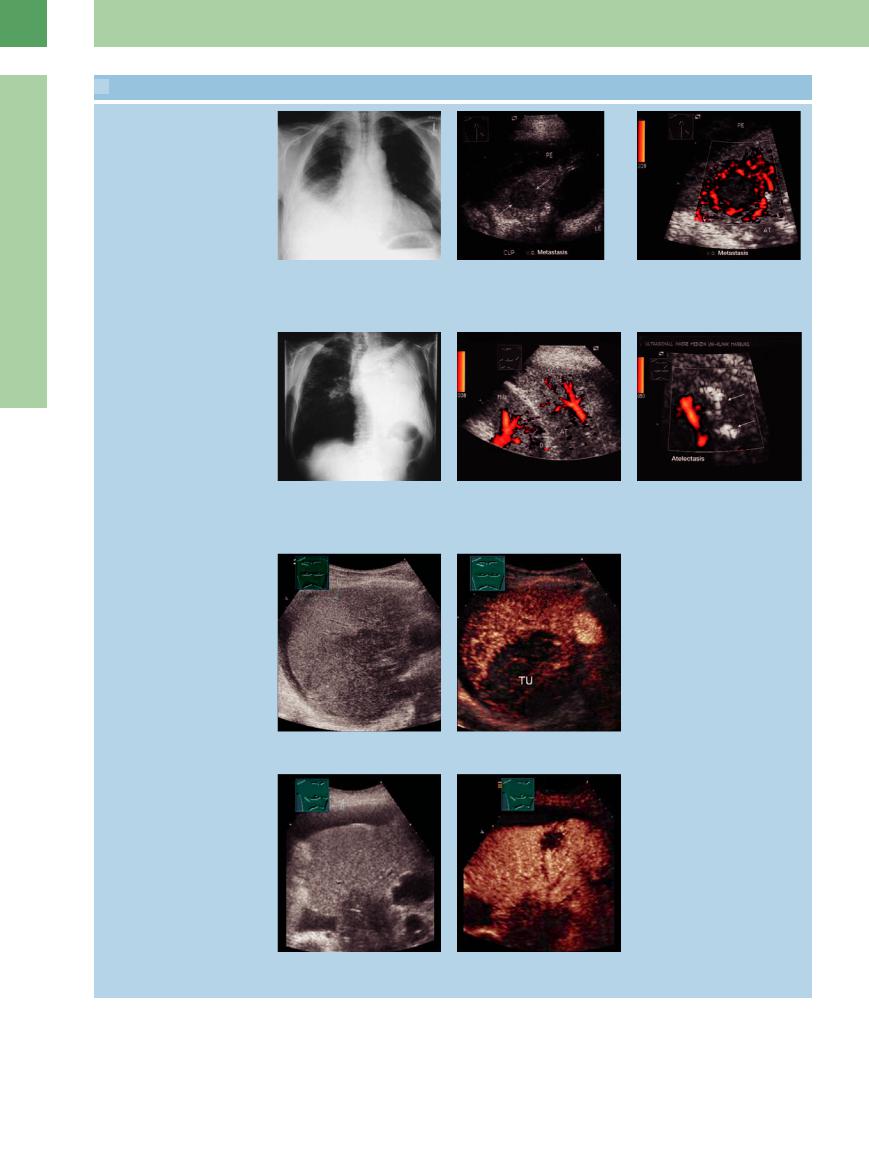
Focal lesion in atelectasis: gray-scale image, power-mode, CEUS
m–o A 73-year-old man with a cytologically malignant pleural e usion.
m Chest radiograph shows a right-sided pleural e usion.
p–r Bronchial carcinoma in a 65-year-old man.
p Chest radiograph shows a white hemithorax on the left side.
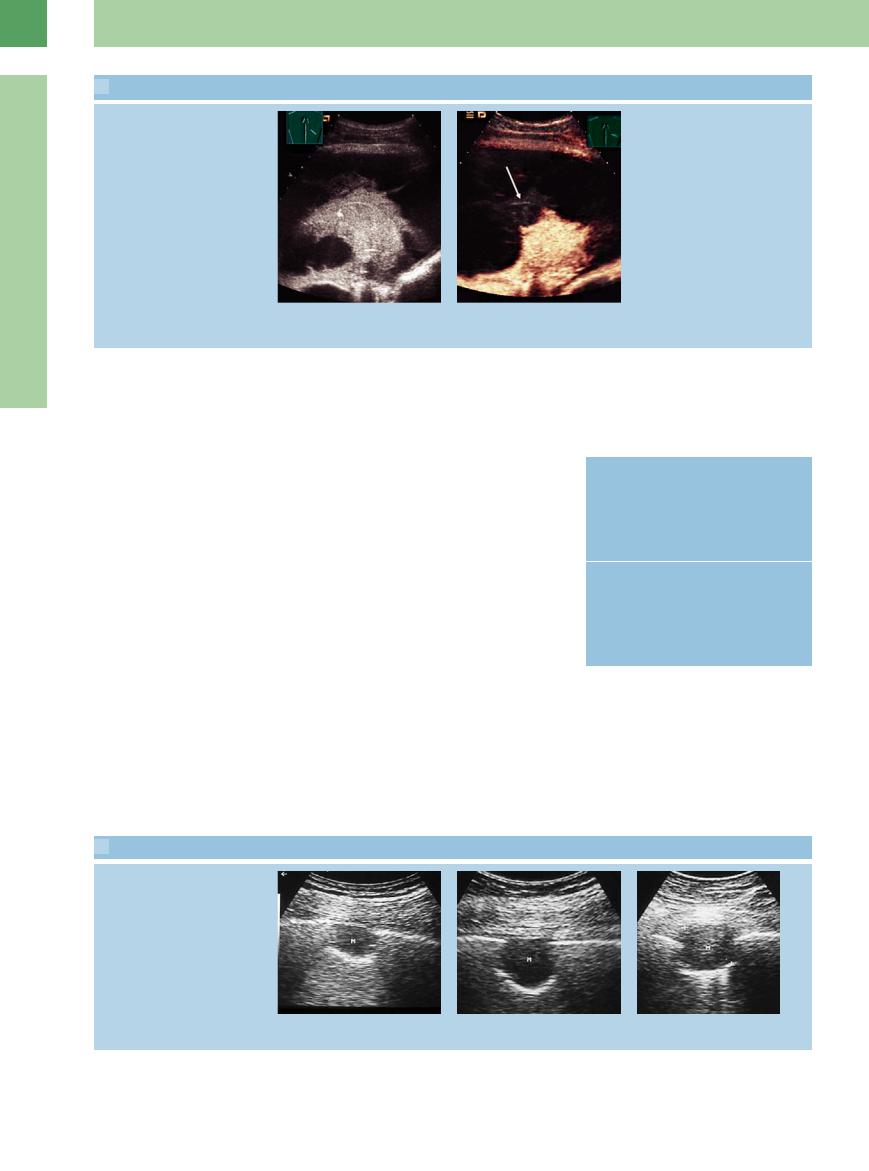
Atelectasis shown in contrast-enhanced ultrasound (CEUS)
n Upper lobe atelectasis with a central hypoechoic focus. LE = liver; PE = pleural e usion.
q Ultrasound scan shows homogeneous, hypoechoic transformation of the left lower lobe consistent with obstructive atelectasis. AT = atelectasis; D = diaphragm.
o The absence of intralesional flow signals on color Doppler is consistent with incipient liquefaction, but a metastasis cannot be excluded. AT = atelectasis; PE = pleural e usion.
r Scan shows a rounded, hypoechoic, partially air-filled mass within the atelectasis in the upper lobe, consistent with obstructive pneumonitis.
s and t Presentation of an atelectasis caused by obstruction in CEUS. There is a clear demarcation of the atelectasis from the central tumor, with less contrast accumulation.
u and v Demonstration of an atelectasis caused by obstruction in CEUS. There is a clear demarcation of the atelectasis from the central tumor, with less contrast accumulation. A focal lesion can be seen in the atelectasis with CEUS, but is not visible in B-mode.
540
 16.4 Entry Echo in Pulmonary Embolism
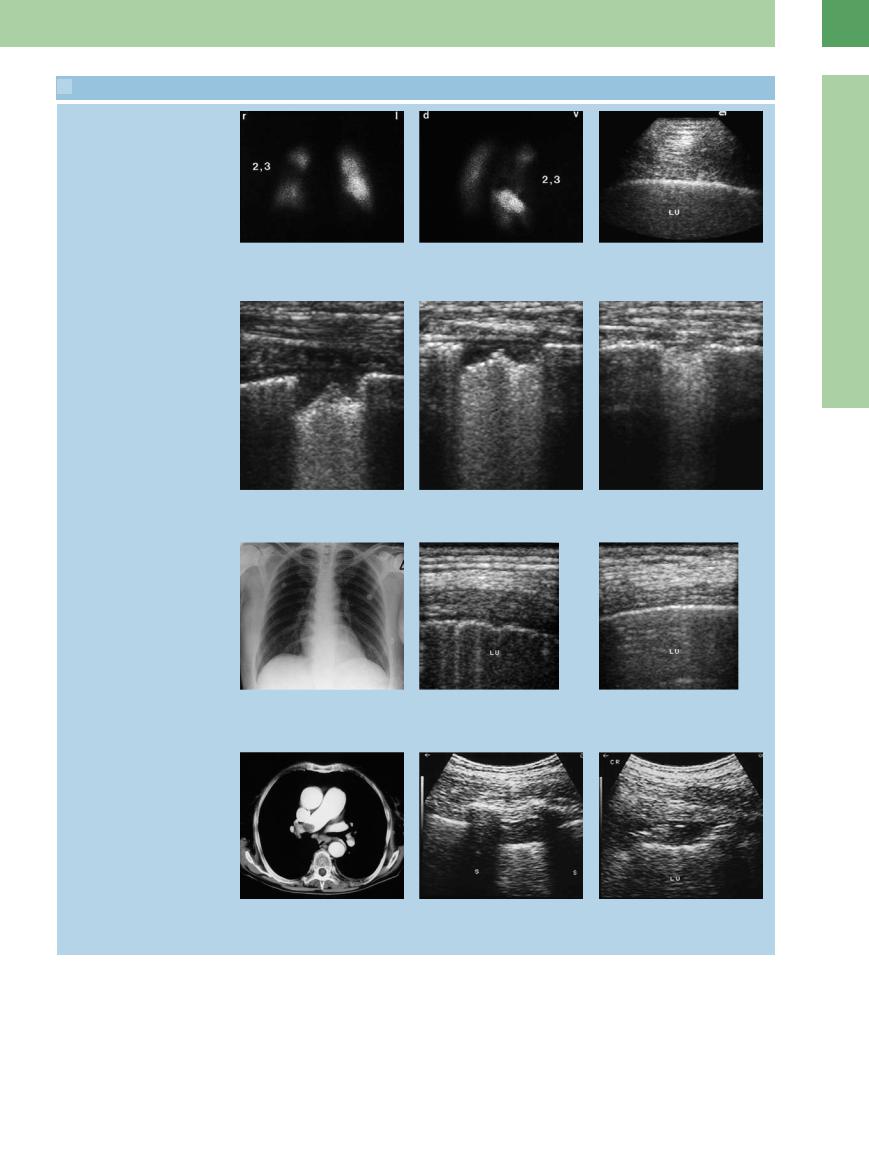
Normal entry echo vs. localized irregularity
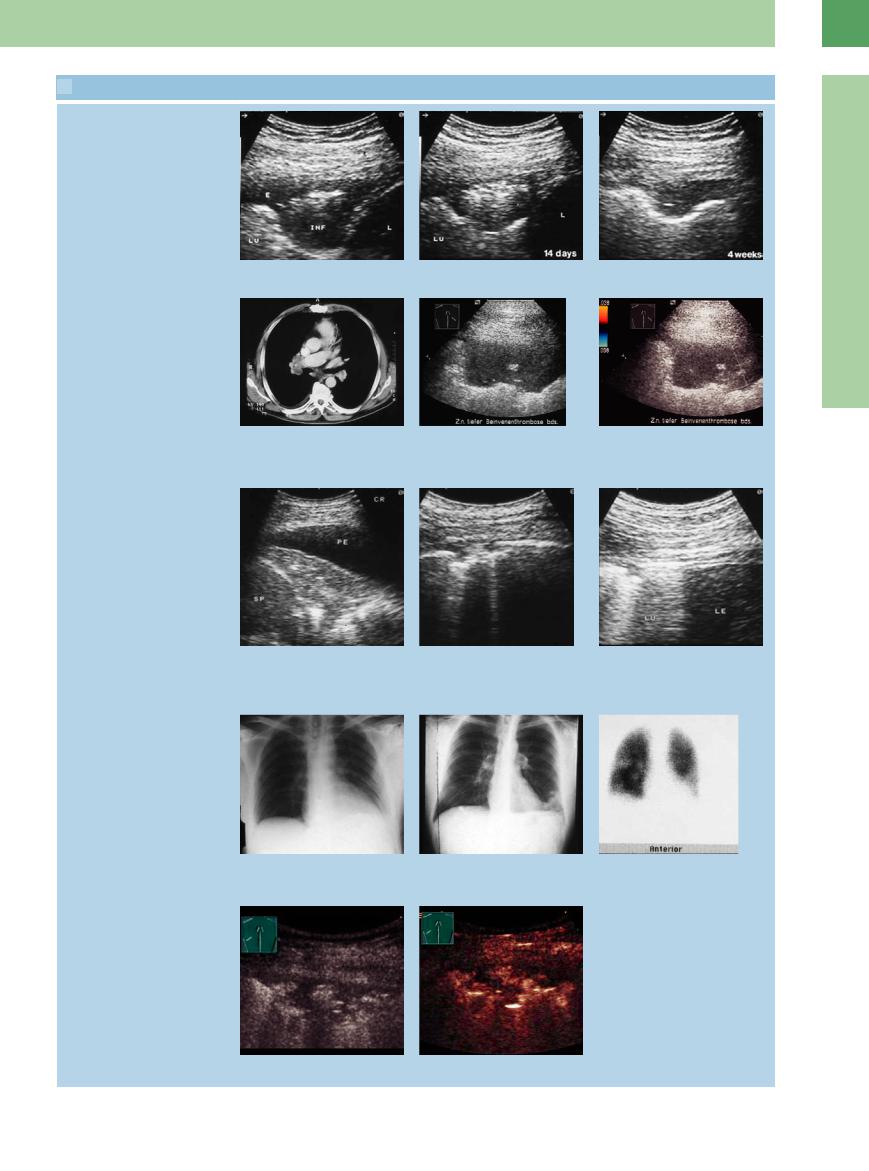
a–c Suspected pulmonary embolism in a 64-year-old man.
a and b Lung scintiscans. The findings in segments 2 and 3 of the right upper lobe are consistent with pulmonary embolism.
Pulmonary infarction, progress
c Ultrasound shows a completely normal, sharp pleural entry echo along segments 2/3 of the right lung (LU).
16
Masses
d–f A 65-year-old man with scintigraphically confirmed pulmonary embolism. Left anterior intercostal scan shows an approximately 1.5 cm pleural defect. Scans taken after 1 and 4 weeks document cicatricial healing. These findings are consistent with pulmonary infarction.
Extended disruption of the entry echo
g–i Scintigraphically confirmed pulmonary embolism in a 46-year-old woman.
g Chest radiograph shows no lung abnormalities.
h Extended irregular entry echo, consistent with pulmonary embolism. LU = lung.
i Normal pleural entry echo for comparison. LU = lung.
Various pleural structural defects
j–l Pulmonary embolism in an 80-year-old woman.
j CT shows thrombotic material in the right pulmonary artery.
k and l Ultrasound scans through di erent intercostal spaces show variable pleural structural defects in the posterior part of the right lower lung field. LU = lung; S = spleen.
541
16
Lung
Fig. 16.5 Schematic diagram showing the occlusion of a pulmonary artery.6 a Central pulmonary artery.
b Peripheral pulmonary artery.
Wedge-shaped lesion. The classic wedgeshaped morphology of a pulmonary infarction with homogeneous low echogenicity and an absence of vascular color-flow signals in the infarcted area is rather uncommon. In serial examinations, these infarctions often show a gradual tendency to regress over a period of weeks ( 16.5a–k).
Larger areas of structural transformation. Relatively large areas of hypoechoic transformation in the lung are often associated with a pleural effusion and are considered a nonspecific feature of pulmonary embolism in thoracic
ultrasound. The concomitant detection of a deep lower-extremity venous thrombosis or of irregular entry echoes in the otherwise nor- mal-appearing opposite lung suggests the likelihood of pulmonary embolism when corresponding clinical findings are present ( 16.4 l–q). Large areas of structural transformation are, however, also seen in association with pleuropneumonia and compression atelectasis due to other causes.
Color Doppler ultrasound. Color-flow signals are usually not detected in the infarcted area.
Fig. 16.6 Role of ultrasound in the diagnosis of pulmonary embolism.9 UCG = echocardiography.
In rare cases an afferent vessel may be demonstrated.
CEUS. Peripheral lung embolisms are marked in CEUS by missing or inhomogenous vascularization. This differentiates them from lesions caused by inflammation, which have increased vascularization ( 16.5r–u).
The definitive role of thoracic ultrasound in the diagnosis of pulmonary embolism remains to be determined. However, it is superior to all other modalities for selected applications, particularly the detection of smaller pulmonary embolisms (Fig.16.6).6
 16.5 Wedge-Shaped Lesions and More Diffuse Areas of Structural Transformation due to Pulmonary Embolism
Wedge-shaped lesion
a and b Scintigraphically confirmed pulmonary embolism in a 71-year-old woman.
a Chest radiograph shows opacity in the left lower lung field.
b Left lateral intercostal scan shows a wedge-shaped hypoechoic lesion. Color Doppler shows a erent flow signals but none within the lesion. The finding is suspicious for pulmonary infarction.
Pulmonary infarction
c–h Scintigraphically confirmed pulmonary embolism in a 34-year-old man. c–e Chest radiographs show the progres-
sion of a pulmonary embolism in the right lower lobe.
c Initial radiograph shows no abnormalities.
d and e Radiographs at 4 and 8 weeks document regression of findings in the right lower field.
542
 16.5 Wedge-Shaped Lesions and More Diffuse Areas of Structural Transformation due to Pulmonary Embolism (Continued)
f–h Right lateral intercostal scans in postinfarction pneumonia show the progression of sonographic findings over a 4-week period.
Hypoechoic transformation
16
Masses
i–k Pulmonary embolism in a 56-year-old man.
i CT shows thrombotic material in the right pulmonary artery.
j Hypoechoic transformation of lung parenchyma.
k Color Doppler does not record flow signals consistent with pulmonary infarction.
Diffuse hypoechoic transformation
l–q Scintigraphically confirmed pulmonary embolism in a 30-year-old man.
l–n Left lateral intercostal scan shows a large area of hypoechoic transformation with moderate pleural e usion (PE). Scans through di erent intercostal spaces on the right side show pleural structural defects. Given the bilateral findings, the parenchymal defect on the left side is also very suspicious for postinfarction pneumonia. LE = liver; LU = lung; SP = spleen.
o Chest radiograph. The costophrenic angle is not defined at the edge of the lower left field.
p Follow-up radiograph shows consolidation in that region.
q Left-sided pulmonary embolism on scintigraphy.
Infarction in CEUS
r and s Lung embolism in CEUS. The lesion does not accumulate contrast agent.
543
16
Lung
 16.5 Wedge-Shaped Lesions and More Diffuse Areas of Structural Transformation due to Pulmonary Embolism (Continued)
t and u Distinct pleural e usion with atelectasis caused by compression, in CEUS. The atelectasis accumulates contrast agent but small areas stay unenhanced (arrow). This indicates the presence of lung embolisms.
Pulmonary Tumors and
 Metastases


Sonography is the method of choice for accurately determining local tumor spread and should be performed before any proposed surgical treatment. The most frequent causative lesions are non-small-cell bronchial carcinomas.
Sonographic features. Peripheral lung tumors and metastases can be defined sonographically as solid hypoechoic masses when they extend to the visceral or parietal pleura ( 6.6a–f). Tumor invasion of the chest wall can be diagnosed by noting fixation of the lesion to the chest wall during respiratory excursions (see Fig.15.8; see also Chapter 15;
  16.6 g–i). Structural nonhomogeneities in the tumor may be due to necrosis (Table 16.4,
  16.6j–l). Most tumors are sharply demarcated from surrounding hyperechoic lung.
Color Doppler ultrasound. In the sonographic diagnosis of lung tumors and metastases, it should be considered that complete segmental consolidation due to pneumonia or atelectasis may also show homogeneous low echogenicity. Atelectatic areas show increased vascular flow
signals in color Doppler, however. Tumors are often characterized by a scant number of vessels, which are often seen in the peripheral part of the lesion ( 16.6e,r–u). An exception is alveolar cell carcinoma, which is conspicuous at color Doppler by its hypervascularity (
16.6 m–q).
Peripheral lung cancer/metastasis often shows bronchial arterial vascularization in CEUS.
Table 16.4 lists the sonographic findings that are most commonly associated with peripheral lung tumors.
Ultrasound-guided percutaneous biopsy. Peripheral lung tumors and metastases can be safely punctured under ultrasound guidance. With larger lesions, tissue should be sampled from areas that exhibit color-flow vascularity. Ultrasound-guided percutaneous biopsy is particularly indicated for masses at the pleural apex (Pancoast tumors), which are difficult to biopsy by bronchoscopy.
Table 16.4 Possible sonographic findings associated with peripheral lung tumors
B-mode ultrasound
●Usually shows homogeneous, hypoechoic transformation of lung tissue
●Sharply demarcated from aerated lung
●No air bronchogram
●Occasional central necrosis
Color Doppler ultrasound
●Decreased color flow in relation to the liver
●Waveforms from tumor vessels often show high diastolic flow (“parenchymal artery” pattern)
 16.6 Pulmonary Tumors and Metastases
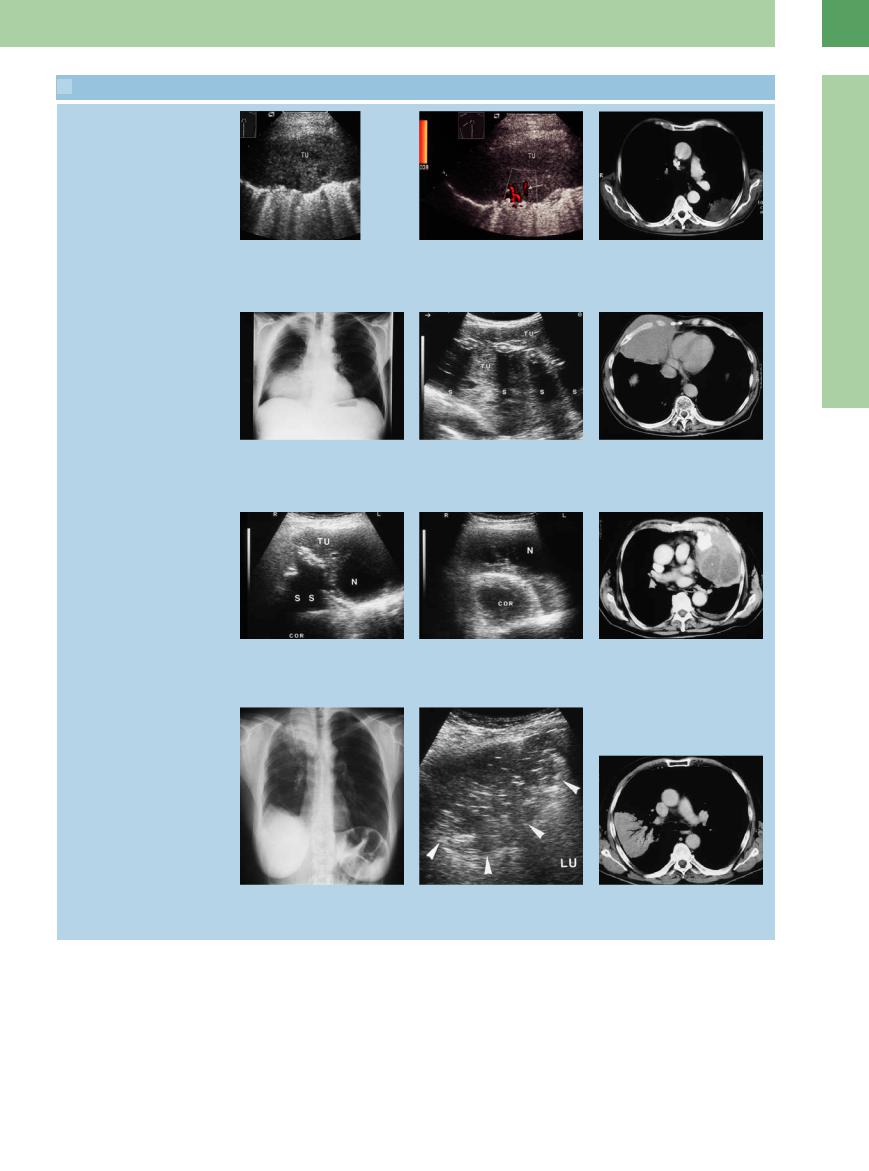
Tumor movement with respiration
a–c The absence (a and b) or presence (c) of peripheral lung tumor (M) fixation to the parietal pleura can be determined by watching for tumor movement during respiration.
544
 16.6 Pulmonary Tumors and Metastases (Continued)
Adhesion to the chest wall
d–f Bronchial carcinoma in a 72-year-old |
e Color flow is seen only at the periphery f CT: peripheral tumor mass. |
man. |
of the tumor (TU). |
d An area of lung tissue showing homo- |
|
geneous hypoechoic transformation is |
|
adherent to the chest wall. TU = tumor. |
|
Infiltration of the chest wall
g–i Malignant lymphoma in a 70-year-old |
h Right anterior scan angled caudally |
i CT: tumor mass infiltrating the chest |
man. |
shows a predominantly hypoechoic lesion |
wall. |
g Chest radiograph shows di use opacity |
infiltrating the chest wall. The ribs are |
|
in the lower right lung. |
engulfed by tumor (TU) but are not |
|
|
destroyed. S = acoustic shadows. |
|
Necrosis
j–l Malignant histiocytoma in an 85-year-old man. |
l CT: thoracic tumor mass. |
j and k Scans through di erent intercostal spaces on the left side show a complex |
|
tumor mass (TU) with signs of calcification and necrosis (N). S = acoustic shadow; COR |
|
= heart. |
|
Bronchoalveolar carcinoma
16
Masses
m–o Bronchoalveolar carcinoma in an 83- year-old man.
m Chest radiograph shows di use opacity in the right middle and upper zones.
n Right lateral intercostal scan shows a nonhomogeneous hypoechoic lung region with irregular margins. The tumor shows a positive air bronchogram.
o CT: lung consolidation with a positive air bronchogram.
545