


Foundation Summary 67
Foundation Summary
The “Foundation Summary” is a collection of tables and figures that provide a convenient review of many key concepts in this chapter. For those of you already comfortable with the topics in this chapter, this summary could help you recall a few details. For those of you who just read this chapter, this review will help solidify some key facts. For any of you doing your final prep before the exam, these tables and figures will be a convenient way to review the day before the exam.
Table 1-29 outlines some of the behaviors seen when no QoS is applied in a network.
Table 1-29 Traffic Behavior with No QoS
Type of Traffic |
Behavior Without QoS |
|
|
Voice |
Voice is hard to understand. |
|
|
|
Voice breaks up, sounds choppy. |
|
|
|
Delays make interacting difficult; callers do not know when other party has |
|
finished talking. |
|
|
|
Calls are disconnected. |
|
|
Video |
Picture displays erratically; jerky movements. |
|
|
|
Audio not in sync with video. |
|
|
|
Movement slows down. |
|
|
Data |
Data arrives after it is no longer useful. |
|
|
|
Customer waiting for customer care agent, who waits for a screen to |
|
display. |
|
|
|
Erratic response times frustrate users, who may give up or try later. |
|
|
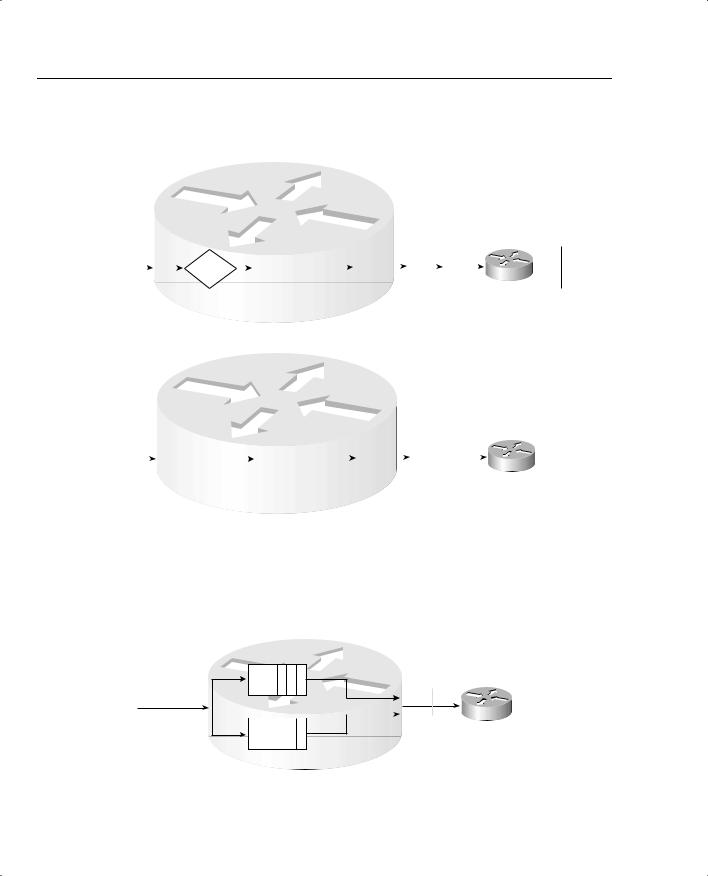
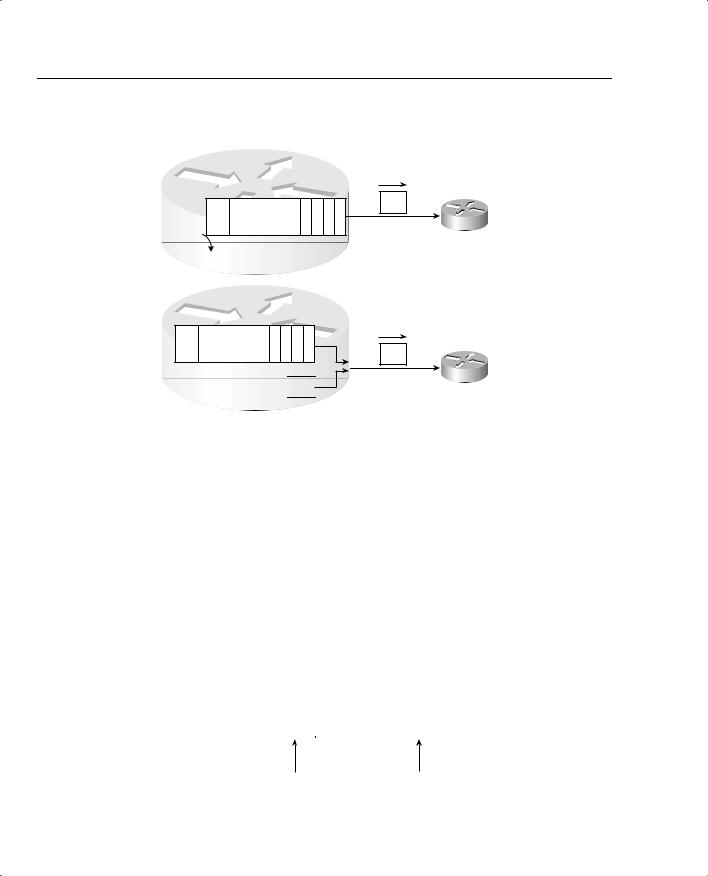
As shown in Figure 1-36, with compression, if a ratio of 2:1 is achieved, the 80-kbps flow will only require 40 kbps in order to be sent across the link—effectively doubling the bandwidth capacity of the link.
68 Chapter 1: QoS Overview
Figure 1-36 With a 2:1 Compression Ratio Versus No Compression
Router 1
|
|
|
|
|
|
|
|
|
|
|
|
|
|
Tx |
|
|
|
|
|
|
|
|
|
FIFO Queue |
|
Queue 64 kbps |
|
|
|||||||
Offered Load: |
|
|
Compress |
|
|
|
|
|
|
|
|
|
|
|
S0 |
|
|
|
|
|
|
|
|
|
|
|
|
|
|
|
|
|
|||
|
|
|
|
|
|
|
|
|
|
|
|
|
|
|
|
||
80 kbps |
|
|
|
|
|
|
|
|
|
|
|
|
|
40 kbps |
R2 |
||
|
|
|
|
|
|
|
|
|
|
|
|
|
|
||||
|
|
|
|
|
|
|
|
|
|
|
|
|
|
|
|
|
|
Sent
Router 1
|
|
|
|
|
|
|
|
|
|
|
|
|
|
|
Tx |
64 kbps |
|
|
|
|
|
FIFO Queue |
|
Queue |
|
|
|||||||||||
Offered Load: |
|
|
|
S0 |
|
|
||||||||||||
|
|
|
|
|
|
|
|
|
|
|
|
|
|
|
|
|||
|
|
|
|
|
|
|
|
|
|
|
|
|
|
|
|
|
||
80 kbps |
|
|
|
|
|
|
|
|
|
|
|
|
|
|
64 kbps Sent, |
R2 |
||
|
|
|
||||||||||||||||
|
|
Larger Queue Due |
|
|
|
Rest Queued |
|
|
||||||||||
|
|
|
|
|
|
|
||||||||||||
|
|
|
to Congestion |
|
|
|
|
|
|
|||||||||
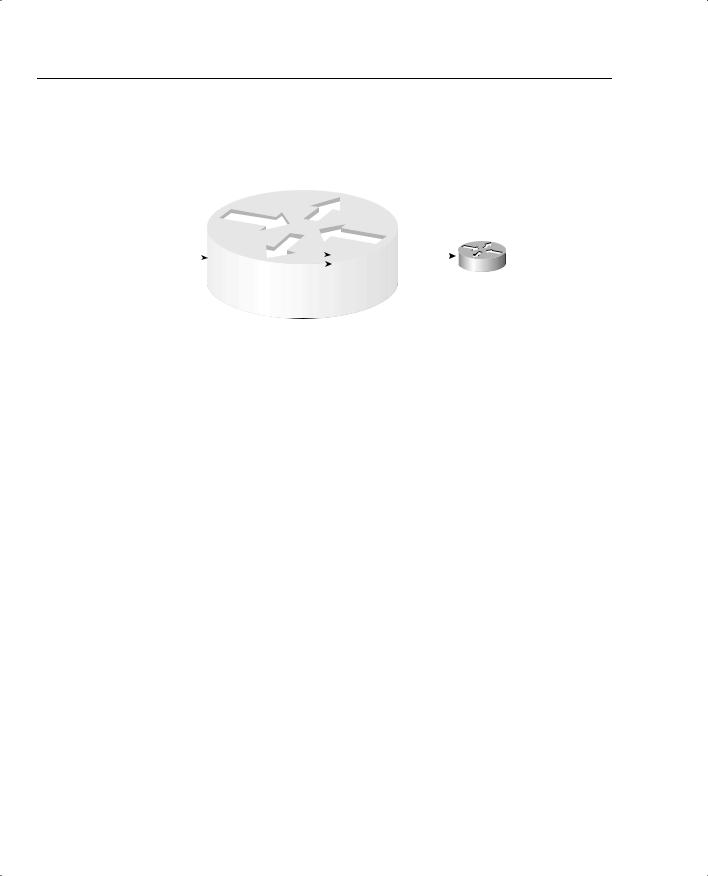
Figure 1-37 shows a two-queue system where the first queue gets 25 percent of the bandwidth on the link, and the second queue gets 75 percent of the bandwidth.
Figure 1-37 Bandwidth Reservation Using Queuing
4 X 1500
Byte Packets
R1
Output Queue |
125% |
3 2 1 |
Bandwidth |
|
Output Queue |
2 |
|
R2 |
|
|
|||
|
|
|
4 75% Bandwidth
The tools summarized in Table 1-30 help to improve the effects of bandwidth in a network.
|
|
Foundation Summary 69 |
|
|
|
Table 1-30 QoS Tools That Affect Bandwidth |
||
|
|
|
|
Type of QoS Tool |
How It Affects Bandwidth |
|
|
|
|
Compression |
Compresses either payload or headers, reducing overall number of bits |
|
|
required to transmit the data |
|
|
|
|
CAC |
Reduces overall load introduced into the network by rejecting new voice |
|
|
and video calls |
|
|
|
|
Queuing |
Can be used to reserve minimum amounts of bandwidth for particular |
|
|
types of packets |
|
|
|
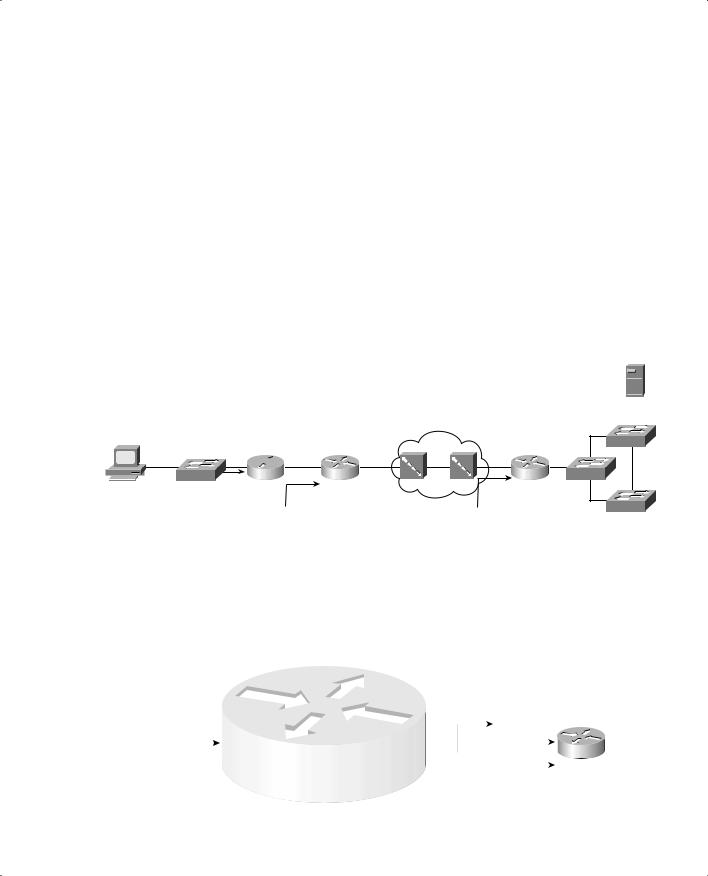
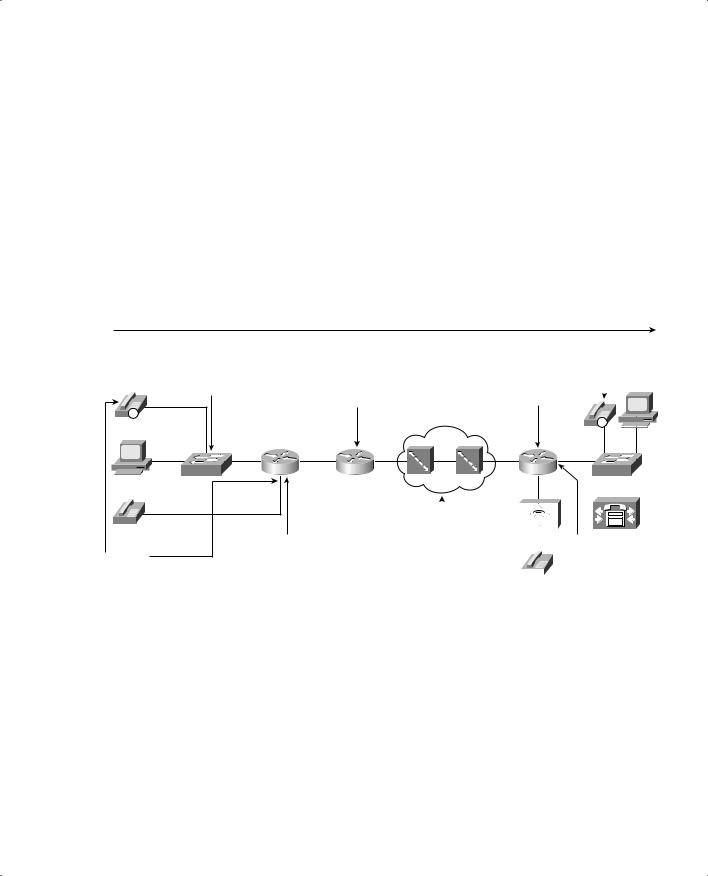
Figure 1-38 shows two contrasting examples of serialization and propagation delay.
Figure 1-38 Serialization and Propagation Delay for Selected Packet and Link Lengths
Server 1
Hannah

 1000 km
SW1 |
R1 |
56 kbps |
R2 |
128 kbps |
|
|
Serialization: 125-Byte Packet: 17.86 ms
Serialization: 1250-Byte Packet: 178.6 ms
Propagation: Either Size Packet: 4.8 ms
|
|
|
SW3 |
|
|
10 km |
|
T3 |
T1 |
R3 |
SW2 |
|
|
||
Serialization: 125-Byte Packet: .65 ms |
SW4 |
||
|
|||
Serialization: 1250-Byte Packet: 6.5 ms |
|
||
Propagation: Either Size Packet: .048 ms |
|
||
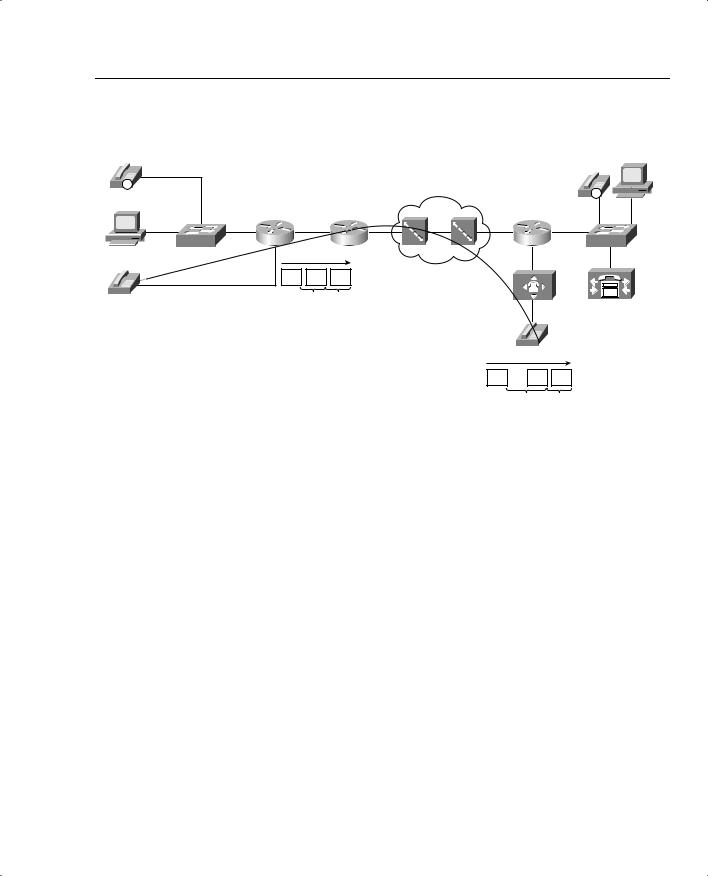
Figure 1-39 lists the queuing, serialization, and propagation delays experienced by data, voice, and video traffic.
Figure 1-39 Delay Components: Three Components, Single Router (R1)
|
|
|
R1 |
|
|||||||
|
|
|
|
|
|
|
|
|
Serialization Delay: 214 ms |
|
|
4 X 1500 |
|
FIFO Output Queue |
|
|
|
||||||
|
|
|
|
|
|
1001101110101011 |
|
||||
Byte Packets |
|
|
4 |
3 |
2 |
1 |
|
||||
|
|
|
|
|
Propagation Delay: 4.8 ms |
R2 |
|||||
|
|
|
|
|
|
|
|
|
|||
|
|
|
|
|
|
|
|
|
|
||
|
|
|
|
|
|
|
|
|
|
|
|
|
|
4th Packet |
|
||||||||
|
|
642 ms Delay |
|
||||||||
70 Chapter 1: QoS Overview
Figure 1-40 depicts LFI operation.
Figure 1-40 Link Fragmentation and Interleaving
|
|
|
|
|
|
|
R1 |
|
|
|
|
|
|
|
|
|
|
|
|
|
Output Queue 1: 3 Fragments |
|
|
|
|
|
|
||||||||||
Packet 1: 1500 |
of Packet #1 Shown |
|
|
|
|
|
|
|
|
|
|
|
||||||
|
P1 |
P1 |
P1 |
|
|
|
|
|
|
|
|
|
|
|
|
|||
Bytes, Arrives |
|
|
|
|
Output Queue 1 |
|
|
|
||||||||||
First |
|
F3 |
F2 |
F1 |
|
|
|
|
P1 |
P1 |
2 |
P1 |
|
|
|
|
||
|
|
Output Queue 2 |
|
|
|
|
|
|
R2 |
|||||||||
|
|
|
|
|||||||||||||||
Packet 2: 200 |
|
|
|
F3 |
F2 |
|
F1 |
|
|
|
||||||||
|
|
|
|
|
|
|
|
|
|
|
|
|
||||||
Bytes, Delay |
|
2 |
|
|
|
|
|
|
|
|
|
|
|
|
||||
|
|
|
|
|
|
|
|
|
|
|
|
|||||||
Sensitive, |
|
|
|
|
|
|
|
|
|
|
|
|
|
|
|
|
|
|
Arrives Second |
|
|
|
|
|
|
|
|
|
|
|
|
|
|
|
|
|
|
Legend: Px Fy Means Packet Number x, Fragment Number y
Although adding more bandwidth always helps, the tools summarized in Table 1-31 do help to improve the effects of delay in a network.
Table 1-31 QoS Tools That Affect Delay
Type of QoS Tool |
How It Affects Delay |
|
|
Queuing |
Enables you to order packets so that delay-sensitive packets leave their |
|
queues more quickly than delay-insensitive packets. |
|
|
Link fragmentation and |
Because routers do not preempt a packet that is currently being transmit- |
interleaving |
ted, LFI breaks larger packets into smaller fragments before sending them. |
|
Smaller delay-sensitive packets can be sent after a single smaller fragment, |
|
instead of having to wait for the larger original packet to be serialized. |
|
|
Compression |
Compresses either payload or headers, reducing overall number of bits |
|
required to transmit the data. By requiring less bandwidth, queues shrink, |
|
which reduces delay. Also serialization delays shrink, because fewer bits |
|
are required. Compression also adds some processing delay. |
|
|
Traffic shaping |
Artificially increases delay to reduce drops inside a Frame Relay or ATM |
|
network. |
|
|
Figure 1-41 shows the jitter experienced by three packets as part of a voice call between phones at extension 301 and 201.
Foundation Summary 71
Figure 1-41 Jitter Example
Server 1
IP |
|
|
|
|
|
|
|
|
|
|
|
|
|
|
|
|
|
|
IP |
Hannah |
|
|
|
|
|
|
|
|
|
|
|
|
|
|
|
|
|
|
FA0 |
SW1 |
R1 |
s0 |
s0 |
R2 |
s1 |
T1 |
s0 |
R3 |
SW2 |
|
|
RTP |
RTP |
RTP |
|
|
|
|
|
201 |
|
|
20 |
20 |
|
|
|
|
|
|
|
|
|
|
|
|
|
|
301
RTP |
RTP |
RTP |
|
30 |
20 |
The same set of tools that affect delay also affect jitter; Table 1-32 lists some of these QoS tools.
Table 1-32 QoS Tools That Affect Jitter
Type of QoS Tool |
How It Affects Jitter |
|
|
Queuing |
Enables you to order packets so that delay-sensitive packets leave their |
|
queues more quickly than delay-insensitive packets. |
|
|
Link fragmentation and |
Because routers do not preempt a packet that is currently being transmit- |
interleaving |
ted, LFI breaks larger packets into smaller fragments before sending them. |
|
Smaller delay-sensitive packets can be sent after a single smaller fragment, |
|
instead of having to wait for the larger original packet to be serialized. |
|
|
Compression |
Compresses either payload or headers, reducing overall number of bits |
|
required to transmit the data. By requiring less bandwidth, queues shrink, |
|
which reduces delay. Also serialization delays shrink, because fewer bits |
|
are required. Compression also adds some processing delay. |
|
|
Traffic shaping |
Artificially increases delay to reduce drops inside a Frame Relay or ATM |
|
network. |
|
|
With a longer maximum queue size, likelihood of loss decreases. However, queuing delay increases, as shown in Figure 1-42.
72 Chapter 1: QoS Overview
Figure 1-42 Queuing Effects on Packet Loss
Single FIFO Queue—
Max Size 50
............
Tail Drop
Queue1—Size 50—
Less Loss, More Latency
............
Queue2—Size 5—
More Loss, Less Latency 


Table 1-33 summarizes the points concerning the two types of QoS tools for affecting loss.
Table 1-33 QoS Tools That Affect Loss
Type of QoS Tool |
Brief Description |
|
|
Queuing |
Implementing longer queues increases delay, but avoids loss. |
|
|
RED |
Implementing RED drops packets randomly as queues approach the point |
|
of being full, slowing some TCP connections. This reduces overall load, |
|
shortening the congested queue, while affecting only some users’ |
|
response times. |
|
|
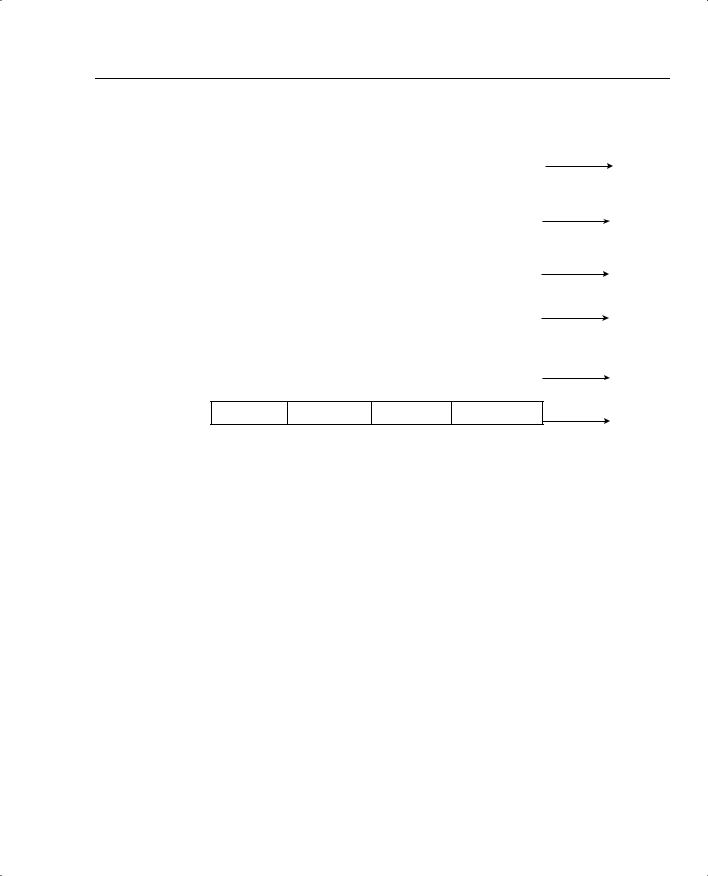
Figure 1-43 outlines the format of an IP packet using RTP.
Figure 1-43 IP Packet for Voice Call—RTP
20 Bytes |
8 Bytes |
12 Bytes |
Variable |
IP |
UDP |
RTP |
Voice Payload |
|
|
|
|
Port Ranges: |
Popular Values: |
16384 - 32767 |
G.711: 160 Bytes |
(Even Ports) |
G729a: 20 Bytes |

Foundation Summary 73
Table 1-34 contrasts the QoS requirements of voice payload and signaling flows.
Table 1-34 Comparing Voice Payload to Voice Signaling: QoS Requirements
|
Bandwidth |
Delay |
Jitter |
Loss |
|
|
|
|
|
Voice Payload |
Low |
Low |
Low |
Low |
|
|
|
|
|
Video Signaling |
Low |
Low |
Medium |
Medium |
|
|
|
|
|
Table 1-35 lists the bandwidth requirements for various types of voice calls, as listed in the DQOS course.
Table 1-35 Bandwidth Requirements with Various Data-Link Types
L2 Header |
L2 |
IP/UDP/RTP |
|
Payload |
Total |
Type |
Header Size |
Header Size |
Codec |
Bandwidth |
Bandwidth |
|
|
|
|
|
|
Ethernet |
14 |
40 bytes |
G.711 |
64 kbps |
85.6 |
|
|
|
|
|
|
MLPPP/FR |
6 |
40 bytes |
G.711 |
64 kbps |
82.4 |
|
|
|
|
|
|
Ethernet |
14 |
40 bytes |
G.729 |
8 kbps |
29.6 |
|
|
|
|
|
|
MLPPP/FR |
6 |
40 bytes |
G.729 |
8 kbps |
26.4 |
|
|
|
|
|
|
The delay components that affect all types of traffic are listed in Table 1-36.
Table 1-36 Components of Delay Not Specific to One Type of Traffic
Delay Component |
Definition |
Where It Occurs |
|
|
|
Serialization delay |
Time taken to place all bits of a frame |
Outbound on every physical inter- |
|
onto the physical medium. Function of |
face; typically negligible on T3 and |
|
frame size and physical link speed. |
faster links. |
|
|
|
Propagation delay |
Time taken for a single bit to traverse |
Every physical link. Typically negli- |
|
the physical medium from one end to |
gible on LAN links and shorter WAN |
|
the other. Based on the speed of light |
links. |
|
over that medium, and the length of |
|
|
the link. |
|
|
|
|
Queuing delay |
Time spent in a queue awaiting the |
Possible on every output interface. |
|
opportunity to be forwarded (output |
Input queuing unlikely in routers, |
|
queuing), or awaiting a chance to cross |
more likely in LAN switches. |
|
the switch fabric (input queuing). |
|
|
|
|
Forwarding or |
Time required from receipt of the |
On every piece of switching equip- |
Processing Delay |
incoming frame, until the frame/ |
ment, including routers, LAN |
|
packet has been enqueued for |
switches, Frame Relay switches, and |
|
transmission. |
ATM switches. |
|
|
|
continues
74 Chapter 1: QoS Overview
Table 1-36 Components of Delay Not Specific to One Type of Traffic (Continued)
Delay Component |
Definition |
Where It Occurs |
|
|
|
Shaping delay |
Shaping (if configured) delays |
Anywhere that shaping is configured, |
|
transmission of packets to avoid |
which is most likely on a router, |
|
packet loss in the middle of a Frame |
when sending packets to a Frame |
|
Relay or ATM network. |
Relay or ATM network. |
|
|
|
Network delay |
Delays created by the components of |
Inside the service provider’s network. |
|
the carrier’s network when using a |
|
|
service. For instance, the delay of a |
|
|
Frame Relay frame as it traverses the |
|
|
Frame Relay network. |
|
|
|
|
Figure 1-44 shows an example of delay concepts, with sample delay values shown. When the delay is negligible, the delay is just listed as zero.
Figure 1-44 Example Network with Various Delay Components shown: Left-to-Right Direction
Delays for Packets Flowing Left-to-Right: Total Delay: 94 ms
Forwarding: 0 |
Forwarding: 0 |
Queuing: 0 |
Queuing: 15 |
Serialization: 0 |
Serialization: 4 |
|
Propagation: .5 |
IP
Hannah
|
|
|
|
|
|
|
|
|
|
|
|
|
|
|
|
|
|
|
|
|
|
|
|
|
|
|
|
|
|
|
|
SW1 |
R1 s0 s0 R2 s1 |
|
|
|
|
|
|
|
|
|
|
|
|||
|
|
|
|
|
|
|
|||||
|
|
|
|
|
|
|
|
|
|
|
|
|
|
|
|
|
|
|
|
|
|
|
|
|
|
|
|
|
|
|
|
|
|
|
|
|
|
|
|
|
|
|
|
|
|
|
|
Forwarding: 0
Queuing: 0
Serialization: 0 Server 1
Propagation: 0
|
|
|
IP |
|
|
|
FA0/0 |
T1 |
s0/0 |
R3 |
SW2 |
201
Forwarding: 0 |
Network: 50 |
|
|
|
Queuing: 15 |
(Note: Do Not Count |
|
|
|
Serialization: 9 |
R2 Serialization Here |
|
|
|
|
|
|
||
|
|
|
||
|
|
|
||
Propagation: .5 |
and at R2!) |
|
|
|
|
|
|
301
Table 1-37 outlines the suggested delay budgets.
|
|
Foundation Summary 75 |
|
|
|
Table 1-37 One-Way Delay Budget Guidelines |
||
|
|
|
|
1-Way Delay (in ms) |
Description |
|
|
|
|
0–150 |
ITU G.114 recommended acceptable range |
|
|
|
|
0–200 |
Cisco’s recommended acceptable range |
|
|
|
|
150–400 |
ITU G.114’s recommended range for degraded service |
|
|
|
|
400+ |
ITU G.114’s range of unacceptable delay in all cases |
|
|
|
All the delay components for a voice call are summarized in the example in Figure 1-45.
Figure 1-45 Complete End-to-End Voice Delay Example
Delays for Packets Flowing Left-to-Right: Total Delay: 164 ms
Forwarding: 0 |
Forwarding: 0 |
Queuing: 0 |
Queuing: 15 |
Serialization: 0 |
Serialization: 4 |
|
Propagation: .5 |
IP |
|
|
|
|
|
Hannah |
|
|
|
|
|
SW1 |
R1 |
s0 |
s0 |
R2 |
s1 |
201 |
Forwarding: 0 |
|
|
|
|
|
|
|
|
||
Codec: 10 |
Queuing: 15 |
|
|
|
|
Serialization: 9 |
|
|
|
||
Packetization: 20 |
|
|
|
||
Propagation: .5 |
|
|
|||
|
|
|
|||
Forwarding: 0 De-jitter: 40 ms |
|
Queuing: 0 |
Server 1 |
Serialization: 0 |
|
Propagation: 0 |
|
|
|
|
IP |
|
|
|
FA0/0 |
T1 |
s0/0 |
R3 |
SW2 |
|
|
|
|
|
|
|
|
|
|
|
|
|
|
|
|
|
|
|
|
|
|
|
|
|
|
|
Network: 50 |
|
De-jitter: 40 ms |
||||||
(Note: Do Not Count |
|
|
|
|
|
|||
R2 Serialization Here |
|
|
|
|
|
|||
|
|
|
|
|
||||
and at R2!) |
|
|
|
|
|
|
|
|
|
|
|
|
|
|
|
||
|
|
|
|
|
|
|
||
301
Table 1-38 lists the different delay components and whether they are variable.
Table 1-38 Delay Components, Variable and Fixed
Delay |
Fixed or |
|
QoS Tools |
Component |
Variable |
Comments |
That Can Help |
|
|
|
|
Codec |
Fixed |
Varies slightly based on codec and processing |
None. |
|
|
load; considered fixed in course books (and |
|
|
|
probably on exams). Typically around 10 ms. |
|
|
|
|
|
continues

76 Chapter 1: QoS Overview
Table 1-38 Delay Components, Variable and Fixed (Continued)
Delay |
Fixed or |
|
QoS Tools |
Component |
Variable |
Comments |
That Can Help |
|
|
|
|
Packetization |
Fixed |
Some codecs require a 30-ms payload, but |
None. |
|
|
packetization delay does not vary for a single |
|
|
|
codec. Typically 20 ms, including when using |
|
|
|
G.711 and G.729. |
|
|
|
|
|
Propagation |
Variable |
Varies based on length of circuit. About 5 ms/ |
Move your facilities to |
|
|
100 km. |
the same town. |
|
|
|
|
Queuing |
Variable |
This is the most controllable delay component |
Queuing features, |
|
|
for packet voice. |
particularly those with |
|
|
|
a priority-queuing |
|
|
|
feature. |
|
|
|
|
Serialization |
Fixed |
It is fixed for voice packets, because all voice |
Fragmentation and |
|
|
packets are of equal length. It is variable based |
compression. |
|
|
on packet size for all packets. |
|
|
|
|
|
Network |
Variable |
Least controllable variable component. |
Shaping, |
|
|
|
fragmentation, designs |
|
|
|
mindful of reducing |
|
|
|
delay. |
|
|
|
|
De-jitter buffer |
Variable |
This component is variable because it can be |
Configurable playout |
(initial playout |
|
configured for a different value. However, that |
delay in IOS gateways; |
delay) |
|
value, once configured, remains fixed for all |
not configurable in IP |
|
|
calls until another value is configured. In other |
Phones. |
|
|
words, the initial playout delay does not |
|
|
|
dynamically vary. |
|
|
|
|
|
Figure 1-46 shows an example of jitter for packets 3 and 4.
Foundation Summary 77
Figure 1-46 De-Jitter Buffer Underrun Due to Jitter
T=X – Instant
That First
Packet Has
Been Received
T=X+20 – Instant
That Second
Packet Has Been
Received, NO
JITTER
T=X+40 – 3rd
Packet Not
Received Yet
T=X+60 – 3rd
Packet Received;
Had +20 Jitter
T=X+80 – 4th
Packet Still Has
Not Arrived
T=X+100 – 4th Packet Still Has Not Arrived; More Than 20 ms Jitter
De-Jitter Buffer
|
|
|
|
|
20 ms Voice Payload |
|
|
|
|
|
– Packet 1 |
|
|
|
|
|
|
|
|
|
|
De-Jitter Buffer |
|
|
|
|
|
|
|
|
|
|
|
20 ms Voice Payload |
20 ms Voice Payload |
|
|
|
|
– Packet 2 |
– Packet 1 |
|
|
|
|
|
|
|
|
|
|
De-Jitter Buffer |
|
|
|
|
|
|
|
|
|
|
|
|
20 ms Voice Payload |
|
|
|
|
|
– Packet 2 |
|
|
|
|
|
|
|
|
|
|
De-Jitter Buffer |
|
|
|
|
|
|
|
|
|
|
|
|
20 ms Voice Payload |
|
|
|
|
|
– Packet 3 |
|
|
|
|
|
|
|
|
|
|
De-Jitter Buffer |
|
|
|
|
|
|
|
|
|
|
|
|
|
|
|
|
|
De-Jitter Buffer |
|
No Playout of Voice
No Playout of Voice
Playing out Packet 1
Playing out Packet 2
Playing out Packet 3; De-Jitter Buffer Empty
Nothing Left to Play out; Listener Hears Nothing
Table 1-39 summarizes some of the key bandwidth differences between voice and video traffic.
Table 1-39 Voice and Video Bandwidth Contrasted
Feature |
Voice |
Video |
|
|
|
Number of flows in each direction |
1 |
2 (1 audio, 1 video) |
|
|
|
Packet sizes |
Static, based on codec |
Variable |
|
|
|
Packet rate |
Constant (isochronous) |
Variable |
|
|
|
Table 1-40 summarizes some of the key bandwidth differences between all three types of traffic.
Table 1-40 Voice, Video, and Data Bandwidth Contrasted
Feature |
Voice |
2-Way Video |
Data |
|
|
|
|
Number of flows |
2 (1 in each direction) |
4 (1 audio and 1 video in |
1 bidirectional flow |
|
|
each direction) |
|
|
|
|
|
Packet sizes |
Fixed, based on codec |
Variable |
Varies greatly |
|
|
|
|
Packet rate |
Constant (isochronous) |
Variable |
Varies greatly |
|
|
|
|

78 Chapter 1: QoS Overview
Two factors affect the delay requirements of a data application. Table 1-41 lists these requirements.
Table 1-41 Factors to Consider for Data Delay
Factor |
Mission Critical |
Not Mission Critical |
|
|
|
Interactive |
Should get the lowest delay of all data appli- |
Applications could benefit from |
|
cations. Most shops strive for 1–2-second |
lower delay. Also differentiating |
|
application response time—per-packet delay |
between mission critical and not |
|
must be shorter. |
mission critical can be difficult. |
|
|
|
Not interactive |
Although mission critical, noninteractive |
Best candidate for getting any |
|
applications typically need particular |
leftover bandwidth, with all other |
|
bandwidth requirements met, delay can vary |
voice, video, and data applications |
|
greatly as long as bandwidth is supplied. |
getting better QoS treatment. |
|
|
|
Table 1-42 summarizes the QoS requirements of data, in comparison to voice and video.
Table 1-42 Comparing Voice, Video, and Data QoS Requirements
|
Bandwidth |
Delay |
Jitter |
Loss |
|
|
|
|
|
Voice Payload |
Low |
Low |
Low |
Low |
|
|
|
|
|
Video Payload— |
High |
Low |
Low |
Low |
Interactive |
|
|
|
|
(2-Way) |
|
|
|
|
|
|
|
|
|
Video Payload— |
High |
High |
High |
Low |
Streaming |
|
|
|
|
(1-Way) |
|
|
|
|
|
|
|
|
|
Video Signaling |
Low |
Low |
Medium |
Medium |
|
|
|
|
|
Voice Signaling |
Low |
Low |
Medium |
Medium |
|
|
|
|
|
Data: |
Variable, typical |
Medium |
Medium |
Medium |
Interactive, |
medium |
|
|
|
Mission Critical |
|
|
|
|
|
|
|
|
|
Data: Not |
Variable, typically |
High |
High |
Medium |
Interactive, |
high |
|
|
|
Mission Critical |
|
|
|
|
|
|
|
|
|
Data: |
Variable, typical |
High |
High |
Medium |
Interactive, Not |
medium |
|
|
|
Critical |
|
|
|
|
|
|
|
|
|
Data: Not |
Variable, typically |
High |
High |
High |
Interactive, Not |
high |
|
|
|
Critical |
|
|
|
|
|
|
|
|
|

Q&A 79
Q&A
As mentioned in the Introduction, you have two choices for review questions. The questions that follow next give you a more difficult challenge than the exam itself by using an open-ended question format. By reviewing now with this more difficult question format, you can exercise your memory better, and prove your conceptual and factual knowledge of this chapter. You can find the answers to these questions in Appendix A.
The second option for practice questions is to use the CD-ROM included with this book. It includes a testing engine and more than 200 multiple-choice questions. You should use this CD-ROM nearer to the end of your preparation, for practice with the actual exam format. You can even customize the CD-ROM exam to include, or not include, the topics that are only on the CCIP QoS.
1List the four traffic characteristics that QoS tools can affect.
2Describe some of the characteristics of voice traffic when no QoS is applied in a network.
3Describe some of the characteristics of video traffic when no QoS is applied in a network.
4Describe some of the characteristics of data traffic when no QoS is applied in a network.
5Interpret the meaning of the phrase, “QoS is both ‘managed fairness,’ and at the same time ‘managed unfairness’.”
6Define bandwidth. Compare and contrast bandwidth concepts over point-to-point links versus Frame Relay.
7Compare and contrast bandwidth and clock rate in relation to usage for QoS.
8List the QoS tool types that affect bandwidth, and give a brief explanation of why each tool can affect bandwidth.
9Define delay, compare/contrast one-way and round-trip delay, and characterize the types of packets for which one-way delay is important.
10List the categories of delay that could be experienced by all three types of traffic: data, voice, and video.
11Define, compare, and contrast serialization and propagation delay.
12Define network delay.
13List the QoS tool types that affect delay and give a brief explanation of why each tool can affect delay.
14Define jitter. Give an example that shows a packet without jitter, followed by a packet with jitter.

80 Chapter 1: QoS Overview
15List the QoS tool types that affect jitter and give a brief explanation of why each tool can affect jitter.
16Define packet loss and describe the primary reason for loss for which QoS tools can help.
17List the QoS tool types that affect loss and give a brief explanation of why each tool can affect loss.
18Describe the contents of an IP packet carrying the payload for a G.729 VoIP call.
19Describe the amount of bandwidth required for G.711 and G.729 VoIP calls, ignoring data-link header/trailer overhead.
20List the delay components that voice calls experience, but which data-only flows do not experience.
21Define the meaning of the term “packetization delay” in relation to a voice call.
22List the different one-way delay budgets as suggested by Cisco and the ITU.
23Define the term “codec delay” and discuss the two components when using a G.729 codec.
24Describe the affects of a single lost packet versus two consecutive lost packets, for a G.729 voice call.
25Describe a typical video payload flow in terms of packet sizes and packet rates.
26Discuss the delay requirements of video traffic.
27List the basic differences between TCP and UDP traffic.
28Contrast the QoS characteristics needed by interactive data applications, as compared to the QoS needs of voice payload flows.


This chapter covers the following exam topics specific to the DQOS and QoS exams:
DQOS Exam Topics
•Correctly describe the QoS framework.
•Describe the differences between integrated services and differentiated services.
QoS Exam Objectives
•Describe the Integrated Services model
•List the key benefits and drawbacks of the IntServ model
•Describe the Differentiated Services model
•List the key benefits of the DiffServ model compared to the IntServ model
•Describe the building blocks of IP QoS mechanisms (classification, marking, metering, policing, shaping, dropping, forwarding, queuing)
•List the IP QoS mechanisms available in the Cisco IOS
•Describe what QoS features are supported by different IP QoS mechanisms
•Describe the interoperability between DSCP-based and IP-precedence based devices in a network