

- •About the Authors
- •Dedication
- •Authors’ Acknowledgments
- •Table of Contents
- •Introduction
- •What’s Not (And What Is) in This Book
- •Mac attack!
- •Who Do We Think You Are?
- •How This Book Is Organized
- •Part I: AutoCAD 101
- •Part II: Let There Be Lines
- •Part III: If Drawings Could Talk
- •Part IV: Advancing with AutoCAD
- •Part V: On a 3D Spree
- •Part VI: The Part of Tens
- •But wait . . . there’s more!
- •Icons Used in This Book
- •A Few Conventions — Just in Case
- •Commanding from the keyboard
- •Tying things up with the Ribbon
- •Where to Go from Here
- •Why AutoCAD?
- •The Importance of Being DWG
- •Seeing the LT
- •Checking System Requirements
- •Suddenly, It’s 2013!
- •AutoCAD Does Windows (And Office)
- •And They’re Off: AutoCAD’s Opening Screens
- •Running with Ribbons
- •Getting with the Program
- •Looking for Mr. Status Bar
- •Let your fingers do the talking: The command window
- •The key(board) to AutoCAD success
- •Keeping tabs on palettes
- •Down the main stretch: The drawing area
- •Fun with F1
- •A Simple Setup
- •Drawing a (Base) Plate
- •Drawing rectangles on the right layers
- •Circling your plate
- •Nuts to you
- •Getting a Closer Look with Zoom and Pan
- •Modifying to Make It Merrier
- •Hip-hip-array!
- •Stretching out
- •Crossing your hatches
- •Following the Plot
- •A Setup Roadmap
- •Choosing your units
- •Weighing up your scales
- •Thinking annotatively
- •Thinking about paper
- •Defending your border
- •A Template for Success
- •Making the Most of Model Space
- •Setting your units
- •Making the drawing area snap-py (and grid-dy)
- •Setting linetype and dimension scales
- •Entering drawing properties
- •Making Templates Your Own
- •Setting Up a Layout in Paper Space
- •Will that be tabs or buttons?
- •View layouts Quick(View)ly
- •Creating a layout
- •Copying and changing layouts
- •Lost in paper space
- •Spaced out
- •A view(port) for drawing in
- •About Paper Space Layouts and Plotting
- •Managing Your Properties
- •Layer one on me!
- •Accumulating properties
- •Creating new layers
- •Manipulating layers
- •Using Named Objects
- •Using AutoCAD DesignCenter
- •Copying layers between drawings
- •Controlling Your Precision
- •Keyboard capers: Coordinate input
- •Understanding AutoCAD’s coordinate systems
- •Grab an object and make it snappy
- •Other Practical Precision Procedures
- •Introducing the AutoCAD Drawing Commands
- •The Straight and Narrow: Lines, Polylines, and Polygons
- •Toeing the line
- •Connecting the lines with polyline
- •Squaring off with rectangles
- •Choosing your sides with polygon
- •(Throwing) Curves
- •Going full circle
- •Arc-y-ology
- •Solar ellipses
- •Splines: The sketchy, sinuous curves
- •Donuts: The circles with a difference
- •Revision clouds on the horizon
- •Scoring Points
- •Commanding and Selecting
- •Command-first editing
- •Selection-first editing
- •Direct object manipulation
- •Choosing an editing style
- •Grab It
- •One-by-one selection
- •Selection boxes left and right
- •Perfecting Selecting
- •AutoCAD Groupies
- •Object Selection: Now You See It . . .
- •Get a Grip
- •About grips
- •A gripping example
- •Move it!
- •Copy, or a kinder, gentler Move
- •A warm-up stretch
- •Your AutoCAD Toolkit
- •The Big Three: Move, Copy, and Stretch
- •Base points and displacements
- •Move
- •Copy
- •Copy between drawings
- •Stretch
- •More Manipulations
- •Mirror
- •Rotate
- •Scale
- •Array
- •Offset
- •Slicing, Dicing, and Splicing
- •Trim and Extend
- •Break
- •Fillet and Chamfer and Blend
- •Join
- •When Editing Goes Bad
- •Zoom and Pan with Glass and Hand
- •The wheel deal
- •Navigating your drawing
- •Controlling your cube
- •Time to zoom
- •A View by Any Other Name . . .
- •Looking Around in Layout Land
- •Degenerating and Regenerating
- •Getting Ready to Write
- •Simply stylish text
- •Taking your text to new heights
- •One line or two?
- •Your text will be justified
- •Using the Same Old Line
- •Turning On Your Annotative Objects
- •Saying More in Multiline Text
- •Making it with Mtext
- •It slices; it dices . . .
- •Doing a number on your Mtext lists
- •Line up in columns — now!
- •Modifying Mtext
- •Gather Round the Tables
- •Tables have style, too
- •Creating and editing tables
- •Take Me to Your Leader
- •Electing a leader
- •Multi options for multileaders
- •How Do You Measure Up?
- •A Field Guide to Dimensions
- •The lazy drafter jumps over to the quick dimension commands
- •Dimension associativity
- •Where, oh where, do my dimensions go?
- •The Latest Styles in Dimensioning
- •Creating and managing dimension styles
- •Let’s get stylish!
- •Adjusting style settings
- •Size Matters
- •Details at other scales
- •Editing Dimensions
- •Editing dimension geometry
- •Editing dimension text
- •Controlling and editing dimension associativity
- •Batten Down the Hatches!
- •Don’t Count Your Hatches. . .
- •Size Matters!
- •We can do this the hard way. . .
- •. . . or we can do this the easy way
- •Annotative versus non-annotative
- •Pushing the Boundary (Of) Hatch
- •Your hatching has no style!
- •Hatch from scratch
- •Editing Hatch Objects
- •You Say Printing, We Say Plotting
- •The Plot Quickens
- •Plotting success in 16 steps
- •Get with the system
- •Configure it out
- •Preview one, two
- •Instead of fit, scale it
- •Plotting the Layout of the Land
- •Plotting Lineweights and Colors
- •Plotting with style
- •Plotting through thick and thin
- •Plotting in color
- •It’s a (Page) Setup!
- •Continuing the Plot Dialog
- •The Plot Sickens
- •Rocking with Blocks
- •Creating Block Definitions
- •Inserting Blocks
- •Attributes: Fill-in-the-Blank Blocks
- •Creating attribute definitions
- •Defining blocks that contain attribute definitions
- •Inserting blocks that contain attribute definitions
- •Edit attribute values
- •Extracting data
- •Exploding Blocks
- •Purging Unused Block Definitions
- •Arraying Associatively
- •Comparing the old and new ARRAY commands
- •Hip, hip, array!
- •Associatively editing
- •Going External
- •Becoming attached to your xrefs
- •Layer-palooza
- •Creating and editing an external reference file
- •Forging an xref path
- •Managing xrefs
- •Blocks, Xrefs, and Drawing Organization
- •Mastering the Raster
- •Attaching a raster image
- •Maintaining your image
- •Theme and Variations: Dynamic Blocks
- •Lights! Parameters!! Actions!!!
- •Manipulating dynamic blocks
- •Maintaining Design Intent
- •Defining terms
- •Forget about drawing with precision!
- •Constrain yourself
- •Understanding Geometric Constraints
- •Applying a little more constraint
- •AutoConstrain yourself!
- •Understanding Dimensional Constraints
- •Practice a little constraint
- •Making your drawing even smarter
- •Using the Parameters Manager
- •Dimensions or constraints — have it both ways!
- •The Internet and AutoCAD: An Overview
- •You send me
- •Send it with eTransmit
- •Rapid eTransmit
- •Bad reception?
- •Help from the Reference Manager
- •Design Web Format — Not Just for the Web
- •All about DWF and DWFx
- •Autodesk Design Review 2013
- •The Drawing Protection Racket
- •Autodesk Weather Forecast: Increasing Cloud
- •Working Solidly in the Cloud
- •Free AutoCAD!
- •Going once, going twice, going 123D
- •Your head planted firmly in the cloud
- •The pros
- •The cons
- •Cloudy with a shower of DWGs
- •AutoCAD 2013 cloud connectivity
- •Tomorrow’s Forecast
- •Understanding 3D Digital Models
- •Tools of the Trade
- •Warp speed ahead
- •Entering the third dimension
- •Untying the Ribbon and opening some palettes
- •Modeling from Above
- •Using 3D coordinate input
- •Using point filters
- •Object snaps and object snap tracking
- •Changing Planes
- •Displaying the UCS icon
- •Adjusting the UCS
- •Navigating the 3D Waters
- •Orbit à go-go
- •Taking a spin around the cube
- •Grabbing the SteeringWheels
- •Visualizing 3D Objects
- •Getting Your 3D Bearings
- •Creating a better 3D template
- •Seeing the world from new viewpoints
- •From Drawing to Modeling in 3D
- •Drawing basic 3D objects
- •Gaining a solid foundation
- •Drawing solid primitives
- •Adding the Third Dimension to 2D Objects
- •Creating 3D objects from 2D drawings
- •Modifying 3D Objects
- •Selecting subobjects
- •Working with gizmos
- •More 3D variants of 2D commands
- •Editing solids
- •Get the 2D Out of Here!
- •A different point of view
- •But wait! There’s more!
- •But wait! There’s less!
- •Do You See What I See?
- •Visualizing the Digital World
- •Adding Lighting
- •Default lighting
- •User-defined lights
- •Sunlight
- •Creating and Applying Materials
- •Defining a Background
- •Rendering a 3D Model
- •Autodesk Feedback Community
- •Autodesk Discussion Groups
- •Autodesk’s Own Bloggers
- •Autodesk University
- •The Autodesk Channel on YouTube
- •The World Wide (CAD) Web
- •Your Local ATC
- •Your Local User Group
- •AUGI
- •Books
- •Price
- •3D Abilities
- •Customization Options
- •Network Licensing
- •Express Tools
- •Parametrics
- •Standards Checking
- •Data Extraction
- •MLINE versus DLINE
- •Profiles
- •Reference Manager
- •And The Good News Is . . .
- •APERTURE
- •DIMASSOC
- •MENUBAR
- •MIRRTEXT
- •OSNAPZ
- •PICKBOX
- •REMEMBERFOLDERS
- •ROLLOVERTIPS
- •TOOLTIPS
- •VISRETAIN
- •And the Bonus Round
- •Index
350 Part III: If Drawings Could Talk
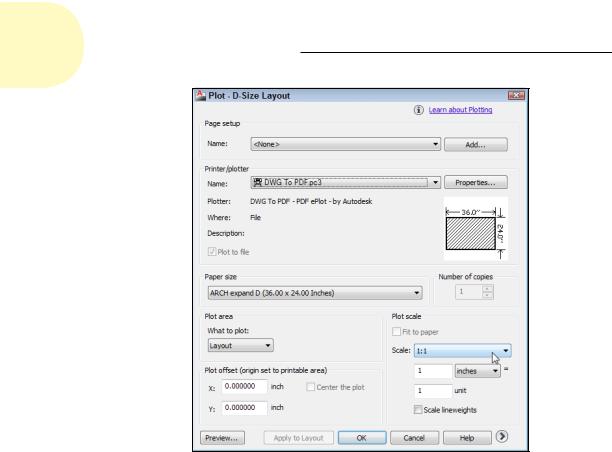
Figure 16-6: Settings for plotting a paper space layout.
9.Click the Preview button, ensure that the drawing displays on the paper at the correct orientation and size, right-click, and choose Exit from the menu that appears to return to the Plot dialog box.
If you found any problems in the preview, change your plot settings and preview again until it looks right.
10.Click OK to create the plot.
Plotting Lineweights and Colors
In previous sections of this chapter, we help you gain some plotting confidence. Those sections show you how to create scaled, monochrome plots with uniform lineweights in model space or paper space. Those skills may be all you need, but if you care about controlling plotted lineweights and colors or adding special effects such as screening (plotting shades of gray), read on.
www.it-ebooks.info
Chapter 16: The Plot Thickens 351
Plotting with style
Plot styles provide a way to override object properties with alternative plot properties. (See Chapter 6 for information about object properties.) The properties include plotted lineweight, plotted color, and screening. Figure 16-7 shows the full range of options. Plot styles come in two exciting flavors:
Color-dependent plot styles
Named plot styles
Color-dependent plot styles are based on the standard way of plotting in earlier versions of AutoCAD (before AutoCAD 2000), whereas named plot styles provide a newer (but not necessarily better) way.
Figure 16-7: Editing a color-dependent plot style table.
www.it-ebooks.info
352 Part III: If Drawings Could Talk
It’s remotely possible that you won’t need to bother with plot styles. If the drawings you want to plot have layer and object properties (especially lineweights) that reflect how you want objects to plot, you can dispense with plot styles. But most people and most drawings use plot styles, so you should at least be familiar with them.
A couple of common reasons for using plot styles are to
Map screen colors to plotted lineweights. If this idea seems completely loony to you, try to suspend judgment until you read the “Plotting through thick and thin” section, a bit later in this chapter.
Create screened lines on monochrome plots. Lines that are screened display in various shades of gray, not black. Drafters sometimes use screened lines to de-emphasize secondary objects that otherwise would overwhelm the main objects in the drawing. Screening is expressed as a percentage, with 100 percent being completely black and 0 percent being invisible. For example, on a subdivision layout, you might want to de-emphasize all the property and house outlines except one.
Using plot styles
If you want objects in your drawing to plot with properties that differ from their display properties, you need plot styles. For example, you can plot with different lineweights or colors from the ones you’re using for display purposes. Or, as we mention in the preceding section, you may need to map display colors to plotted lineweights. AutoCAD groups plot styles into plot style tables, each of which is stored in a separate file.
Color-based plot styles live in color-dependent plot style table (CTB) files, and they map the 255 AutoCAD display colors to 255 plot styles. AutoCAD automatically attaches the color-dependent plot styles to every object, based on (you guessed it)the object’s color. (Are those AutoCAD programmers brilliant, or what?) Color-dependent plot style tables mimic the old color-
mapped-to-lineweight plotting approach of AutoCAD R14 and earlier releases; this remains the most common method in most companies.
Named plot styles were introduced in AutoCAD 2000, and are object properties, just like color, linetype, and lineweight. Named plot styles live in (wouldn’t you know it?) named plot style table (STB) files. After you create a named plot style table, you create one or more plot styles and give them any names you like. Then you can assign the named plot styles to layers or to individual objects. (See Chapter 6 for more information about object and layer properties.)
To use the plot styles in a plot style table (whether they’re color-dependent or named), you must attach the plot style table to model space or a paper
www.it-ebooks.info
Chapter 16: The Plot Thickens 353
space layout. The attached plot style table affects plotting only for that layout or for model space. This approach lets you plot the same drawing in different ways by attaching different plot styles to different tabs.
You can attach a plot style to model space or a paper space layout by selecting its image in the Quick View Layouts panel and opening the Plot dialog box; or, by right-clicking an image, choosing Page Setup Manager, and then clicking the Modify button. Choose the plot style table name from the Plot Style Table (Pen Assignments) area of the expanded Page Setup or Plot dialog box. See the section “Controlling plotted lineweights with screen colors,” later in this chapter, for an example.
When you start a new drawing in the usual way — that is, by using a template drawing (see Chapter 4) — the template drawing’s plot style behavior determines whether you can choose CTB or STB files. If you want to change from color-dependent plot styles to named plot styles (or vice versa) in a particular drawing, use the CONVERTPSTYLES command.
Creating plot styles
If you’re lucky, someone will provide you with the plot files you need. If that’s the case, you must put the CTB or STB files in your Plot Styles folder for AutoCAD to recognize them. (To find the location of your Plot Styles folder, open the Options dialog box, choose the Files tab, and look for the Printer Support File Path Plot Style Table Search Path setting.)
If you’re not lucky, you’ll need to be smart — that is, you’ll want to know how to create your own plot style table files. (Personally, we’d rather be lucky than smart; hey, it’s worked so far in life!) Here’s how to create plot style table files:
1.Click the Application button to open the Application Menu, choose Print, and then choose Manage Plot Styles.
Use the tiny down arrow at the bottom of the list to scroll farther down if necessary. The Plot Styles folder opens in a separate Windows Explorer window.
2.Double-click the Add-a-Plot Style Table Wizard program shortcut.
3.Read the opening screen and then click Next.
4.On the Add Plot Style Table – Begin page, choose the Start from Scratch option or one of the other three options if you want to start with settings from another file. Then click Next.
The remaining steps in this procedure assume that you chose Start from Scratch. If you chose another option, simply follow the wizard’s prompts.
www.it-ebooks.info
354 Part III: If Drawings Could Talk
If the creator of a drawing provides you with an AutoCAD R14/AutoCAD LT 98 PC2 (version 2) or AutoCAD R12/AutoCAD LT 95 PCP (version 1) file, choose the Use a PCP or PC2 File option. With this option, the wizard imports color-to-plotted-lineweight settings automatically.
5.On the Add Plot Style Table – Pick Plot Style Table page, choose whether you want to create a color-dependent plot style table (CTB file) or a named plot style table (STB file). Then click Next.
Choose Color-Dependent Plot Style Table to map screen colors to plotted lineweights. Choose Named Plot Style Table to create named plot styles that you can apply to layers or objects.
6.On the Add Plot Style Table – File Name page, type a name for the new CTB or STB file and then click Next.
7.Click the Plot Style Table Editor button on the Add Plot Style Table – Finish page.
The Plot Style Table Editor dialog box opens to the Form View tab if you’re creating a color-dependent plot style table (refer to Figure 16-7), or to the Table View tab if you create a named plot style table.
If you choose a named plot style in Step 5, the Plot Style Table Editor dialog box opens in Table view, with one plot style named Normal in the first data column, a blank column to its right, and Add Style and Delete Style buttons at the bottom. New named plot styles that you create continue to be added in columns to the right of the previous column. For more information, click the Help button in the Plot Style Table Editor.
8.If you created a color-dependent plot style table, assign Lineweight, Screening, or other plot properties to each color that’s used in the drawing. If you created a named plot style table, click the Add Style button and then assign plot properties to each of the named styles that you create.
To determine which colors are used in a drawing, switch to the AutoCAD window and open the Layer Properties Manager palette by clicking the Layer Properties button located on the Layers panel of the Ribbon’s Home tab.
To change a setting for all colors or named styles, select them all first by clicking the first color or named style, holding down the Shift key, scrolling to the end of the list, and then clicking the last color or named style. Any subsequent changes you make get applied to all the selected colors or named styles.
9.Click the Save & Close button to close the Plot Style Table Editor dialog box. Then click Finish to complete the steps for the wizard.
The Plot Styles folder now displays your new CTB or STB file.
10.Close the Plot Styles folder by clicking the X in its title bar.
www.it-ebooks.info