

248 • Chapter 7 • Dynamics: Competing Across Time
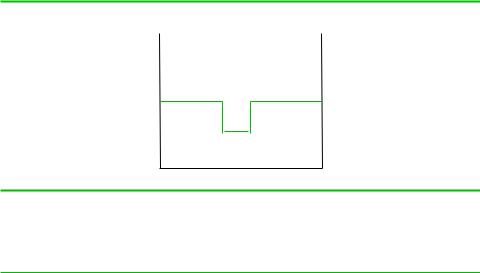
FIGURE 7.4
Delivered Pricing
Price |
Price |
||
Delivered price |
|
Delivered price |
|
of Ahmadabad |
|
of Mumbai |
|
producer |
|
producer |
|
|
|
|
|
Ahmadabad Surat Mumbai
When both firms use delivered pricing, a firm’s customer pays the same delivered price, no matter what its location. If the Mumbai firm cuts its delivered price to steal business in Surat, the Ahmadabad producer need only cut its delivered price in Surat to retaliate.
WHERE DOES MARKET STRUCTURE COME FROM?
With the exception of discussion of entry in Chapter 6, our exploration of competition has largely taken market structure as given. But there are reasons why different markets have different structures. Understanding these reasons helps managers anticipate how markets may evolve, or what we call the macrodynamics of the market. In this section, we explore the reasons why markets look the way they do.
Simple microeconomic theory provides a good starting point for explaining differences in market structure. Recall from the Economics Primer and Chapter 2 that production processes often display U-shaped average total costs. In other words, there is a specific level of output for each firm that minimizes costs. This level of output is called the minimum efficient scale (MES), which we denoted in the Primer by q**. Recall that the MES is larger when the sunk upfront costs of establishing the production facility are large relative to ongoing variable costs of production. Let the average total cost at the MES be AC(q**). Finally, suppose that the level of industry demand when price equals AC(q**) is Q**.
Microeconomic theory predicts that if the firms in this example behave competitively, there will be N* 5 Q**/q** equal-sized firms in the market, each selling q** units. Simply put, the number of firms depends on the total size of the market relative to the MES of production. The basic theory goes a long way toward explaining variation in market structure over time, across industries, and across geographic areas. In a famous study, John Blair argued that technological change in the industrial revolution increased the MES of production and that this was largely responsible for the longterm trend of increasing concentration in many sectors of the economy.32
Looking at the cross section of industries today, we see that high sunk costs associated with research and manufacturing have led to high concentration in commercial airframe manufacturing, while large purchasing and distribution economies limit the number of mass merchandiser chains in any given metropolitan area. By examining different geographic markets within the same industry, we can also confirm that concentration is linked to market size. For example, there are at least five different

Sutton’s Endogenous Sunk Costs • 249
hypermart chains in Mexico City (including Carrefours and Wal-Mart) but only one or two in smaller Mexican cities.
Microdynamic competitive forces also influence market structure. As we discussed in Chapter 5 and in this chapter, some industries are predisposed to intensive price competition, perhaps because the industry is not amenable to facilitating practices or because there is high potential for misreads. For any given number of firms, prices will be lower in these more competitive industries. As a result, it is more difficult for firms to recover sunk production costs, fewer firms survive, and the market is more concentrated. A particularly good example is provided by Chamberlin’s model of monopolistic competition, which we developed in Chapter 5. When goods are highly differentiated, firms can raise prices and increase profits. This attracts additional differentiated entry. We used the market for take-out sandwiches as an example. If sandwich buyers have strongly idiosyncratic preferences so that some greatly prefer Quiznos while others are highly partial to Jimmy Johns, both stores will be able to raise prices. But these high prices will attract other entrants such as Subway and Togos.
The basic theory relating market structure and concentration masks two important empirical regularities: firm sizes vary and are highly skewed. That is, most markets tend to feature a small number of large firms and a great many smaller competitors. In his seminal book Sunk Costs and Market Structure, John Sutton offers a powerful explanation for these facts based on the macrodynamics of competition and, in doing so, challenges the notion that the number of competitors in a market is solely a function of market size and production technology.33
SUTTON’S ENDOGENOUS SUNK COSTS
Sutton’s explanation for market structure is rooted in the facts about consumer products markets. Most consumer goods markets seem to have two or three large firms with national or international brand reputations that serve the whole market, as well as a great many fringe manufacturers that seem to serve market niches. Sutton gives as examples soft drinks, canned food, and breakfast cereals, but we might add countless other industries where production costs are low and brand reputation is important.
If we consider sunk production costs alone, there is no particular reason why the U.S. canned vegetable market should be dominated by Green Giant and Del Monte or why Coke and Pepsi should sell most of the world’s soft drinks. And a theory of market structure based solely on the ratio of total market size to minimum efficient scale of production cannot explain why these markets are far more concentrated today than they were a hundred years ago. Consider that at the end of the nineteenth century, Americans were consuming 227 million servings of soft drinks annually, prepared by thousands of independent local “soda fountains.” Even after the arrival of massproduction bottling, local sellers dominated the market using their own unique syrups. Ginger ale, sarsaparilla, and root beer were early favorites, though by the 1920s cola drinks had risen to the top in popularity, spurred in part by aggressive marketing by Coke. (Pepsi did not grow rapidly until the 1930s, when it increased the size of its bottle from 6 to 12 ounces and ran a successful ad campaign promoting the added value.) Similar patterns arise in virtually all consumer product markets worldwide.
In explaining these facts, Sutton does not reject the importance of sunk costs and scale economies. Instead, he explains that consumers often gravitate to brandname products, and that the creation and maintenance of brands requires substantial sunk investments. In other words, the MES for branded products can be very large.

250 • Chapter 7 • Dynamics: Competing Across Time
EXAMPLE 7.6 THE EVOLUTION OF THE CHINESE DOWN APPAREL INDUSTRY
Bosideng is undisputedly the brightest star in the Chinese down apparel industry. Starting out as a small garment factory with 11 workers and 8 sewing machines in 1976, its pioneering brand-building and image-conscious approach has made it the national market share leader every year since 1995. In the process, Bosideng has become one of the most prestigious brand names in China. What makes this rise even more remarkable is that just a quarter century ago, the down apparel industry in China was highly fragmented with no well-known brands.
The Chinese down apparel industry began in earnest in late 1970s as increasingly affluent consumers showed their preference for the warmth, light weight, and softness of down jackets over their old, heavy cotton coats. Spurred by demand, over 3,000 manufacturers entered the industry. Their products were barely differentiated, rarely updated, and of marginal quality. Intense price competition inevitably resulted. A series of warm winters followed, and by the early 1990s, less than 20 percent of the down manufacturers were covering their costs.
Bosideng was one of the early entrants, preferring to manufacture down apparel under contract to other firms. Having earned a reputation for quality, Bosideng introduced its own branded line in 1994. Bosideng enjoyed immediate success among the cognoscenti, and within a year it became the market leader with a share of 15 percent. Even so, Bosideng struggled to distinguish itself from the undifferentiated horde of competitors.
Bosideng set about brand-building. In 1998, it became the primary sponsor for the Chinese National Mountain Climbing Team just before a televised mission to Mount Everest. Images of scruffy hard men and women surmounting the highest peak on earth clad in Bosideng were beamed to the nation. Bosideng invited renowned fashion designers to overhaul its styling, and hired pop stars and media celebrities from China and Korea to be celebrity endorsers. Bosideng has recently extended its reach to overseas. In 2005 and 2006, it sponsored the
ISU Short Track Speed Skating World Cup, the World Figure Skating Championships, and all Chinese skiing and skating athletes at the Winter Olympics in Torino, all of which helped it expand in the international market.
Bosideng was the first down apparel maker in China to build multiple brands targeting different consumer sectors. Its top-tier brand “Bosideng” targets high-end consumers while “Snow Flying” is sportier in style, “Bengen” focuses on the young, more hip consumer group, and “Kangbo” provides budget choices. This product combination also gives the company flexibility to deal with competitive challenges. In 2000, when a major national competitor started significant price-cutting, Bosideng cut the price of its “Snow Flying” brand while keeping prices for other brands relatively stable, preserving its market share and minimizing revenue loss.
Inspired by Bosideng, other major down apparel manufacturers started paying more attention to branding and fashion. The No. 2 brand of down apparel, Yalu, has also secured celebrity endorsements and introduced several subbrands. Long-time industry participant Yaya has targeted lower income consumers with products that it bills as the “affordable and budget-friendly choice.” Driven by the media savvy of Bosideng, the down apparel industry has become an adver- tising-intensive industry. In 2000, the entire industry spent RMB 220 million in television advertisements. But in 2008, the spending of one company, Bosideng, on one TV channel, China Central Television (CCTV), amounted to as much as RMB 220 million!
Led by Bosideng, the down apparel market in China underwent a consolidation. There are now about 100 manufacturers, but the top three brands account for 55 percent of the market, led by Bosideng’s 37 percent share. Through its massive investments in brand building, Bosideng transformed the market along the line suggested by Sutton—from one with thousands of undifferentiated competitors to one with a small number of branded market leaders and a competitive fringe.
Sutton’s Endogenous Sunk Costs • 251
Moreover, the size of the branding investment is not determined by some technology, as is the case for production, but is instead chosen by the firms themselves. For this reason, Sutton describes these investments as endogenous sunk costs.
With this key idea, Sutton can explain how market structures evolve. Early in an industry’s life cycle, many small firms compete on a level playing field. Whether through superior quality, customer service, brand promotion, or the luck of the draw, some firms grow larger than others. Some firms, usually those that already have an edge in the market, invest in strengthening their brand-name capital, thereby growing their market shares. But branding is very costly, and as a few firms establish strong brands, there may not be enough room in the market for others to match them. As the market keeps growing, the brand leaders may keep investing in their brands, upping the ante for any challengers to their elite brand status. In this way, the number of leading brands may remain fixed even as the market grows. The only option left to wouldbe challengers is to differentiate and fill niches not exploited by the leaders. At best these challengers become Dr Pepper or 7-Up. Eventually, niches may emerge that are large enough to command new brand investments; thus we get Gatorade and Arizona Iced Tea. But the overall story is the same: a market filled with small, seemingly similar, firms evolves into a split between a handful of leading brands and a larger number of niche competitors. The big winners are those that enjoy some initial advantage and are quick to successfully market their brand.
Sutton’s theory also explains why consumer goods markets tend to be more concentrated today than they were a century ago, despite dramatic increases in demand. One hundred years ago, firms relied on their sales force to promote their products. This labor-intensive process displayed few scale economies—the minimum efficient scale was within reach of even small firms. Thanks to the development of broadcast media, mainly television, firms could now invest in developing a brand image and create an ad campaign that reached millions of potential customers. But this requires substantial sunk costs and has big-scale economies. Thus, only a few firms in an industry need apply. Thanks to the Internet, social media, and other transformative technologies, firms today have unprecedented opportunities to identify niches and target niche customers. In Chapter 10, we discuss how these recent developments allow new firms to enter and draw business away from firms that had seemingly dominant brand positions.
Innovation and Market Evolution
While brand creation seems to lead to market concentration in consumer goods industries, other investments by firms in other industries may lead to different results. Sutton considers research and development spending to be another potential endogenous sunk cost. That is, market leaders may aggressively spend on R&D to force other firms to do likewise if they are to effectively compete. Because R&D is a sunk cost, this raises the minimum efficient scale of entry.
Although market leaders may make innovative investments to secure their positions, newcomers often find that innovations allow them to produce better products at lower costs. Clay Christensen describes disruptive technologies as unexpected innovations that dramatically transform a product’s benefits and/or its costs of production.34 Digital photography, plastics, and cellular phones are good examples. As described by Clay Christensen, incumbent firms must confront the innovator’s dilemma. Disruptive technologies may destroy the business of the technology they replace. Incumbents may accelerate the cannibalization of their successful