

Competitive Advantage and Value Creation: Conceptual Foundations • 299
its sales will slip and its market share will fall. This happened to Lexus and BMW in the early 2010s when its older designs lost share in the large sedan luxury segment to newer high-performance offerings by Audi, Jaguar, and Porsche.
Value-Created
Economic value is created when a producer combines inputs such as labor, capital, raw materials, and purchased components to make a product whose perceived benefit B exceeds the cost C incurred in making the product. The economic value created (or value-created, for short) is thus the difference between the perceived benefit and cost, or B 2 C, where B and C are expressed per unit of the final product.
Value-created must be divided between consumers and producers. Consumer surplus, B 2 P, represents the portion of the value-created that the consumer “captures.” The seller receives the price P and uses it to pay for the inputs that are needed to manufacture the finished product. The producer’s profit margin, P 2 C, represents the portion of the value-created that it captures. Adding together consumer surplus and the producer’s profit gives us the value-created expressed as the sum of consumer surplus and profit:
Value-Created 5 Consumer Surplus 1 Producer Surplus
5(B 2 P) 1 (P 2 C)
5B 2 C
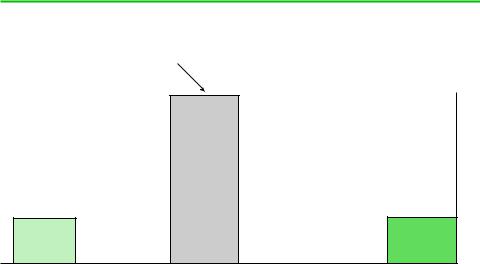
Figure 9.5 depicts value-created for a hypothetical producer of aluminum cans (e.g., a firm such as Crown, Cork and Seal). Start on the left side of the figure. The cost of producing 1,000 aluminum cans is $30 (i.e., C 5 $30). The maximum willingness-to-pay
FIGURE 9.5
The Components of Value-Created in the Market for Aluminum Cans
This is the highest price the buyer (e.g., a softdrink producer) is willing to pay before switching to a substitute product (e.g., tin-plate cans)
|
|
Consumer |
|
Value- |
|
surplus |
|
Consumer’s |
$45 |
|
|
created |
|
||
|
|
||
$70 |
maximum |
|
|
|
willingness |
|
Firm’s |
|
to pay |
|
profit |
|
$100 |
|
$25 |
|
|
|
|
Firm’s cost $30
C |
B – C |
B |
B – P |
P – C |
$ per 1,000 cans
Price (P) = $55
Firm’s cost $30
C
The difference between |
Value created is either . . . |
The sum of |
|
buyer maximum willingness- |
— or — |
consumer surplus |
|
to-pay and cost |
|
and firm profit |
|
|
|
|
|
|
|
|
|

300 • Chapter 9 • Strategic Positioning for Competitive Advantage
EXAMPLE 9.1 THE DIVISION OF THE VALUE-CREATED IN THE SALE OF BEER
AT A BASEBALL GAME
Assigning numbers to the areas in Figure 9.5 is usually difficult because B is hard to measure. But when the product is sold under conditions of monopoly and no reasonable substitutes are available, B can be approximated by making some simplifying assumptions about the nature of the demand curve for the product. An example of a product sold under these circumstances is beer at a baseball game. Because a purchaser of beer would probably not regard soft drinks as a close substitute and because patrons are not allowed to bring in their own beer, the stadium concessionaire has as tight a monopoly on the market as one could imagine.
Here are some basic data on beer sold at Cincinnati Reds baseball games in the late 1980s. The price of a 20-ounce cup of beer was $2.50. The stadium concessionaire, Cincinnati Sports Service, paid the distributor $0.20 per cup for this beer; paid royalties to the city of Cincinnati of $0.24 per cup; paid royalties to
the Cincinnati Reds baseball team of $0.54 per cup; and paid an excise tax of $0.14 per cup. Its total costs were thus $1.12.2
If we assume that the demand curve for beer is linear, then a plausible estimate of consumer surplus that is consistent with the data above is $0.69 per 20-ounce cup of beer.3 Table 9.1 shows the division of value in the sale of the beer using $0.69 per cup as an estimate of consumer surplus.
The brewer clearly captures only a small fraction of the value that is created.4 By contrast, by controlling the concessionaire’s access to the stadium and to the event, the city of Cincinnati and the Cincinnati Reds are able to capture a significant fraction of the value that is created. They can capture value because prospective concessionaires are willing to compete for the right to monopolize this market. As a result, the city and the Reds can extract a significant portion of the monopoly profit that would otherwise flow to the concessionaire.
TABLE 9.1
Division of Value in the Sale of Beer at Riverfront Stadium
Consumer Surplus
$.69
Profit to Cincinnati Sports Service
?
. . . . . . . . . . . . . . . . . . . . . . . . . . . . . . . . . . . . . . . . . . . . . . . . . . . . . . . . . . . . . . $1.38 Sports Service’s Costs (labor, materials, insurance, etc.)
?
Profit to Cincinnati Reds $.54
Profit to City of Cincinnati $.24
Taxes
$.14
Distributor’s Profit
. . . . . . . . . . . . . . . . . . . . . . . . . . . . . . . . . . ..?. . . . . . . . . . . . . . . . . . . . . . . . . . . . . . . . . . $.10 Distributor’s Costs (exclusive of price paid to brewer)
?
Brewer’s Profit
$.30
Brewer’s Costs
$.07
Competitive Advantage and Value Creation: Conceptual Foundations • 301
for a buyer of aluminum cans, for example, a soft-drink bottler such as Coca-Cola Enterprises, is $100 per thousand (i.e., B 5 $100). This represents the highest price the buyer is willing to pay for aluminum cans before switching to the best available alternative product, perhaps plastic containers. The difference between maximum willingness- to-pay and cost is the value-created, which in this case equals $70 (i.e., B 2 C 5 $70). Working our way down the right side of the diagram, we see that value-created of $70 equals the sum of consumer surplus and producer profit. If the seller of aluminum cans charges a price of $55 (i.e., P 5 $55), consumer surplus is $45 per thousand cans (i.e., B 2 P 5 $45), while producer profit margin is $25 per thousand (i.e., P 2 C 5 $25). The price P thus determines how much of the value-created sellers capture as profit and how much buyers capture as consumer surplus.
Value Creation and “Win–Win” Business Opportunities
No product can be viable without creating positive economic value. If B 2 C was negative, there would be no price that consumers would be willing to pay for the product that would cover the cost of the resources that are sacrificed to make the product. Bubblegum-flavored soda, vacuum tubes, and video cassette recorders are products that at one time created positive value, but because of changes in tastes and technology, they no longer create enough benefits to consumers to justify their production.
By contrast, when B 2 C is positive, a firm can profitably purchase inputs from suppliers, convert them into a finished product, and sell it to consumers. When B . C, it will always be possible for an entrepreneur to strike win–win deals with input suppliers and consumers, that is, deals that leave all parties better off than they would be if they did not deal with each other. In economics, win–win trade opportunities are called gains from trade. When B . C, clever entrepreneurs can exploit potential gains from trade.
Value Creation and Competitive Advantage
Although a positive B 2 C is necessary for a product to be economically viable, just because a firm sells a product whose B 2 C is positive is no guarantee that it will make a positive profit. In a market in which entry is easy and all firms create essentially the same economic value, competition between firms will dissipate profitability. Existing firms and new entrants will compete for consumers by bidding down their prices to the point at which all producers earn zero profit. In such markets, consumers capture all the economic value that the product creates.
It follows, then, that in order for a firm to earn positive profit in a competitive industry, the firm must create more economic value than its rivals. That is, the firm must generate a level of B 2 C that its competitors cannot replicate. This simple but powerful insight follows from our earlier discussion of the competitive implications of consumer surplus. To see why, imagine that two sellers are competing for your business. The seller whose product characteristics and price provides you the greatest amount of consumer surplus will win your business. The most aggressive consumer surplus “bid” that either seller would be prepared to offer is the one at which its profit is equal to zero, which occurs when it offers a price P that equals its cost C. At such a bid, a firm would hand over all of the value it creates to you in the form of consumer surplus. The firm with the advantage in this competition is the one that has the highest B 2 C. This is because that firm will be able to win your patronage by offering you a slightly more favorable consumer surplus “bid” than the most aggressive bid its rival is prepared to offer, while retaining the extra value it creates in the form of profit.5
302 • Chapter 9 • Strategic Positioning for Competitive Advantage
In one version of the above competitive scenario, all firms offer identical B. In this case, the “winning” firm must have lower C than its rivals. This reaffirms an idea introduced in Chapter 5, that successful firms in perfectly competitive industries must have lower costs than their rivals. This also holds true in concentrated markets when firms compete aggressively on the basis of price, such as in the Bertrand model also described in Chapter 5. The firm with the lowest cost can slightly undercut its rivals’ prices, capture the entire market, and more than cover its production costs.
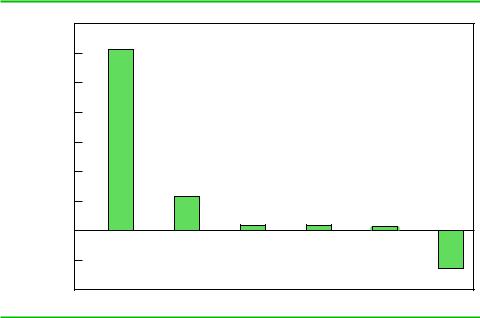
In markets with homogeneous products, the firm offering the highest B 2 C captures the entire market. In most markets, different customers will make different tradeoffs between price and the attributes that drive B, so that one firm might create a higher B 2 C among one segment of consumers, while another firm may create a higher B 2 C among other segments. We saw this, for example, in the personal computer industry in the late 1990s in which Gateway probably created more economic value in the SOHO (small office/home office) segment of the market, while Dell created more economic value in most of the rest of the market. As Figure 9.6 shows, both Dell and Gateway consistently outperformed industry peers during the latter half of the 1990s. We will discuss the implications of this market segmentation later in the chapter.
Analyzing Value Creation
Understanding how a firm’s product creates economic value and whether it can continue to do so is a necessary first step in diagnosing a firm’s potential for achieving a competitive advantage in its market. Diagnosing the sources of value creation requires
FIGURE 9.6
Economic Profitability of Personal Computer Makers
capital |
70.00% |
|
|
|
|
|
60.00% |
|
|
|
|
|
|
|
|
|
|
|
|
|
invested |
50.00% |
|
|
|
|
|
40.00% |
|
|
|
|
|
|
of |
|
|
|
|
|
|
|
|
|
|
|
|
|
as percentage |
30.00% |
|
|
|
|
|
20.00% |
|
|
|
|
|
|
10.00% |
|
|
|
|
|
|
profit |
|
|
|
|
|
|
0.00% |
|
|
|
|
|
|
Economic |
|
|
|
|
|
|
–10.00% |
|
|
|
|
|
|
–20.00% |
|
|
|
|
|
|
|
Gateway |
HP |
IBM |
Compaq |
Apple |
|
|
Dell |
This figure shows average economic profits (expressed as a percentage of invested capital) of selected personal computer makers over the period 1995–1999.
Source: 2000 Stern Stewart Performance 1000 database.

Competitive Advantage and Value Creation: Conceptual Foundations • 303
an understanding of why the firm’s business exists and what its underlying economics are. This, in turn, involves understanding what drives consumer benefits (e.g., how the firm’s products serve consumer needs better than potential substitutes) and what drives costs (e.g., which costs are sensitive to production volume, or how costs change with cumulative experience).
Projecting the firm’s prospects for creating value also involves critically evaluating how the fundamental economic foundations of the business are likely to evolve, an exercise that Richard Rumelt calls consonance analysis.6 Perhaps the most basic of all
EXAMPLE 9.2 KMART VERSUS WAL-MART
Kmart’s battle with Wal-Mart provides a good illustration of a firm’s disadvantage when it has a lower B 2 C than its rivals. Throughout the 1990s, Kmart had invested in technology to support its “Blue Light Special” strategy of frequent but unpredictable sales and promotions. Unfortunately, Kmart had failed to make similar investments in supply-chain information systems, so that the products advertised in newspaper shopping supplements were often out of stock in the stores! During 2001, Kmart attempted to copy Wal-Mart’s “Everyday Low Prices” strategy by cutting prices on 38,000 items while at the same time cutting back on Blue Light Special sales.
Unfortunately for Kmart, this price leadership “strategy” was easy to imitate. In particular, Wal-Mart had no desire to sit idly by and lose share. Besides, Wal-Mart’s unit costs were generally lower than Kmart’s (thanks in part to Wal-Mart’s expertise in supply chain management), so Wal-Mart could (and did) match Kmart’s prices and still remain profitable. To make matters worse for Kmart, there was a WalMart within five miles of most Kmart stores. As a result, Kmart’s strategy merely succeeded in lowering margins without materially affecting its market share. The failure of this strategy contributed to a deterioration in Kmart’s performance in 2001 that eventually led to Kmart’s declaration of bankruptcy in early 2002.
Kmart emerged from bankruptcy in 2003, when a hedge fund led by Edward Lampert bought the company. Lampert promptly shuttered hundreds of stores, laid off thousands of workers, and introduced trendy brands to draw
new customers. In 2005, when Kmart acquired Sears Roebuck, Lampert was touted as the savior of the old-line mass merchandisers. It hasn’t worked out that way.
In the wake of the merger, Lampert converted many Kmart stores in the United States and Canada to Sears outlets. At the same time, Kmart attempted to reposition itself as the “store of the neighborhood.” This strategy aimed primarily at racial or ethnic communities in urban areas, most especially African Americans and Hispanics. The goal of the strategy seemed to be to differentiate Kmart from Wal-Mart and Target by further exaggerating the income differential between Kmart shoppers and shoppers at Wal-Mart and Target.7 However, this strategy brought Kmart into more direct competition with deepdiscount “dollar retailers,” such as Dollar General and Family Dollar, that have been targeting lower income urban communities for many years. Thanks to the end of the property bubble, Sears has even suffered major losses in real estate, which represents as much as one half of the value of the company (based on the revenues that could be generated if Sears sold the land on which its stores sit).
Nearly a decade after Lampert rode in on his white horse to rescue Kmart and Sears, the two retailers continue to struggle. Although Lampert has been hailed as the “next Warren Buffett,” he has thus far failed to undo the stores’ B 2 C disadvantage. Although most analysts believe that Sears is unlikely to return to its former glory, investors remain enamored of Lampert and Sears stock continues to hold its own.