

Demand and Revenues • 21
FIGURE P.7
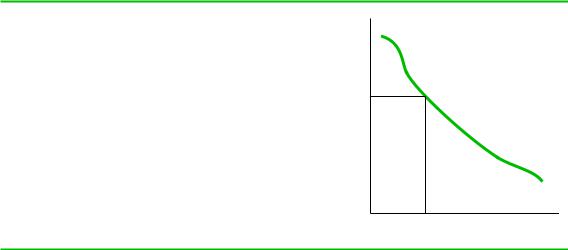
Demand Curve
The demand curve shows the quantity of a product that consumers will purchase at different prices. For example, at price P9 consumers purchase Q9 units of the product. We would expect an inverse relationship between quantity and price, so this curve is downward sloping.
P′
Price
Q′
Q Quantity
The law of demand may not hold if high prices confer prestige or enhance a product’s image, or when consumers cannot objectively assess the potential performance of a product and use price to infer quality. Both prestige and signaling effects could result in demand curves that slope upward for some range of prices. Even so, personal experience and countless studies from economics and marketing confirm that the law of demand applies to most products.
As Figure P.7 shows, the demand curve is typically drawn with price on the vertical axis and quantity on the horizontal axis. This may seem strange because we think that price determines the quantity demanded, not the other way around. However, this representation emphasizes a useful alternative interpretation for a demand curve. Not only does the demand curve tell us the quantity consumers will purchase at any given price, it also tells us the highest possible price that the market will bear for a given quantity or supply of output. Thus, in Figure P.7, if the firm sets a target of selling output level Q9 (which might be what it can produce by running at full capacity), the demand curve tells us that the highest price the firm can charge is P9.
The Price Elasticity of Demand
Look at a firm that is considering a price increase. The firm understands that according to the law of demand, the increase in price will result in the loss of some sales. This may be acceptable if the loss in sales is not “too large.” If sales do not suffer much, the firm may actually increase its sales revenue when it raises its price. If sales drop substantially, however, sales revenues may decline, and the firm could be worse off.
Figure P.8 illustrates the implications of the firm’s pricing decision when its demand curve has one of two alternative shapes, DA and DB. Suppose the firm is currently charging P0 and selling Q0, and is considering an increase in price to P1. If the firm’s demand curve is DA, the price increase would cause only a small drop in sales. In this case, the quantity demanded is not very sensitive to price. We would suspect that the increase in price would increase sales revenue because the price increase swamps the quantity decrease. By contrast, if the firm’s demand curve is DB, the increase in price

22 • Economics Primer: Basic Principles
FIGURE P.8
Price Sensitivity and the Shape of the Demand Curve
When the demand curve is DA, a change in price from P0 to P1 has only a small effect on the quantity demanded. However, when the demand curve is DB, the same change in price results in a large drop in quantity demanded. When DA is the demand
curve, we would conjecture that the increase in price would increase sales revenues, but when DB is the demand curve, the price increase would reduce sales revenues.
Price
P1 P0
DB
DA
Q0
Q Quantity
would cause a large drop in sales. Here, the quantity demanded is very sensitive to price. We would expect that the price increase would decrease sales revenues.
As this analysis shows, the shape of the demand curve can strongly affect the success of the firm’s pricing strategy. The concept of the price elasticity of demand summarizes this effect by measuring the sensitivity of quantity demanded to price. The price elasticity of demand, commonly denoted by , is the percentage change in quantity brought about by a 1 percent change in price. Letting subscript “0” represent the initial situation and “1” represent the situation after the price changes, the formula for elasticity is
5 2 DQyQ0
DPyP0
where DP 5 P1 2 P0 is the change in price, and DQ 5 Q1 2 Q0 is the resulting change in quantity.8 To illustrate this formula, suppose price is initially $5, and the corresponding quantity demanded is 1,000 units. If the price rises to $5.75, though, the quantity demanded would fall to 800 units. Then
|
800 2 1000 |
|
|
|
|||
5 2 |
1000 |
|
|
5 |
20.20 |
5 1.33 |
|
|
5.75 2 |
5 |
|
0.15 |
|||
|
5 |
|
|
|
|
|
|
Thus over the range of prices between $5.00 and $5.75, quantity demanded falls at a rate of 1.33 percent for every 1 percent increase in price. The price elasticity might be less than 1 or greater than 1.
•If is less than 1, we say that demand is inelastic, which is the situation along demand curve DA for the price change being considered.
•If is greater than 1, we say that demand is elastic, which is the situation along demand curve DB for the price change being considered.
Demand and Revenues • 23
Given an estimate of the price elasticity of demand, a manager could calculate the expected percentage change in quantity demanded resulting from a given change in price by multiplying the percentage change in price by the estimated elasticity. To illustrate, suppose management believed 5 0.75. If it contemplated a 3 percent increase in price, then it should expect a 3 3 0.75 5 2.25 percent drop in the quantity demanded as a result of the price increase.9
Price elasticities can be estimated using statistical techniques, and economists and marketers have estimated price elasticities for many products. But in most practical situations, managers will not have the benefit of a precise numerical estimate of elasticity based on statistical techniques. Consequently, the manager must rely on his or her knowledge of the product and the nature of the market to estimate price sensitivity. Among the factors that tend to make demand for the firm’s product more sensitive to price are the following:
•The product has few unique features that differentiate it from rival products, and buyers are aware of the prices and features of rival products. Airline service is a good example of a product that is hard to differentiate and where consumers can easily inform themselves of the range of prices that exist in a particular market.
•Buyers’ expenditures on the product are a large fraction of their total expenditures. In this case, the savings from finding a comparable item at a lower price are large, so consumers tend to shop more than when making small purchases. Refrigerators and washing machines are products whose demand is fairly price sensitive because consumers are motivated to shop around before purchasing.
•The product is an input that buyers use to produce a final good whose demand is itself sensitive to price. In this case, if buyers tried to pass through to their customers even small changes in the price of the input, demand for the finished good could decrease dramatically. The input buyers will thus be very sensitive to price. For example, a personal computer manufacturer’s demand for components and materials is likely to be highly price elastic because consumer demand for personal computers is highly price elastic.
Among the factors that tend to make demand less sensitive to price are the following:
•Comparisons among substitute products are difficult. This could be because the product is complex and has many performance dimensions; because consumers have little or no experience with substitute products and thus would face a risk if they purchased them; or because comparison shopping is costly. Items sold door-to- door, such as Avon cosmetics, have traditionally been price inelastic because, at the time of sale, most consumers lack good information about the prices of alternatives.
•Because of tax deductions or insurance, buyers pay only a fraction of the full price of the product. Health care is an excellent example.
•A buyer would incur significant costs if it switched to a substitute product. Switching costs could arise if the use of a product requires specialized training or expertise that is not fully transferable across different varieties of the product. For example, to the extent that a consumer develops expertise in using a particular word processing package that is incompatible with available alternatives, switching costs will be high, and price sensitivity for upgrades will be low.