

294 • Chapter 9 • Strategic Positioning for Competitive Advantage
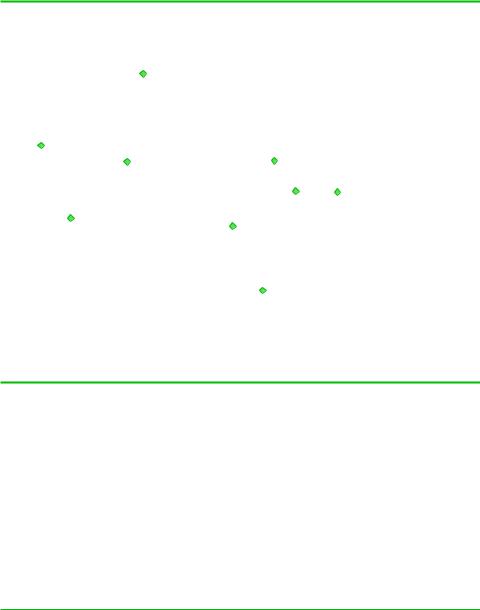
FIGURE 9.1
Unit Costs, Profit Margins, and Market Shares (in parentheses) for Major U.S. Airlines, 2010
|
|
Profit Margin |
|
|
|
|
|
|
|
|
|||
|
|
(net profit as a |
15% |
|
|
|
|
|
|
|
|||
|
|
percentage of revenue) |
|
|
|
|
|
|
|
|
|||
|
|
|
Alaska (2.6%) |
|
|
|
|
|
|
|
|
||
JetBlue (3.6%) |
|
|
10% |
|
|
|
|
|
|
|
|||
|
|
|
|
|
|
|
|
|
|||||
|
|
|
|
|
|
|
|
|
|
||||
|
|
Southwest (9.9%) |
|
|
Delta (20.7%) |
|
|
|
|
||||
|
|
|
|
|
|
|
|
United (12.7%) |
US Airways (7.4%) |
|
|
||
|
AirTran (2.4%) |
|
|
|
|
|
|
|
|
||||
|
|
|
5% |
|
|
|
|
|
|
|
|||
|
|
|
|
|
|
|
|
|
|
|
|
|
|
|
|
|
|
|
|
|
|
|
|
|
|
|
|
|
|
|
|
Continental (10.0%) |
|
|
|
|
|
|
|||
|
|
|
|
|
|
|
|
American (15.8%) |
|
|
|||
|
|
|
|
|
|
|
|
|
|
|
|
|
|
|
|
|
|
|
|
|
|
|
|
|
|
|
|
–30% |
–20% |
–10% |
10% |
20% |
30% |
||||||||
|
|
|
|
|
|
|
|
|
|
|
Unit Cost |
|
|
(percent difference from industry average)
Unit costs are expressed as a percentage difference from the industry average.1
This chapter develops a conceptual framework for characterizing and analyzing a firm’s strategic position within an industry. This framework employs simple economic concepts to identify conditions necessary for competitive advantage in a market. The chapter is organized in four sections. The first defines the concept of competitive advantage and argues that to achieve it a firm must create more value than its rivals. The ability to create value is shaped by how firms position themselves to compete in an industry. The second section discusses the economic and organizational logic of two broad alternative approaches to positioning: cost leadership and benefit leadership. The third section presents specific tools for diagnosing a firm’s cost and benefit position in its market. The final section explores broad coverage versus focus strategies.
COMPETITIVE ADVANTAGE AND VALUE CREATION:
CONCEPTUAL FOUNDATIONS
Competitive Advantage Defined
The five-forces framework presented in Chapter 8 is based on the idea that industry conditions are an important determinant of a firm’s profitability. Profitability does not only vary across industries; it also varies within a particular industry, and in the
Competitive Advantage and Value Creation: Conceptual Foundations • 295
FIGURE 9.2
Framework for Competitive Advantage
|
|
|
|
Market |
|
|
|
|
|
|
|
|
economics |
|
|
|
|
|
|
|
|
|
|
|
|
|
|
|
|
|
|
|
|
Economic |
|
|
Benefit position |
|
|
|
|
|
|
|
|
relative to |
|
|
|
|
|
profitability |
|
|
|
|
|
|
|
|
||
|
competitors |
|
|
Value created |
|
|
|
|
|
|
|
|
|
|
|
|
|
|
|
|
|
relative to |
|
|
|
|
|
|
|
|
|
|
|
|
|
|
Cost position |
|
|
competitors |
|
|
|
|
|
|
|
|
|
|
|
|
|
|
relative to |
|
|
|
|
|
|
|
|
|
|
|
|
|
|
|
|
|
competitors |
|
|
|
|
|
|
|
|
|
|
|
|
|
|
|
|
|
|
|
|
|
|
|
|
|
A firm’s profitability depends jointly on the economics of its market and its success in creating more value than its competitors. The amount of value the firm creates compared to competitors depends on its cost and benefits position relative to competitors.
Introduction we described research evidence showing that intra-industry variability in profits is at least as large as inter-industry variability. When a firm earns a higher rate of economic profit than the average rate of economic profit of other firms competing within the same market, the firm has a competitive advantage in that market. (Careful application of this definition, of course, requires an economically sensible definition of the firm’s market, a topic taken up in Chapter 5.) The main premise of this chapter is that firms achieve a competitive advantage by creating and delivering more economic value than their rivals and capture a portion of this value in the form of profits.
Figure 9.2 summarizes the framework that we develop in this chapter. According to this framework, a firm’s economic profitability within a particular market depends on the economic attractiveness or unattractiveness of the market in which it competes (as summarized by a five-forces analysis) and on its competitive position in that market (i.e., whether it has a competitive advantage or disadvantage). Whether a firm has a competitive advantage or disadvantage depends on whether it is more or less successful than rivals at creating and delivering economic value. As we will see, a firm that can create and deliver more economic value than its competitors can simultaneously earn higher profits and offer higher net benefits to consumers than its competitors can.
Maximum Willingness-to-Pay and Consumer Surplus
Businesses that create more value than competitors will hold an advantaged position in the marketplace. To illustrate why, we need to define value creation and show how it relates to competitive advantage. Before defining value creation, we must first discuss maximum willingness-to-pay and consumer surplus.
Suppose that a particular software package is worth $150 to you. If its market price was $80, you would buy it. The purchase makes you better off because you have given up $80 to receive something more valuable—a software package that you feel is worth $150. The extent by which you are better off—in this case $150 2 $80, or $70—is your consumer surplus.
296 • Chapter 9 • Strategic Positioning for Competitive Advantage
More formally, let B denote a dollar measure of what one unit of a product is worth to a particular consumer, or equivalently, the consumer’s maximum willingness- to-pay for the product. It might be better to call B the perceived benefit because the consumer may not know the actual value of a product until after purchase. For now, we will consider B without regard to the availability of substitute products. To understand what maximum willingness-to-pay means, let’s see how we might assess a consumer’s maximum willingness-to-pay for a Honda Accord. Our consumer starts off with no automobile of any kind and is then given, free of charge, a Honda Accord. She is certainly better off than before. Now, let’s successively take money away from her. At some point, perhaps after we’ve taken away $30,500, she deems her situation (owning a Honda but with $30,500 less wealth) completely equivalent to her original situation (no Honda and no other automobile, but with her wealth intact). That dollar amount—$30,500—represents our consumer’s maximum willingness-to-pay for a Honda Accord and would be her assessment of the Accord’s B.
A consumer’s willingness-to-pay for a good or service is somewhat intangible, as it depends on that consumer’s tastes. A firm’s willingness-to-pay for an input is easier to quantify because it is related to the impact of that input on the profitability of the firm, and profits are easier to measure than tastes. One way to measure a firm’s willingness-to-pay is with value-added analysis. Consider, for example, a producer of soft drinks—say Cadbury Schweppes, the producer of 7-Up and Dr Pepper—that uses corn syrup sold by Archer Daniel’s Midland (ADM) as a sweetener for its products. Cadbury Schweppes would like to determine the maximum amount it should be willing to pay for ADM’s corn syrup. Suppose that Cadbury Schweppes’s best available alternative to using corn syrup is to use sugar. As far as the end consumer of soft drinks is concerned, Cadbury Schweppes’s choice of sugar or corn syrup is immaterial; the final product tastes exactly the same. Given this, the Cadbury Schweppes’s maximum willingness-to-pay for ADM’s corn syrup (i.e., the B for ADM’s corn syrup) depends on the overall cost of production using corn syrup versus the cost using sugar.
The left-hand side of Figure 9.3 shows the economics of production when Cadbury Schweppes uses sugar to manufacture its soft drinks. In particular, when the cost of sugar is 3 euros per hundredweight, the “all-in” production cost using sugar (the sum of the costs of sugar, other materials, processing, and packaging) is 17 euros per hundredweight of soft drink. Cadbury Schweppes will prefer corn syrup provided that the “all-in” production costs are less than 17 euros. The right-hand side shows that by using corn syrup, Cadbury Schweppes incurs a somewhat higher processing cost and a somewhat higher cost of other materials, which limits the amount that Cadbury Schweppes would be willing to pay for corn syrup. Figure 9.3 shows that it would be willing to pay at most 2 euros per hundredweight. This is the value added of ADM’s corn syrup and equals the price of corn syrup at which Cadbury Schweppes’s “all-in” production cost using ADM’s corn syrup is the same as its “all-in” production cost using sugar. If the price of ADM’s corn syrup was any higher than 2 euros per hundredweight, Cadbury Schweppes would save money by switching to sugar as its sweetener.
From Maximum Willingness-to-Pay to Consumer Surplus
Recall that B represents the benefit that a consumer expects to derive from a product. If we let P denote the product’s monetary price, the consumer surplus is the difference B 2 P. For example, if the price of the Honda Accord is $21,000, the consumer surplus of our hypothetical consumer would be $30,500 2 $21,000 5 $9,500. Suppose that

Competitive Advantage and Value Creation: Conceptual Foundations • 297
FIGURE 9.3
A Soft-Drink Producer’s Maximum Willingness-to-Pay for Corn Syrup
|
|
|
Production |
|
|
|
|
|
|
Production |
|||
|
|
|
economics: |
|
All costs expressed |
|
|
economics: |
|||||
|
|
sugar used as |
|
|
corn syrup used |
||||||||
|
|
|
per hundredweight |
|
|||||||||
|
|
|
sweetener |
|
|
|
as sweetener |
||||||
|
|
|
|
|
|
|
|
|
|||||
|
|
|
|
|
|
|
|
|
|
|
|
|
|
|
|
|
|
|
|
3 euros |
|
3.5 |
|
|
|
|
|
|
|
|
|
|
|
|
euros |
|
|
|
|
|
|
|
|
|
|
|
|
|
|
|
|
|
|
|
|
|
|
|
|
|
4 |
|
|
|
|
|
|
|
|
|
All-in |
|
|
|
|
4.5 |
|
|
|
|
|||
|
|
euros |
|
|
|
|
|
|
|
||||
|
cost of |
|
|
|
|
|
euros |
|
|
|
|
||
producing |
7 |
|
|
|
|
|
7 |
|
|
|
|||
with sugar |
euros |
|
|
|
|
|
|
|
|
||||
|
|
|
|
|
euros |
|
|
|
|||||
|
|
|
|
|
|
|
|
|
|
|
|
|
|
|
|
|
3 euros |
|
|
|
|
|
|
|
|
|
|
|
|
|
|
|
|
|
|
|
|
2 euros |
|
|
|
|
|
|
Sugar |
Packaging |
Process |
Other |
|
Other |
Process Packaging |
Maximum |
|||
|
|
|
costs |
costs |
costs |
materials |
|
materials |
costs |
costs |
willingness- |
||
|
|
|
|
|
|
costs |
|
costs |
|
|
to-pay for |
||
|
|
|
|
|
|
|
|
|
|
|
corn syrup |
||
|
|
|
|
|
|
|
|
|
|
|
(B) |
||
A soft-drink maker’s maximum willingness-to-pay for corn syrup (i.e., its B) is represented by the height of the shaded bar at the far right. At this price of corn syrup, the soft-drink producer is just indifferent between producing a soft drink with corn syrup and producing a soft drink with the best available substitute for corn syrup, namely, sugar. If the price of corn syrup were any higher, the soft-drink maker would not purchase corn syrup and would use sugar instead.
the same consumer values a Nissan Leaf at B $38,000 and the price of the Leaf is P $31,000, creating a consumer surplus of $7,000. This individual will purchase the Accord because it provides the higher surplus. This example suggests a simple model of consumer behavior: a consumer will purchase a product only if the product’s consumer surplus is positive. Moreover, given a choice between two or more competing products, the consumer will purchase the one for which consumer surplus, B 2 P, is largest.
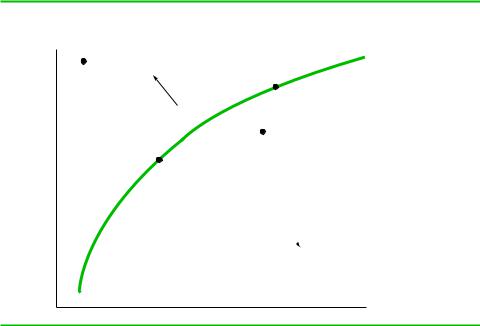
Whether its customers are firms or individuals, a seller must deliver consumer surplus to compete successfully. The value map in Figure 9.4 illustrates the competitive implications of consumer surplus. The vertical axis shows the monetary price P of the product. Each point in the value map corresponds to a particular price–quality combination. The solid upward-sloping line in Figure 9.4 is called an indifference curve.
For a given consumer, any price–quality combination along the indifference curve yields the same consumer surplus (i.e., has the same B 2 P ). In Figure 9.4, products A and B offer the same B 2 P. A consumer choosing among products located along the indifference curve would thus be indifferent among the offerings. A product offering a price–quality combination located below a given indifference curve (e.g., product C) yields a higher consumer surplus than that yielded by products along the indifference curve. From the consumer’s perspective, product C provides superior value to products A and B (and, as we will soon see, product D as well). A product offering a price–quality combination located above a given indifference curve (e.g., product D) yields a consumer surplus lower than that yielded by products
298 • Chapter 9 • Strategic Positioning for Competitive Advantage
FIGURE 9.4
The Value Map
P |
|
|
|
(Price) |
Lower |
Indifference |
|
|
|||
|
consumer |
curve |
|
Product D surplus |
|||
Product A |
|||
Product B |
Product C |
Higher consumer surplus 
q (Quality)
The value map illustrates the price–quality positions of firms in a market. The solid line is an indifference curve. It illustrates price–quality combinations that yield the same consumer surplus. Price–quality positions located below a given indifference curve yield a consumer surplus that is higher than that yielded by positions along the indifference curve. Price–quality positions located above an indifference curve yield consumer surplus that is lower than that yielded by positions along the indifference curve. When some products are positioned on a given indifference curve while others are positioned off the curve, consumers will flock to the firms providing the higher consumer surplus.
along the indifference curve. From the consumer’s perspective, such products provide inferior value. From the consumer’s perspective, product D provides inferior value to products A and B (and also C).
Competition among firms in a market can be thought of as a process whereby firms, through their prices and product attributes, submit consumer surplus “bids” to consumers. Consumers then choose the firm that offers the greatest amount of consumer surplus. A firm that offers a consumer less surplus than its rivals (e.g., the firm producing product D) will lose the fight for that consumer’s business. When firms’ price–quality positions line up along the same indifference curve—that is, when firms are offering a consumer the same amount of consumer surplus—we say that the firms have achieved consumer surplus parity. (In Figure 9.3, the firms selling products A and B have attained consumer surplus parity.) If firms achieve consumer surplus parity in a market in which consumers have identical preferences (i.e., the same indifference curves), no consumer within that market has an incentive to switch from one seller to another, and market shares will thus be stable. If all firms in the market have the same quality, then consumer surplus parity means that each firm charges the same price.
When a firm moves from a position of consumer surplus parity or consumer surplus advantage to one in which its consumer surplus is less than that of its competitors,