


The Learning Curve • 77
TABLE 2.2
Sources of Scale Economies and Diseconomies
Sources of Economies |
Comment |
Product-specific fixed costs |
These costs include specialized tools and dies, training, and |
|
setup costs; they are usually associated with capital-intensive |
|
production. |
Trade-offs among alternative |
Larger plants may have lower average costs, provided they |
production technologies |
operate near capacity. |
Cube-square rule |
This rule applies whenever output is proportional to the volume |
|
of the production vessel but costs are proportional to the |
|
surface area of the vessel. |
Purchasing |
Larger purchasers can get better prices by reducing seller costs |
|
or by demonstrating greater willingness to shop around. |
Advertising |
Fixed costs of producing advertisements generate scale |
|
economies; umbrella branding spreads marketing costs over |
|
more customers. |
Inventories |
Consolidating inventories reduces stocking and outage costs. |
Ambiguous |
|
Research and development |
Large firms can spread R&D costs. Smaller firms may have |
|
more incentive to innovate and pursue a wider range of |
Sources of Diseconomies |
research ideas. |
|
|
Labor costs |
Larger firms usually pay higher wages, all else equal. |
Spreading resources too thin |
Firms often rely on a few key personnel whose skills cannot be |
|
“replicated.” |
Bureaucracy |
Incentives, information flows, and cooperation can suffer in |
|
large organizations. |
|
|
THE LEARNING CURVE
Medical students are encouraged to learn by the axiom “See one, do one, teach one.” This axiom grossly understates the importance of experience in producing skilled physicians—one surgery is not enough! Experience is an important determinant of ability in many professions, and it is just as important for firms. The importance of experience is conveyed by the idea of the learning curve.
The Concept of the Learning Curve
Economies of scale refer to the advantages that flow from producing a larger output at a given point in time. The learning curve (or experience curve) refers to advantages that flow from accumulating experience and know-how. It is easy to find examples of learning. A manufacturer can learn the appropriate tolerances for producing a system component. A retailer can learn about its customers’ tastes. An accounting firm can learn the idiosyncrasies of its clients’ inventory management. The benefits of learning manifest themselves in lower costs, higher quality, and more effective pricing and marketing.
78 • Chapter 2 • The Horizontal Boundaries of the Firm
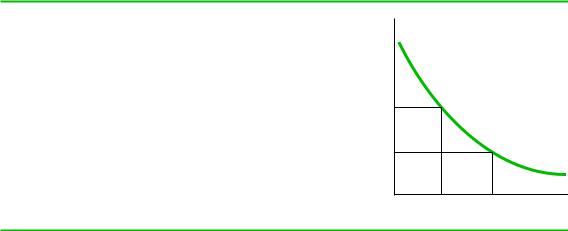
FIGURE 2.7
The Learning Curve
When there is learning, average costs fall with cumulative production. Here, as cumulative production increases from Qx to 2Qx, the average cost of a batch of output falls from AC1 to AC2.
$ Per unit
AC1
AC2
AC
Qx 2Qx
Cumulative production
The magnitude of learning benefits is often expressed in terms of a slope. The slope for a given production process is calculated by examining how far average costs decline as cumulative production output doubles. It is important to use cumulative output rather than output during a given time period to distinguish between learning effects and simple economies of scale. As shown in Figure 2.7, suppose that a firm has cumulative output of Qx with average cost of production of AC1. Suppose next that the firm’s cumulative output doubles to 2Qx with average cost of AC2. Then the slope equals AC2/AC1.
Slopes have been estimated for hundreds of products.10 The median slope appears to be about .80, implying that for the typical firm, doubling cumulative output reduces unit costs by about 20 percent. Slopes vary from firm to firm and industry to industry, however, so that the actual slope enjoyed by any one firm for any given production process generally falls between .70 and .90 and may be as low as .6 or as high as 1.0 (e.g., no learning). Note that estimated slopes usually represent averages over a range of outputs and do not indicate whether or when learning economies are fully exploited.
While most studies of the learning curve focus on costs, some studies have documented the effects of learning on quality. Example 2.3 discusses a recent study of learning in medicine, where experience can literally be a matter of life and death.
Expanding Output to Obtain a Cost Advantage
When firms benefit from learning, they may want to ramp up production well past the point where the additional revenues offset the added costs. This strategy makes intuitive sense, because it allows the firm to move down the learning curve and realize lower costs in the future. Though it might seem to violate the cardinal rule of equating marginal revenue to marginal cost (see the Economics Primer), the strategy is in fact completely consistent with this rule if one properly construes the cost of current production in the presence of learning. To see why this is so, consider the following example:
Suppose that a manufacturer of DRAM chips has cumulative production of 10,000 chips. The cost to manufacture one additional chip is $2.50. The firm believes

The Learning Curve • 79
EXAMPLE 2.3 LEARNING BY DOING IN MEDICINE
Learning curves are usually estimated for costs—as firms accumulate experience, the cost of production usually falls. But learning manifests itself in other ways, perhaps none as vital as in medicine, where learning can literally be a matter of life and death.
Researchers have long noted that highvolume providers seem to obtain better outcomes for their patients. This volume/outcome relationship appears dramatically in the so-called January/July effect. This is the well-documented fact that mortality rates at teaching hospitals spike in early January and July. One might explain the January spike as the after-effect of New Year’s Eve revelry, but that won’t explain July. The real reason is that medical residents usually change their specialty rotations in January and July. Hospital patients during these time periods are therefore being treated by doctors who may have no experience treating their particular ailments. Many other studies document the problems of newly minted physicians.
But the volume/outcome relationship also applies to established physicians. Back in the 1970s, this was taken as prima facie evidence of a learning curve. But there is another plausible explanation for the relationship—perhaps highquality physicians receive more referrals. If so, then outcomes drive volume, not vice versa. This might not matter to patients who would clearly be served by visiting a high-volume provider regardless of how this chicken/egg question was resolved, but it would matter to policy
makers who have often proposed limiting the number of specialists in certain fields on the grounds that entry dilutes learning.
There is a statistical methodology that can be used to sort out causality. The technique is commonly known as instrumental variables regression and requires identifying some phenomenon that affects only one side of the causality puzzle. In this case, the phenomenon would have to affect volume but not outcomes. Statistical analysis could then be used to unambiguously assess if higher volumes really do lead to better outcomes.
In a recent study, Subramaniam Ramanarayanan used instrumental variables regression to study the learning curve.11 He studied cardiac surgery, where mortality rates for physicians can vary from below 2 percent to above 10 percent. As an instrument, Ramanarayanan chose the retirement of a geographically proximate heart surgeon. When a surgeon retires, volumes of other surgeons can increase by 20 patients or more annually. Retirement is a good instrument because it affects volumes but does not otherwise affect outcomes. Ramanarayanan found that surgeons who treat more patients after the retirement of a colleague enjoy better outcomes. Each additional surgical procedure reduces the probability of patient mortality by 0.14 percent. This reduction is enjoyed by all of the surgeon’s patients. Ramanarayanan’s study offers compelling evidence that surgeons need to maintain high volumes to be at their best.
that once it has produced 100,000 chips its unit costs will fall to $2.00, with no further learning benefits. The company has orders to produce an additional 200,000 chips when it unexpectedly receives a request to produce 10,000 chips to be filled immediately. Given the current unit cost of $2.50 per chip, it might seem that the firm would be unwilling to accept anything less than $25,000 for this order. This might be a mistake, as the true marginal cost is less than the current unit cost.
To determine the true marginal cost, the chip maker must consider how its accumulated experience will affect future costs. Before it received the new order, the chip maker had planned to produce 200,000 chips. The first 100,000 would cost $2.50 per chip, and the remaining 100,000 would cost $2.00 per chip, for a total of
80 • Chapter 2 • The Horizontal Boundaries of the Firm
$450,000 for 200,000 chips. If the firm takes the new order, then the cost of producing the next 200,000 chips is only $445,000 (90,000 chips @ $2.50 1 110,000 chips @ $2.00).
By filling the new order, the DRAM manufacturer reduces its future production costs by $5,000. In effect, the incremental cost of filling the additional order is only $20,000, which is the current costs of $25,000 less the $5,000 future cost savings. Thus, the true marginal cost per chip is $2.00. The firm should be willing to accept any price over this amount, even though a price between $2.00 and $2.50 per chip does not cover current production costs.
In general, when a firm enjoys the benefits of a learning curve, the marginal cost of increasing current production is the expected marginal cost of the last unit of production the firm expects to sell. (This formula is complicated somewhat by discounting future costs.) This implies that learning firms should be willing to price below short-run costs. They may earn negative accounting profits in the short run but will prosper in the long run.
Managers who are rewarded on the basis of short-run profits may be reluctant to exploit the benefits of the learning curve. Firms could solve this problem by directly accounting for learning curve benefits when assessing profits and losses. Few firms that aggressively move down the learning curve have accounting systems that properly measure marginal costs, however, and instead rely on direct growth incentives while placing less emphasis on profits.
Learning and Organization
Firms can take steps to improve learning and the retention of knowledge in the organization. Firms can facilitate the adoption and use of newly learned ideas by encouraging the sharing of information, establishing work rules that include the new ideas, and reducing turnover. Lanier Benkard argues that labor policies at Lockheed prevented the airframe manufacturer from fully exploiting learning opportunities in the production of the L-1011 TriStar.12 Its union contract required Lockheed to promote experienced line workers to management, while simultaneously upgrading workers at lower levels. This produced a domino effect whereby as many as 10 workers changed jobs when one was moved to a management position. As a result, workers were forced to relearn tasks that their higher-ranking coworkers had already mastered. Benkard estimates that this and related policies reduced labor productivity at Lockheed by as much as 40 to 50 percent annually.
While codifying work rules and reducing job turnover facilitates retention of knowledge, it may stifle creativity. At the same time, there are instances where workerspecific learning is too complex to transmit across the firm. Examples include many professional services, in which individual knowledge of how to combine skills in functional areas with specific and detailed knowledge of particular clients may give individuals advantages that they cannot easily pass along to others. Clearly, an important skill of managers is to find the correct balance between stability and change so as to maximize the benefits of learning.
Managers should also draw a distinction between firm-specific and task-specific learning. If learning is task-specific rather than firm-specific, then workers who acquire skill through learning may be able to shop around their talents and capture the value for themselves in the form of higher wages. When learning is firm-specific, worker knowledge is tied to their current employment, and the firm will not have to raise wages as the workers become more productive. Managers should encourage