

The Learning Curve • 81
firm-specific learning, but must usually rely on their judgment to determine if learning is firm or task-specific.
The Learning Curve versus Economies of Scale
Economies of learning differ from economies of scale. Economies of scale refer to the ability to perform an activity at a lower unit cost when it is performed on a larger scale at a particular point in time. Learning economies refer to reductions in unit costs due to accumulating experience over time and can be independent of current scale of the activity. Economies of scale may be substantial even when learning economies are minimal. This is likely to be the case in simple capitalintensive activities, such as two-piece aluminum can manufacturing. Similarly, learning economies may be substantial even when economies of scale are minimal. This is likely to be the case in complex labor-intensive activities, such as the practice of antitrust law.
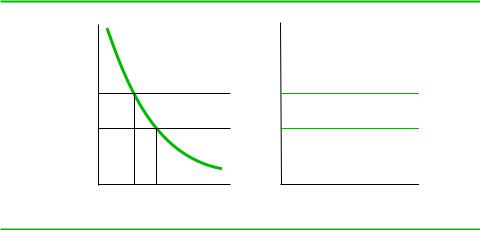
Figure 2.8 illustrates how one can have learning economies without economies of scale. The left side of the figure shows a typical learning curve, with average costs declining with cumulative experience. The right side shows two average cost curves, for different experience levels. Both average cost curves are perfectly flat, indicating that there are no economies of scale. Suppose that the firm under consideration enters a given year of production with cumulative experience of Q1. According to the learning curve, this gives it an average cost level of AC1. This remains constant regardless of current output because of constant returns to scale. Entering the next year of production, the firm has cumulative output of Q2. Its experiences in the previous year enable the firm to revamp its production techniques. In thus moving down the learning curve, it can enjoy an average cost level of AC2 in the next year of production.
FIGURE 2.8
Learning Economies When Scale Economies Are Absent
$ Per unit
AC1
AC2
Learning Curve
$ Per unit
Average Cost Curve
AC1
AC2
Q1 Q2 |
Output per year |
Cumulative output |
|
It is not necessary to have economies of scale to realize learning economies. The production process depicted here shows constant returns to scale, as evidenced by the flat average cost curves, which show output within a given year. The level of average cost falls with cumulative experience across several years, however, as shown by the learning curve.

82 • Chapter 2 • The Horizontal Boundaries of the Firm
Managers who do not correctly distinguish between economies of scale and learning may draw incorrect inferences about the benefits of size in a market. For example, if a large firm has lower unit costs because of economies of scale, then any cutbacks in production volume will raise unit costs. If the lower unit costs are the result of learning, the firm may be able to cut current volume without necessarily
EXAMPLE 2.4 THE PHARMACEUTICAL MERGER WAVE
Beginning in the 1990s, pharmaceutical companies faced an unprecedented strategic challenge. The growth of managed care in the United States and the tightening of government health care budgets in other nations forced manufacturers to lower prices on many drugs. Traditional research pipelines began to dry up, while the advent of biotechnology promised new avenues for drug discovery coupled with new sources of competition. In response to these pressures, the pharmaceutical industry underwent a remarkable wave of consolidation, with the total value of merger and acquisition activity exceeding $500 billion. As a result, the combined market shares of the 10 largest firms has grown from 20 percent to more than 50 percent. Using almost any yardstick, we can view Glaxo’s 2000 acquisition of SmithKline Beecham and Pfizer’s 2003 acquisition of Pharmacia as among the largest in business history.
Industry analysts point out three potential rationales for consolidation. One cynical view is that executives at struggling pharmaceutical companies are buying the research pipelines of more successful rivals merely to save their jobs. Another potential rationale is to make more efficient use of sales personnel. Many pharmaceutical firms spend more money on sales than they do on R&D. Although pharmaceutical “direct to consumer” advertising has received a lot of attention lately, drug makers spend much more money on traditional advertising in medical journals and especially on “detailing.” Detailing is when sales personnel visit doctors and hospitals to describe the benefits of new drugs and share data on efficacy and side effects. Detailers spend most of their time on the road, creating an obvious opportunity for scale economies. A detailer who can offer several cardiovascular drugs to a cardiologist will have a much
higher ratio of selling time to traveling time. Why have two detailers from two companies visiting the same cardiologist when one will do?
Perhaps the most common explanation offered for the merger wave is to exploit economies of scale in R&D. As we discuss in the accompanying text, there are conflicting theories as to whether bigger firms will be more innovative or will innovate at lower cost. The theoretical considerations apply especially well in pharmaceutical R&D, and those in the industry who bank on achieving greater research effectiveness through scale economies in R&D may not have solid footing.
Two recent studies examine some of these potential scale economies.13 Danzon, Epstein, and Nicholson found that acquirers tended to have older drug portfolios, lending some support to the cynical explanation for acquisitions. In contrast, targets had average-to-possibly- slightly younger portfolios. Combined sales after the merger seem to be slightly below premerger sales levels, which may reflect the weak portfolios of the acquirers. Addressing scale economies, they find that two years after a merger, the number of employees has fallen by about 6 percent. This finding is consistent with economies of scale in sales. Carmine Ornaghi examined R&D productivity, as measured by R&D spending and by the number of patents, finding that merged companies kept R&D spending flat and generated fewer patents after merging, while similar companies that remained independent increased R&D spending and generated about the same number of patents over the time period. Taken together, these findings suggest that mergers among pharmaceutical firms may have led to lower sales costs but almost surely did not generate increased research productivity.