

336—Chapter 11. Series
Block Length
By default, sets the block length to 1, meaning that we draw one observation at a time from the input sample. If you specify a block length larger than 1, EViews will draw blocks of consecutive rows of the specified length. The blocks drawn in the procedure form a set of overlapping moving blocks in the input sample. The drawn blocks will be appended one after the other in the output series until it fills the output sample (the final block will be truncated if the block size is not an integer multiple of the output sample size). Block resampling with a block length larger than 1 makes the most sense when resampling time series data.
Block resampling requires a continuous output sample. Therefore a block length larger than 1 cannot be used when the output sample contains “gaps” or when you have selected the Exclude NAs from draws but copy NA rows to output option. If you choose the
Exclude NAs from draws option and the block length is larger than 1, the input sample will shrink in the presence of NAs in order to ensure that there are no missing values in any of the drawn blocks.
Seasonal Adjustment
Time series observed at quarterly and monthly frequencies often exhibit cyclical movements that recur every month or quarter. For example, ice cream sales may surge during summer every year and toy sales may reach a peak every December during Christmas sales. Seasonal adjustment refers to the process of removing these cyclical seasonal movements from a series and extracting the underlying trend component of the series.
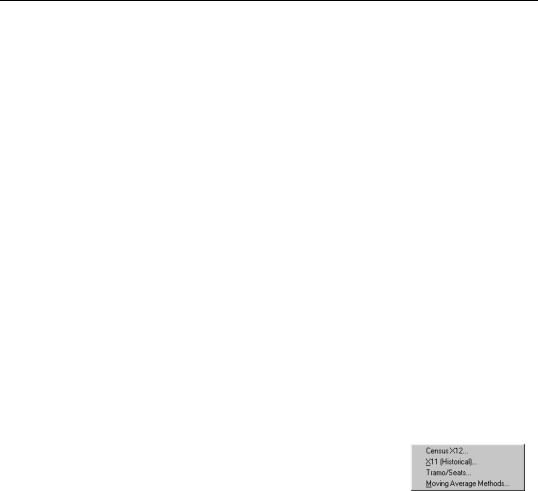
The EViews seasonal adjustment procedures are available only for quarterly and monthly series. To seasonally adjust a series, click on Proc/Seasonal Adjustment in the series window toolbar and select the adjustment method from the submenu entries
(Census X11, X11 (Historical), Tramo/Seats or Moving Average Methods).
Census X12
EViews provides a convenient front-end for accessing the U.S. Census Bureau’s X12 seasonal adjustment program from within EViews. The X12 seasonal adjustment program X12A.EXE is publicly provided by the Census and is installed in your EViews directory.
When you request X12 seasonal adjustment from EViews, EViews will perform all of the following steps:
•write out a specification file and data file for the series.
•execute the X12 program in the background, using the contents of the specification file.
Seasonal Adjustment—337
• read back the output file and saved data into your EViews workfile.
The following is a brief description of the EViews menu interface to X12. While some parts of X12 are not available via the menus, EViews also provides a more general command interface to the program (see x12 (p. 550) of the Command and Programming Reference).
Users who desire a more detailed discussion of the X12 procedures and capabilities should consult the Census Bureau documentation. The full documentation for the Census program, X12-ARIMA Reference Manual, can be found in the DOCS subdirectory of your EViews directory in the PDF files (FINALPT1.PDF and FINALPT2.PDF).
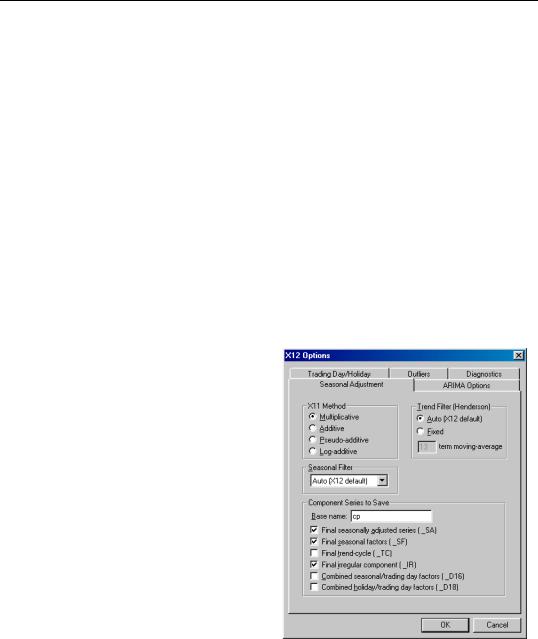
To call the X12 seasonal adjustment procedure, select Proc/Seasonal Adjustment/Census X12... from the series window menu. A dialog will open with several tabs for setting the X12 options for seasonal adjustment, ARIMA estimation, trading day/holiday adjustment, outlier handling, and diagnostic output.
It is worth noting that when you open the X12 dialog, the options will be set to those from the previously executed X12 dialog. One exception to this rule is the outlier list in the Outliers tab, which will be cleared unless the previous seasonal adjustment was performed on the same series.
Seasonal Adjustment Options
X11 Method specifies the form of the seasonal adjustment decomposition. A description of the four choices can be found in pages 75-77 of the X12-ARIMA Reference Manual. Be aware that the Pseudo-additive method must be accompanied by an ARIMA specification (see “ARIMA Options” on page 339 for details on specifying the form of your ARIMA).
Note that the multiplicative, pseudoadditive, and log-additive methods do not allow for zero or negative data.
The Seasonal Filter drop-down box allows you to select a seasonal moving average filter to be used when estimating the seasonal factors. The default Auto
(X12 default) setting is an automatic procedure based on the moving seasonality ratio. For details on the remaining seasonal filters, consult the X12-ARIMA Reference Manual. To approximate the results from the previous X11 program’s default filter, choose the X11default option. You should note the following:

338—Chapter 11. Series
•The seasonal filter specified in the dialog is used for all frequencies. If you wish to apply different filters to different frequencies, you will have to use the more general X12 command language described in detail in x12 (p. 550) of the Command and Programming Reference.
•X12 will not allow you to specify a 3 × 15 seasonal filter for series shorter than 20 years.
•The Census Bureau has confirmed that the X11-default filter option does not produce results which match those obtained from the previous version of X11. The difference arises due to changes in extreme value identification, replacement for the latest values, and the way the end weights of the Henderson filter is calculated. For comparability, we have retained the previous (historical) X11 routines as a separate procedure (see “Census X11 (Historical)” on page 344). Please note that the old X11 program is year 2000 compliant only through 2100 and supports only DOS 8.3 format filenames.
The Trend Filter (Henderson) settings allow you to specify the number of terms in the Henderson moving average used when estimating the trend-cycle component. You may use any odd number greater than 1 and less than or equal to 101. The default is the automatic procedure used by X12.
You must provide a base name for the series stored from the X12 procedure in the Name for Adjusted Series/Component Series to Save edit box. To save a series returned from X12 in the workfile, click on the appropriate check box. The saved series will have the indicated suffix appended to the base name. For example, if you enter a base name of “X” and ask to save the seasonal factors (“_SF”), EViews will save the seasonal factors as X_SF.
You should take care when using long base names, since EViews must be able to create a valid series using the base name and any appended Census designations. In interactive mode, EViews will warn you that the resulting name exceeds the maximum series name length; in batch mode, EViews will create a name using a truncated base name and appended Census designations.
The dialog only allows you to store the four most commonly used series. You may, however, store any additional series as listed on Table 6-8 (p. 74) of the X12-ARIMA Reference Manual by running X12 from the command line (see x12 (p. 550) of the Command and Programming Reference).
ARIMA Options
The X12 program also allows you to fit ARMA models to the series prior to seasonal adjustment. You can use X12 to remove deterministic effects (such as holiday and trading day effects) prior to seasonal adjustment and to obtain forecasts/backcasts that can be used for
Seasonal Adjustment—339
seasonal adjustment at the boundary of the sample. To fit an ARMA, select the ARIMA Options tab in the X12 Options dialog and fill in the desired options.
The Data Transformation setting allows you to transform the series before fitting an ARMA model. The Auto option selects between no transformation and a log transformation based on the Akaike information criterion. The Logistic option transforms the series y to log ( y ⁄ ( 1 − y) ) and is defined only for series with values that are strictly between 0 and 1. For the Box-Cox option, you must provide the parameter value λ for the transformation
log ( yt) |
|
if λ = 0 |
|
|
2 + ( yλt |
|
(11.30) |
λ |
− 1 ) ⁄ λ |
if λ ≠ 0 |
|
See the “transform spec” (pp. 60–67) of the X12-ARIMA Reference Manual for further details.
ARIMA Specification allows you to choose between two different methods for specifying your ARIMA model. The Specify in-line option asks you to provide a single ARIMA specification to fit. The X12 syntax for the ARIMA specification is different from the one used by EViews and follows the Box-Jenkins notation “(p d q)(P D Q)” where:
p |
nonseasonal AR order |
|
|
d |
order of nonseasonal differences |
|
|
q |
nonseasonal MA order |
|
|
P |
(multiplicative) seasonal AR order |
|
|
D |
order of seasonal differences |
|
|
Q |
(multiplicative) seasonal MA order |
|
|
The default specification “(0 1 1)(0 1 1)” is the seasonal IMA model: |
|
||
|
( 1 − L )( 1 − Ls) yt = ( 1 − θ1L) ( 1 − θsLs) t |
(11.31) |
|
Here are some other examples ( L is the lag operator): |
|
||
|
|
|
|
|
(1 0 0) |
( 1 − φL) yt = t |
|
|
(0 1 1) |
( 1 − L) yt = ( 1 − θL) t |
|
|
(1 0 1)(1 0 0) |
( 1 − φ1L) ( 1 − φsLs) yt = ( 1 − θL) t where |
|
|
|
s = 4 for quarterly data and s = 12 for monthly |
|
|
|
data. |
|
|
|
|
|
You can skip lags using square brackets and explicitly specify the seasonal order after the parentheses:

340—Chapter 11. Series
([2 3] 0 0) |
( 1 |
− φ2L2 − φ3L3) yt = t |
(0 1 1)12 |
( 1 |
− L12) yt = ( 1 − θL12) t |
|
|
|
See the X12-ARIMA Reference Manual (pp. 110–114) for further details and examples of ARIMA specification in X12. Note that there is a limit of 25 total AR, MA, and differencing coefficients in a model and that the maximum lag of any AR or MA parameter is 24 and the maximum number of differences in any ARIMA factor is 3.
Alternatively, if you choose Select from file, X12 will select an ARIMA model from a set of possible specifications provided in an external file. The selection process is based on a procedure developed by Statistics Canada for X11-ARIMA/88 and is described in the X12ARIMA Reference Manual (p. 133). If you use this option, you will be asked to provide the name of a file that contains a set of possible ARIMA specifications. By default, EViews will use a file named X12A.MDL that contains a set of default specifications provided by Census (the list of specifications contained in this file is given below).
To provide your own list in a file, the ARIMA specification must follow the X12 syntax as explained in the ARIMA Specification section above. You must specify each model on a separate line, with an “X” at the end of each line except the last. You may also designate one of the models as a “default” model by marking the end of a line with an asterisk “*” instead of “X”; see p. 133 of the X12-ARIMA Reference Manual for an explanation of the use of a default model. To ensure that the last line is read, it should be terminated by hitting the return key.
For example, the default file (X12A.MDL) provided by X12 contains the following specifications:
(0 1 1)(0 1 1) * (0 1 2)(0 1 1) x (2 1 0)(0 1 1) x (0 2 2)(0 1 1) x (2 1 2)(0 1 1)
There are two additional options for Select from file. Select best checks all models in the list and looks for the model with minimum forecast error; the default is to select the first model that satisfies the model selection criteria. Select by out-of-sample-fit uses out-of- sample forecast errors (by leaving out some of the observations in the sample) for model evaluation; the default is to use within-sample forecast errors.
The Regressors option allows you to include prespecified sets of exogenous regressors in your ARIMA model. Simply use the checkboxes to specify a constant term and/or (centered) seasonal dummy variables. Additional predefined regressors to capture trading day
Seasonal Adjustment—341
and/or holiday effects may be specified using the Trading Day/Holiday tab. You can also use the Outlier tab to capture outlier effects.
Trading Day and Holiday Effects
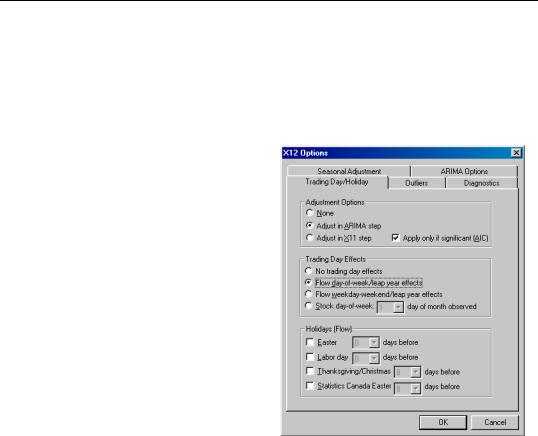
X12 provides options for handling trading day and/or holiday effects. To access these options, select the Trading Day/Holiday tab in the X12 Options dialog.
As a first step you should indicate whether you wish to make these adjustments in the ARIMA step or in the X11 seasonal adjustment step. To understand the distinction, note that there are two main procedures in the X12 program: the X11 seasonal adjustment step, and the ARIMA estimation step. The X11 step itself consists of several steps that decompose the series into the trend/ cycle/irregular components. The X12 procedure may therefore be described as follows:
•optional preliminary X11 step (remove trading day/holiday effects from series, if requested).
•ARIMA step: fit an ARIMA model (with trading/holiday effects, if
specified) to the series from step 1 or to the raw series.
•X11 step: seasonally adjust the series from step 2 using backcasts/forecasts from the ARIMA model.
While it is possible to perform trading day/holiday adjustments in both the X11 step and the ARIMA step, Census recommends against doing so (with a preference to performing the adjustment in the ARIMA step). EViews follows this advice by allowing you to perform the adjustment in only one of the two steps.
If you choose to perform the adjustment in the X11 step, there is an additional setting to consider. The checkbox Apply only if significant (AIC) instructs EViews to adjust only if warranted by examination of the Akaike information criterion.
It is worth noting that in X11, the significance tests for use of trading day/holiday adjustment are based on an F-test. For this, and a variety of other reasons the X12 procedure with “X11 settings” will not produce results that match those obtained from historical X11.

342—Chapter 11. Series
To obtain comparable results, you must use the historical X11 procedure (see “Census X11 (Historical)” on page 344).
Once you select your adjustment method, the dialog will present additional adjustment options:
•Trading Day Effects — There are two options for trading day effects, depending on whether the series is a flow series or a stock series (such as inventories). For a flow series, you may adjust for day-of-week effects or only for weekday-weekend contrasts. Trading day effects for stock series are available only for monthly series and the day of the month in which the series is observed must be provided.
•Holiday Effects — Holiday effect adjustments apply only to flow series. For each holiday effect, you must provide a number that specifies the duration of that effect prior to the holiday. For example, if you select 8, the level of daily activity changes on the seventh day before the holiday and remains at the new level until the holiday (or a day before the holiday, depending on the holiday).
Note that the holidays are as defined for the United States and may not apply to other countries. For further details, see the X12-ARIMA Reference Manual, Tables 6–15 (p. 94) and 6–18 (p. 133).
Outlier Effects
As with trading day/holiday adjustments, outlier effects can be adjusted either in the X11 step or in the ARIMA step (see the discussion in “Trading Day and Holiday Effects” on page 341). However, outlier adjustments in the X11 step are done only to robustify the trading day/holiday adjustments in the X11 step. Therefore, in order to perform outlier adjustment in the X11 step, you must perform trading day/holiday adjustment in the X11 step. Only additive outliers are allowed in the X11 step; other types of outliers are available in the ARIMA step. For further information on the various types of outliers, see the X12ARIMA Reference Manual, Tables 6–15 (p. 94) and 6–18 (p. 133).
If you do not know the exact date of an outlier, you may ask the program to test for an outlier using the built-in X12 diagnostics.
Diagnostics
This tab provides options for various diagnostics. The Sliding spans and Historical revisions options test for stability of the adjusted series. While Sliding spans checks the change in adjusted series over a moving sample of fixed size (overlapping subspans), Historical revisions checks the change in adjusted series over an increasing sample as new observations are added to the sample. See the X12-ARIMA Reference Manual for further details and references of the testing procedure. You may also choose to display various diagnostic output:

Seasonal Adjustment—343
•Residual diagnostics will report standard residual diagnostics (such as the autocorrelation functions and Q-statistics). These diagnostics may be used to assess the adequacy of the fitted ARIMA model. Note that this option requires estimation of an ARIMA model; if you do not provide an ARIMA model nor any exogenous regressors (including those from the Trading day/Holiday or Outlier tab), the diagnostics will be applied to the original series.
•Outlier detection automatically detects and reports outliers using the specified ARIMA model. This option requires an ARIMA specification or at least one exogenous regressor (including those from the Trading day/Holiday or Outlier tab); if no regression model is specified, the option is ignored.
•Spectral plots displays the spectra of the differenced seasonally adjusted series (SP1) and/or of the outlier modified irregular series (SP2). The red vertical dotted lines are the seasonal frequencies and the black vertical dashed lines are the trading day frequencies. If you observe peaks at these vertical lines it is an indication of inadequate adjustment. For further details, see Findley et al. (1998, section 3.1). If you request this option, data for the spectra will be stored in a matrix named seriesname_SA_SP1 and seriesname_SA_SP2 in your workfile. The first column of these matrices are the frequencies and the second column are 10 times the log spectra at the corresponding frequency.
X11/X12 Troubleshooting
The currently shipping versions of X11 and X12 as distributed by the Census have the following limitation regarding directory length. First, you will not be able to run X11/X12 if you are running EViews from a shared directory on a server which has spaces in its name. The solution is to map that directory to a letter drive on your local machine. Second, the temporary directory path used by EViews to read and write data cannot have more than four subdirectories. This temporary directory used by EViews can be changed by selecting Options/File Locations.../Temp File Path in the main menu. If your temporary directory has more than four subdirectories, change the Temp File Path to a writeable path that has fewer subdirectories. Note that if the path contains spaces or has more than 8 characters, it may appear in shortened form compatible with the old DOS convention.
344—Chapter 11. Series
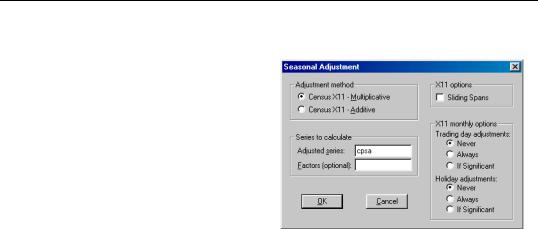
Census X11 (Historical)
The Census X11.2 methods (multiplicative and additive) are the standard methods used by the U.S. Bureau of Census to seasonally adjust publicly released data. The X11 routines are separate programs provided by the Census and are installed in the EViews directory in the files X11Q2.EXE and X11SS.EXE. The documentation for these programs can also be found in your EViews directory as text files X11DOC1.TXT through X11DOC3.TXT.
The X11 programs may be executed directly from DOS or from within EViews. If you run the X11 programs from within EViews, the adjusted series and the factor series will be automatically imported into your EViews workfile. X11 summary output and error messages will also be displayed in the series window at the end of the procedure.
The X11 method has many options, the most important of which are available in the Seasonal Adjustment dialog. However, there are other options not available in the EViews dialog; to use these other options, you should run the X11 programs from the DOS command line. All options available in the X11 methods are described in the X11DOC text files in your EViews directory.
You should note that there is a limit on the number of observations that you can seasonally adjust. X11 only works for quarterly and monthly frequencies, requires at least four full years of data, and can adjust only up to 20 years of monthly data and up to 30 years of quarterly data.
Tramo/Seats
Tramo (“Time Series Regression with ARIMA Noise, Missing Observations, and Outliers”) performs estimation, forecasting, and interpolation of regression models with missing observations and ARIMA errors, in the presence of possibly several types of outliers. Seats (“Signal Extraction in ARIMA Time Series”) performs an ARIMA-based decomposition of an observed time series into unobserved components. The two programs were developed by Victor Gomez and Agustin Maravall.
Used together, Tramo and Seats provide a commonly used alternative to the Census X12 program for seasonally adjusting a series. Typically, individuals will first “linearize” a series using Tramo and will then decompose the linearized series using Seats.
Seasonal Adjustment—345
EViews provides a convenient front-end to the Tramo/Seats programs as a series proc. Simply select Proc/Seasonal Adjustment/Tramo Seats... and fill out the dialog. EViews writes an input file which is passed to Tramo/Seats via a call to a .DLL, and reads the output files from Tramo/Seats back into EViews (note: since EViews uses a new .DLL version of Tramo/Seats, results may differ from the older DOS version of the program).
Since EViews only provides an interface to an external program, we cannot provide any technical details or support for Tramo/Seats itself. Users who are interested in the technical details should consult the original documentation Instructions for the User which is provided as a .PDF file in the DOCS/TRAMOSEATS subdirectory of your EViews directory.
Dialog Options
The Tramo/Seats interface from the dialog provides access to the most frequently used options. Users who desire more control over the execution of Tramo/Seats may use the command line form of the procedure as documented in tramoseats (p. 512) in the Command and Programming Reference.
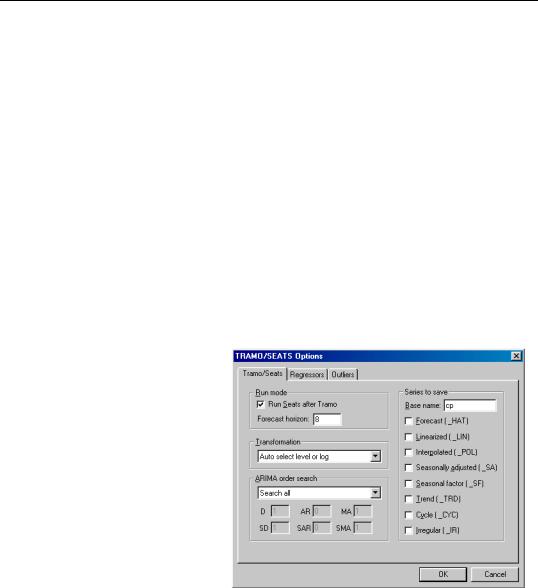
The dialog contains three tabs. The main tab controls the basic specification of your Tramo/Seats run.
•Run mode: You can choose either to run only Tramo or you can select the Run Seats after Tramo checkbox to run both. In the latter case, EViews uses the input file produced by Tramo to run Seats. If you wish to run only Seats, you must use the command line interface.
•Forecast horizon: You may set the number of periods to forecast outside the cur-
rent sample. If you choose a number smaller than the number of forecasts required to run Seats, Tramo will automatically lengthen the forecast horizon as required.
•Transformation: Tramo/Seats is based on an ARIMA model of the series. You may choose to fit the ARIMA model to the level of the series or to the (natural) log of the series, or you select Auto select level or log. This option automatically chooses between the level model and the log transformed model using results from a

346—Chapter 11. Series
trimmed range-mean regression; see the original Tramo/Seats documentation for further details.
•ARIMA order search: You may either specify the orders of the ARIMA model to fit or ask Tramo to search for the “best” ARIMA model. If you select Fix order in the combo box and specify the order of all of the ARIMA components, Tramo will use the specified values for all components where the implied ARIMA model is of the form:
yt = xt′β + ut
φ( L) δ( L) ut = θ( L) t
δ( L) = ( 1 − L)D( 1 − Ls)SD
φ( L) = ( 1 + φ1L + … + φARLAR) ( 1 + Φ1Ls + … + ΦSAR( Ls)SAR)
θ( L) = ( 1 + θ1L + … + θMALMA) ( 1 + Θ1Ls + … + ΘSMA( Ls)SMA)
with seasonal frequency s . When you fix the order of your ARIMA you should specify non-negative integers in the edit fields for D , SD , AR , SAR , MA , and
SMA .
Alternatively, if you select Fix only difference orders, Tramo will search for the best ARMA model for differenced data of the orders specified in the edit fields.
You can also instruct Tramo to choose all orders. Simply choose Search all or Search all and unit complex roots to have Tramo find the best ARIMA model subject to limitations imposed by Tramo. The two options differ in the handling of complex roots. Details are provided in the original Tramo/Seats documentation.
Warning: if you choose to run Seats after Tramo, note that Seats has the following limit on the ARIMA orders: D ≤ 3 , AR ≤ 3 , MA ≤ 3 , SD ≤ 2 , SAR ≤ 1 ,
SMA ≤ 1 .
•Series to Save: To save series output by Tramo/Seats in your workfile, provide a valid base name and check the series you wish to save. The saved series will have a postfix appended to the basename as indicated in the dialog. If the saved series contains only missing values, it indicates that Tramo/Seats did not return the requested series; see “Trouble Shooting” on page 349.
If Tramo/Seats returns forecasts for the selected series, EViews will append them at the end of the stored series. The workfile range must have enough observations after the current workfile sample to store these forecasts.
If you need access to series that are not listed in the dialog options, see “Trouble Shooting” on page 349.

Seasonal Adjustment—347
•User specified exogenous series: You may provide your own exogenous series to be used by Tramo. These must be a named series or a group in the current workfile and should not contain any missing values in the current sample and the forecast period.
If you selected a trading day adjustment option, you have the option of specifying exogenous series to be treated as a holiday series. The specification of the holiday series will depend on whether you chose a weekday/weekend adjustment or a 5-day adjustment. See the original Tramo/Seats documentation for further details.
If you are running Seats after Tramo, you must specify which component to allocate the regression effects. The Tramo default is to treat the regression effect as a separate additional component which is not included in the seasonally adjusted series.
EViews will write a separate data file for each entry in the exogenous series list which is passed to Tramo. If you have many exogenous series with the same specification, it is best to put them into one group.
•Easter/Trading day adjustment: These options are intended for monthly data; see the original Tramo/Seats documentation for details.
•Outlier detection: You may either ask Tramo to automatically detect possible outliers or you can specify your own outlier but not both. If you wish to do both, create a series corresponding to the known outlier and pass it as an exogenous series.
Similarly, the built-in intervention option in Tramo is not supported from the dialog. You may obtain the same result by creating the intervention series in EViews and passing it as an exogenous series. See the example below.
The original Tramo/Seats documentation provides definitions of the various outlier types and the method to detect them.
After you click OK, the series window will display the text output returned by Tramo/ Seats. If you ran both Tramo and Seats, the output from Seats is appended at the end of Tramo output. Note that this text view will be lost if you change the series view. You should freeze the view into a text object if you wish to refer to the output file without having to run Tramo/Seats again.
It is worth noting that when you run Tramo/Seats, the dialog will generally contain the settings from the previous run of Tramo/Seats. A possible exception is the user specified outlier list which is cleared unless Tramo/Seats is called on the previously used series.
Comparing X12 and Tramo/Seats
Both X12 and Tramo/Seats are seasonal adjustment procedures based on extracting components from a given series. Methodologically, X12 uses a non-parametric moving average based method to extract its components, while Tramo/Seats bases its decomposition on an estimated parametric ARIMA model (the recent addition of ARIMA modelling in X12

348—Chapter 11. Series
appears to be used mainly to identify outliers and to obtain backcasts and forecasts for end-of-sample problems encountered when applying moving average methods.)
For the practitioner, the main difference between the two methods is that X12 does not allow missing values while Tramo/Seats will interpolate the missing values (based on the estimated ARIMA model). While both handle quarterly and monthly data, Tramo/Seats also handles annual and semi-annual data. See the sample programs in the Example Files directory for a few results that compare X12 and Tramo/Seats.
Trouble Shooting
Error handling
As mentioned elsewhere, EViews writes an input file which is passed to Tramo/Seats via a call to a .DLL. Currently the Tramo/Seats .DLL does not return error codes. Therefore, the only way to tell that something went wrong is to examine the output file. If you get an error message indicating that the output file was not found, the first thing you should do is to check for errors in the input file.
When you call Tramo/Seats, EViews creates two subdirectories called Tramo and Seats in a temporary directory. This temporary directory is taken from the global option Options/File Locations.../Temp File Path (note that long directory names with spaces may appear in shortened DOS form). The Temp File Path can be retrieved in a program by a call to the function @temppath (p. 641) as described in the Command and Programming Reference.
The Tramo input file written by EViews will be placed in the subdirectory TRAMO and is named SERIE. A Seats input file written by Tramo is also placed in subdirectory TRAMO and is named SEATS.ITR.
The input file used by Seats is located in the SEATS subdirectory and is named SERIE2. If Seats is run alone, then EViews will create the SERIE2 file. When Tramo and Seats are called together, the Tramo file SEATS.ITR is copied into SERIE2.
If you encounter the error message containing the expression “output file not found”, it probably means that Tramo/Seats encountered an error in one of the input files. You should look for the input files SERIE and SERIE2 in your temp directories and check for any errors in these files.
Retrieving additional output
The output file displayed in the series window is placed in the OUTPUT subdirectory of the TRAMO and/or SEATS directories. The saved series are read from the files returned by Tramo/Seats that are placed in the GRAPH subdirectories. If you need to access other data files returned by Tramo/Seats that are not supported by EViews, you will have to read them back into the workfile using the read command from these GRAPH subdirectories. See the PDF documentation file for a description of these data file formats.
Seasonal Adjustment—349
Warning: if you wish to examine these files, make sure to read these data files before you run the next Tramo/Seats procedure. EViews will clear these subdirectories before running the next Tramo/Seats command (this clearing is performed as a precautionary measure so that Tramo/Seats does not read results from a previous run).
Moving Average Methods
Ratio to moving average—multiplicative
The algorithm works as follows. Denote the series to be filtered by yt .
1. First compute the centered moving average of yt as:
|
|
|
|
xt |
|
( 0.5 yt + 6 + … + yt + … 0.5yt − 6) ⁄ 12 |
if monthly (11.32) |
= |
|||
|
|
( 0.5yt + 2 + yt + 1 + yt + yt−1 + 0.5 yt − 1) ⁄ 4 |
if quarterly |
|
|
|
|
2.Take the ratio τt = yt ⁄ xt .
3.Compute the seasonal indices. For monthly series, the seasonal index im for month m is the average of τt using observations only for month m . For quarterly series, the seasonal index iq for quarter q is the average of τt using observations only for quarter q .
4.We then adjust the seasonal indices so that they multiply to one. This is done by computing the seasonal factors as the ratio of the seasonal index to the geometric mean of the indices:
|
|
|
⁄ ( 12 |
|
|
|
|
… i |
|
) |
|
|
i |
|
i |
1 |
i |
2 |
12 |
if monthly |
|||
s = |
|
m |
|
|
|
|
|
(11.33) |
|||
|
|
iq ⁄ ( 4 |
i1i2i3i4) |
|
if quarterly |
||||||
|
|
|
|||||||||
5.These s are the reported scaling factors in the series window and are saved as series
if you provide a name in the field box. The interpretation is that the series y is sj percent higher in period j relative to the adjusted series.
6.The seasonally adjusted series is obtained by dividing yt by the seasonal factors sj .
Difference from moving average—additive
Suppose that we wish to filter yt .
1.First compute the centered moving average of yt as in Equation (11.32) on page 350.
2.Take the difference dt = yt − xt .