

Sources and Properties of Biomedical Signals |
|
11 |
||
|
|
Action potentials |
|
SA node AP |
|
|
|
|
AV node AP |
|
|
|
|
t |
Sup. vena cava |
|
|
Atrial muscle AP |
|
SA node |
LA |
− 90 mV |
|
|
AV node |
|
|
||
|
|
|
||
RA |
|
Delays in |
|
Common bundle AP |
|
|
|
||
|
|
conduction |
Bundle branch AP |
|
|
|
bundles |
|
Purkinje fiber AP |
|
|
LV |
|
|
|
|
|
|
|
|
RV |
−95 mV |
|
|
|
|
|
|
|
|
|
+20 mV |
|
Ventricular AP |
|
|
0 mV |
|
|
|
> 150 V/sec. |
|
− 90 mV |
|
|
|
R |
|
|
ECG |
|
|
(Lead III) |
|
0 |
P |
T |
|
||
|
Q |
S |
|
|
ca. 1 sec |
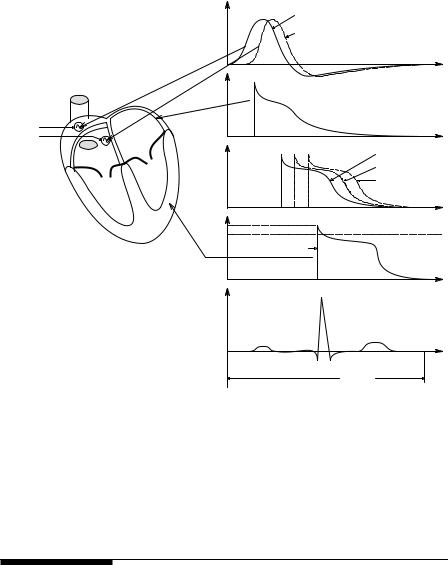
FIGURE 1.4
Schematic cut-away of a mammalian heart showing the SA and AV node pacemakers, as well as intracellular action potentials from different locations in the heart. Bottom trace is a typical lead III skin surface-recorded ECG waveform.
and otherwise not grounded. Other biopotential amplifiers used in a clinical or research setting with humans, such as for measurement of EEG, EMG, ERG, ECoG, etc., must also have galvanic isolation.
1.6Other Biopotentials
1.6.1Introduction
Many other biopotentials are measured for research and clinical purposes. These include the electroencephalogram (EEG); electroretinogram (ERG); electrooculogram (EOG); and electrocochleogram (ECoG) (Northrop, 2002). All of these signals are low amplitude (hundreds of microvolts at peak) and contain primarily low frequencies (0.01 to 100 Hz).
© 2004 by CRC Press LLC
12 |
Analysis and Application of Analog Electronic Circuits |
1.6.2EEGs
The electroencephalogram is used to diagnose brain injuries and brain tumors noninvasively, as well as in neuropsychology research. Electroencephalograms are generally recorded from the scalp, which means the underlying, cortical brain electrical activity must pass through the pia and dura mater membranes, cerebrospinal fluid, skull, and scalp. Considerable attenuation and spatial averaging occurs due to these structures relative to the electrical activity, which can be recorded directly from the brain’s surface with wick electrodes. The largest EEG potentials recorded on the scalp are approximately 150 μV at peak. In an attempt to localize sites of EEG activity on the brain’s surface, multiple electrode EEG recordings are made from the scalp. The standard 10 to 20 EEG electrode array uses 19 electrodes; some electrode arrays used in brain research use 128 electrodes (Northrop, 2002).
EEGs have traditionally been divided into four frequency bands:
•Delta waves have the largest amplitudes and lowest frequencies (≤3.5 Hz); they occur in adults in deep sleep.
•Theta waves are large-amplitude, low-frequency voltages (3.5 to 7.5 Hz) and are seen in sleep in adults and in prepubescent children.
•The spectra of alpha waves lie between 7.5 and 13 Hz and their amplitudes range from 20 to 200 μV. Alpha waves are recorded from adults who are conscious but relaxed with the eyes closed. Alpha activity disappears when the eyes are open and the subject focuses on a task. Alpha waves are best recorded from posterior lateral portions of the scalp.
•Beta waves are defined for frequencies from 13 to 50 Hz and are most easily found in the parietal and frontal regions of the scalp. Beta waves are subdivided into types I and II: type I disappears and type II appears during intense mental activity (Webster, 1992).
EEG amplifiers must work with low-frequency, low amplitude signals; consequently, they must be low noise types with low 1/f noise spectrums. EEG amplifiers can be reactively coupled; their –3-dB frequencies should be about 0.2 and 100 Hz. Amplifier midband gain needs to be on the order of 104 to 105.
EEG measurement also includes evoked cortical potentials used in experimental brain research. A patient is presented with a periodic stimulus, which can be auditory (a click or tone), visual (a flash of light or a tachistoscopically presented picture), tactile (a pin prick), or some other transient sensory modality. Following each stimulus, a transient EEG response is added to the ongoing EEG activity. Very often this evoked response cannot be seen on a monitor with the naked eye. Because the pass band of the evoked response is the same as the interfering or masking EEG activity, linear filtering does not help in extracting transient response. Thus, signal averaging must be used to bring forth the desired evoked transient from the unrelated, accompanying
© 2004 by CRC Press LLC