

- •Analysis and Application of Analog Electronic Circuits to Biomedical Instrumentation
- •Dedication
- •Preface
- •Reader Background
- •Rationale
- •Description of the Chapters
- •Features
- •The Author
- •Table of Contents
- •1.1 Introduction
- •1.2 Sources of Endogenous Bioelectric Signals
- •1.3 Nerve Action Potentials
- •1.4 Muscle Action Potentials
- •1.4.1 Introduction
- •1.4.2 The Origin of EMGs
- •1.5 The Electrocardiogram
- •1.5.1 Introduction
- •1.6 Other Biopotentials
- •1.6.1 Introduction
- •1.6.2 EEGs
- •1.6.3 Other Body Surface Potentials
- •1.7 Discussion
- •1.8 Electrical Properties of Bioelectrodes
- •1.9 Exogenous Bioelectric Signals
- •1.10 Chapter Summary
- •2.1 Introduction
- •2.2.1 Introduction
- •2.2.4 Schottky Diodes
- •2.3.1 Introduction
- •2.4.1 Introduction
- •2.5.1 Introduction
- •2.5.5 Broadbanding Strategies
- •2.6 Photons, Photodiodes, Photoconductors, LEDs, and Laser Diodes
- •2.6.1 Introduction
- •2.6.2 PIN Photodiodes
- •2.6.3 Avalanche Photodiodes
- •2.6.4 Signal Conditioning Circuits for Photodiodes
- •2.6.5 Photoconductors
- •2.6.6 LEDs
- •2.6.7 Laser Diodes
- •2.7 Chapter Summary
- •Home Problems
- •3.1 Introduction
- •3.2 DA Circuit Architecture
- •3.4 CM and DM Gain of Simple DA Stages at High Frequencies
- •3.4.1 Introduction
- •3.5 Input Resistance of Simple Transistor DAs
- •3.7 How Op Amps Can Be Used To Make DAs for Medical Applications
- •3.7.1 Introduction
- •3.8 Chapter Summary
- •Home Problems
- •4.1 Introduction
- •4.3 Some Effects of Negative Voltage Feedback
- •4.3.1 Reduction of Output Resistance
- •4.3.2 Reduction of Total Harmonic Distortion
- •4.3.4 Decrease in Gain Sensitivity
- •4.4 Effects of Negative Current Feedback
- •4.5 Positive Voltage Feedback
- •4.5.1 Introduction
- •4.6 Chapter Summary
- •Home Problems
- •5.1 Introduction
- •5.2.1 Introduction
- •5.2.2 Bode Plots
- •5.5.1 Introduction
- •5.5.3 The Wien Bridge Oscillator
- •5.6 Chapter Summary
- •Home Problems
- •6.1 Ideal Op Amps
- •6.1.1 Introduction
- •6.1.2 Properties of Ideal OP Amps
- •6.1.3 Some Examples of OP Amp Circuits Analyzed Using IOAs
- •6.2 Practical Op Amps
- •6.2.1 Introduction
- •6.2.2 Functional Categories of Real Op Amps
- •6.3.1 The GBWP of an Inverting Summer
- •6.4.3 Limitations of CFOAs
- •6.5 Voltage Comparators
- •6.5.1 Introduction
- •6.5.2. Applications of Voltage Comparators
- •6.5.3 Discussion
- •6.6 Some Applications of Op Amps in Biomedicine
- •6.6.1 Introduction
- •6.6.2 Analog Integrators and Differentiators
- •6.7 Chapter Summary
- •Home Problems
- •7.1 Introduction
- •7.2 Types of Analog Active Filters
- •7.2.1 Introduction
- •7.2.3 Biquad Active Filters
- •7.2.4 Generalized Impedance Converter AFs
- •7.3 Electronically Tunable AFs
- •7.3.1 Introduction
- •7.3.3 Use of Digitally Controlled Potentiometers To Tune a Sallen and Key LPF
- •7.5 Chapter Summary
- •7.5.1 Active Filters
- •7.5.2 Choice of AF Components
- •Home Problems
- •8.1 Introduction
- •8.2 Instrumentation Amps
- •8.3 Medical Isolation Amps
- •8.3.1 Introduction
- •8.3.3 A Prototype Magnetic IsoA
- •8.4.1 Introduction
- •8.6 Chapter Summary
- •9.1 Introduction
- •9.2 Descriptors of Random Noise in Biomedical Measurement Systems
- •9.2.1 Introduction
- •9.2.2 The Probability Density Function
- •9.2.3 The Power Density Spectrum
- •9.2.4 Sources of Random Noise in Signal Conditioning Systems
- •9.2.4.1 Noise from Resistors
- •9.2.4.3 Noise in JFETs
- •9.2.4.4 Noise in BJTs
- •9.3 Propagation of Noise through LTI Filters
- •9.4.2 Spot Noise Factor and Figure
- •9.5.1 Introduction
- •9.6.1 Introduction
- •9.7 Effect of Feedback on Noise
- •9.7.1 Introduction
- •9.8.1 Introduction
- •9.8.2 Calculation of the Minimum Resolvable AC Input Voltage to a Noisy Op Amp
- •9.8.5.1 Introduction
- •9.8.5.2 Bridge Sensitivity Calculations
- •9.8.7.1 Introduction
- •9.8.7.2 Analysis of SNR Improvement by Averaging
- •9.8.7.3 Discussion
- •9.10.1 Introduction
- •9.11 Chapter Summary
- •Home Problems
- •10.1 Introduction
- •10.2 Aliasing and the Sampling Theorem
- •10.2.1 Introduction
- •10.2.2 The Sampling Theorem
- •10.3 Digital-to-Analog Converters (DACs)
- •10.3.1 Introduction
- •10.3.2 DAC Designs
- •10.3.3 Static and Dynamic Characteristics of DACs
- •10.4 Hold Circuits
- •10.5 Analog-to-Digital Converters (ADCs)
- •10.5.1 Introduction
- •10.5.2 The Tracking (Servo) ADC
- •10.5.3 The Successive Approximation ADC
- •10.5.4 Integrating Converters
- •10.5.5 Flash Converters
- •10.6 Quantization Noise
- •10.7 Chapter Summary
- •Home Problems
- •11.1 Introduction
- •11.2 Modulation of a Sinusoidal Carrier Viewed in the Frequency Domain
- •11.3 Implementation of AM
- •11.3.1 Introduction
- •11.3.2 Some Amplitude Modulation Circuits
- •11.4 Generation of Phase and Frequency Modulation
- •11.4.1 Introduction
- •11.4.3 Integral Pulse Frequency Modulation as a Means of Frequency Modulation
- •11.5 Demodulation of Modulated Sinusoidal Carriers
- •11.5.1 Introduction
- •11.5.2 Detection of AM
- •11.5.3 Detection of FM Signals
- •11.5.4 Demodulation of DSBSCM Signals
- •11.6 Modulation and Demodulation of Digital Carriers
- •11.6.1 Introduction
- •11.6.2 Delta Modulation
- •11.7 Chapter Summary
- •Home Problems
- •12.1 Introduction
- •12.2.1 Introduction
- •12.2.2 The Analog Multiplier/LPF PSR
- •12.2.3 The Switched Op Amp PSR
- •12.2.4 The Chopper PSR
- •12.2.5 The Balanced Diode Bridge PSR
- •12.3 Phase Detectors
- •12.3.1 Introduction
- •12.3.2 The Analog Multiplier Phase Detector
- •12.3.3 Digital Phase Detectors
- •12.4 Voltage and Current-Controlled Oscillators
- •12.4.1 Introduction
- •12.4.2 An Analog VCO
- •12.4.3 Switched Integrating Capacitor VCOs
- •12.4.6 Summary
- •12.5 Phase-Locked Loops
- •12.5.1 Introduction
- •12.5.2 PLL Components
- •12.5.3 PLL Applications in Biomedicine
- •12.5.4 Discussion
- •12.6 True RMS Converters
- •12.6.1 Introduction
- •12.6.2 True RMS Circuits
- •12.7 IC Thermometers
- •12.7.1 Introduction
- •12.7.2 IC Temperature Transducers
- •12.8 Instrumentation Systems
- •12.8.1 Introduction
- •12.8.5 Respiratory Acoustic Impedance Measurement System
- •12.9 Chapter Summary
- •References

Noise and the Design of Low-Noise Amplifiers for Biomedical Applications |
371 |
Thus, F for this LIA architecture is found to be:
F = |
SNRin |
= |
π |
|
Bout |
= 1.23 |
Bout |
(9.126) |
|
|
23 B |
B |
|||||||
|
SNR |
out |
|
|
|
||||
|
|
|
|
|
in |
|
in |
|
|
which can be made quite small by adjusting the ratio of Bout to Bin.
As an example of signal recovery by an LIA, consider an LIA of the analog multiplier architecture. Let the signal to be measured be vs(t) = 20 ∞ 10−9 cos(2π 50 ∞ 103 t). The Gaussian white noise present with the signal has a root power spectrum of η = 4 nVRMS/ Hz. The input amplifier has a voltage gain of Kv = 104 with a 100-kHz noise and signal bandwidth. Thus, the raw input MS SNR is:
SNRin1 = |
(20 ∞ 10−9 )2 2 |
= |
2 ∞ 10−16 MSV |
= 1.25 ∞ 10−4 , or − 39 dB (9.127) |
(4 ∞ 10−9 ) ∞ 105 |
|
|||
1.6 ∞ 10−12 MSV |
If the sinusoidal signal is conditioned by an (ideal) unity-gain LPF with a Q = 50 = center freq./bandwidth, the noise bandwidth B = 50 ∞ 103/50 = 1 kHz. The MS SNR at the output of the ideal BPF is still poor:
SNR |
|
= |
2 ∞ 10−16 |
MSV |
= 1.25 |
∞ 10−2 , or − 19 dB |
(9.128) |
||
fi1t |
(4 |
∞ 10−9 )2 |
∞ 103 |
||||||
|
|
|
|
|
|||||
Now the signal plus noise is amplified and passed directly into the LIA and the LIA’s output LPF has a noise bandwidth of 0.125 Hz. The output dc component of the signal is KvVs/2 V. Thus, the MS dc output signal is vso2 =
Kv2 Vs2/4 = Kv2 ∞ 1 ∞ 10−16 MSV. The MS noise output is vno2 = Kv2 (4 ∞ 10−9)2 ∞ 0.125 MSV; the MS SNRout = 50, or +17 dB.
The costs for using an LIA are that the ac signal is reduced to a proportional dc level and that the output LPF means that the LIA does not reach a new steady-state output, given a change in Vs, until about three time constants of the LPF (about 3 sec in the preceding example). The benefit of using an LIA is that coherent signals buried in up to 60-dB noise can be measured.
9.8.7Signal Averaging of Evoked Signals for Signal-to-Noise Ratio Improvement
9.8.7.1Introduction
The signal-to-noise ratio (SNR) of a periodic signal recorded with additive noise is an important figure of merit that characterizes the expected resolution of the signal. SNRs are typically given at the input to a signal conditioning system, as well as at its output. SNR can be expressed as a positive real number or in decibels (dB). The SNR can be calculated from the MS, RMS, or peak signal voltage divided by the MS or RMS noise voltage in a defined
© 2004 by CRC Press LLC
372 Analysis and Application of Analog Electronic Circuits
noise bandwidth. If the MS SNR is computed, the SNR(dB) = 10 log10 (msSNR); otherwise it is SNR(dB) = 20 log10(RMSSNR)
Signal averaging is widely used in experimental and clinical electrophysiology in order to extract a repetitive, quasi-deterministic, electrophysiological transient response buried in broadband noise. One example of the type of signal extracted is the evoked cortical response recorded directly from the surface of the brain (or from the scalp) by an electrode pair while the subject is given a repetitive periodic sensory stimulus, such as a tone burst, flash of light, or tachistoscopically presented picture. Every time the stimulus is given, a “hardwired” electrophysiological transient voltage, sj (t), lasting several hundred MS is produced in the brain by the massed activity of cortical and deeper neurons. When viewed directly on an oscilloscope or recorder, each individual evoked cortical response is invisible to the eye because of the accompanying noise.
Signal averaging is generally used to extract the evoked potential, s(t), from the noise accompanying it. Signal averaging is also used to extract evoked cortical magnetic field transients recorded with SQUID sensors (Northrop, 2002) and to extract multifocal electroretinogram (ERG) signals obtained when testing the competence of macular cones in the retina of the eye. A small spot of light illuminating only a few cones is repetitively flashed on the macular retina. ERG averaging is done over N flashes for a given spot position in order to extract the local ERG flash response, then the spot is moved to a new, known position on the macula and the process is repeated until a 2-D macular ERG response of one eye is mapped (Northrop, 2002).
Signal averaging is ensemble averaging; following each identical periodic
stimulus, the response can be written for the jth stimulus: |
|
xj(t) = sj(t) + nj(t), 0 ≤ j ≤ N |
(9.129) |
where sj (t) is the jth evoked transient response and nj(t) is the jth noise following the stimulus. t is the local time origin taken as 0 when the jth stimulus is given.
The noise is assumed to be generally nonstationary, i.e., its statistics are affected by the stimulus. Assume that the noise has zero mean, however, regardless of time following any stimulus, i.e., E{n(t)} = 0, 0 ≤ t < Ti. Ti is the interstimulus interval. Also, to be general, assume that the evoked response varies from stimulus to stimulus; that is, sj(t) is not exactly the same as sj+1(t), etc.
Each xj(t) is assumed to be sampled and digitized beginning with each stimulus; the sampling period is Ts and M samples are taken following each stimulus. Thus, there are N sets of sampled xj(k), 0 ≤ k ≤ (M − 1); also, (M − 1)Ts = TD < Ti. TD is the total length of analog xj(t) digitized following each input stimulus (epoch length).
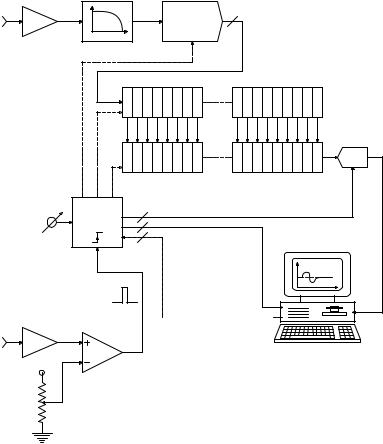
When the jth stimulus is given, the x(k)th value is summed in the kth data register with the preceding x(k) values. At the end of an experimental run, [x1(k) + x2(k) + x3(k) +… + xN(k)] in the kth data register. Figure 9.21 illustrates the organization of a signal averager. Early signal averagers were standalone dedicated instruments. Modern signal averagers typically use a PC or
© 2004 by CRC Press LLC
Noise and the Design of Low-Noise Amplifiers for Biomedical Applications |
373 |
|||||||
|
|
AAF |
|
|
|
|
|
|
x = s + n |
|
1 |
|
12 |
|
|
|
|
Input |
|
0 0 |
|
S&H + ADC |
xj(k) |
|
|
|
|
f |
|
|
|
|
|
||
|
|
(Sample, hold, convert & readout) |
|
|
|
|
||
|
|
|
|
12 bit X M shift register buffer |
|
|
|
|
|
|
|
|
|
|
|
Running |
|
|
|
|
|
|
|
|
normalizer |
|
|
|
|
|
|
|
|
j |
|
|
|
|
0 1 2 3 |
M register main memory k |
M −1 |
j |
|
|
|
|
|
|
j |
|
|
|
|
|
|
|
|
1 ≤ j ≤ N |
|
|
|
|
|
|
Averaging |
|
(average number) |
|
|
|
|
|
|
|
|
|
|
|
|
|
|
|
controller |
|
|
|
|
|
|
Set N averages |
|
|
|
k |
|
|
|
|
|
|
|
|
0 ≤ k ≤ M −1 |
Display |
|
|
|
|
|
Trigger |
(sample number) |
W |
|
|
||
|
|
pulses |
|
|
|
|
||
|
|
|
|
|
|
|
||
|
|
|
|
|
|
|
k |
|
|
|
(HI if VT > Vφ) |
|
k |
|
|
|
|
|
|
|
|
|
1 |
N |
||
|
|
|
|
|
|
|
||
Trigger |
|
|
|
|
|
|
W = |
xj(k) |
input |
VT |
|
|
|
|
|
N j = 1 |
|
|
Vφ |
Comp. |
|
|
|
Controlling computer |
|
|
Set φ
FIGURE 9.21
Block diagram of a signal averager. The memory and averaging controller are actually in the computer and are drawn outside for clarity.
laptop computer with a dual-channel A/D interface to handle the trigger event that initiates sampling the evoked transient plus noise, xj (t) = sj (t) + nj (t). Modern averagers give a running display in which the main register contents are continually divided by the running j value as j goes from 1 to N.
9.8.7.2Analysis of SNR Improvement by Averaging
The average contents of the kth register after N epochs are sampled can be written formally
|
|
= |
1 |
N |
|
(k) + |
1 |
N |
nj (k), 0 ≤ k ≤ (M − 1) |
|
|
x(k) |
N |
|
sj |
|
(9.130) |
||||||
N |
N |
||||||||||
|
|
|
|
j=1 |
|
|
|
j=1 |
|
|
© 2004 by CRC Press LLC

374 |
Analysis and Application of Analog Electronic Circuits |
where the left-hand summation is the signal sample mean at t = kTs after N stimuli and the right-hand summation is the noise sample mean at t = kTs after N stimuli.
It has been shown that the variance of the sample mean is a statistical measure of its noisiness. In general, the larger N is, the smaller the noise variance will be. The variance of the sample mean of x(k) is written as:
|
|
|
|
N |
˘ |
2 ÷ |
|
|
|
|
|
™ |
1 |
|
|
™ |
|
|
2 |
|
|
|
|
|
|
||||
Var{x(k)N }= E |
|
xj |
(k)˙ |
˝ |
− |
x(k) |
|
||
|
|
||||||||
|
|
™ N |
j=1 |
˙ |
™ |
|
|
|
|
|
|
© |
|
|
˚ |
˛ |
|
|
|
|
|
|
|
|
|
|
|
|
|
|
|
|
|
|
|
|
|
|
|
|
|
|
|
¬ |
|
|
|
|
|
|
|
|
|
|
|
|
|
|
|
|
|
|
|
|
|
|
|
|
|
|
|
|
|
|
|
|
|
N |
|
|
|
˘ |
|
|
|
N |
|
˘÷ |
|
|
|
||||||
|
|
|
|
|
|
|
|
|
|
|
|
|
|
|
™ |
1 |
|
|
|
|
|
|
|
1 |
|
|
|
|
™ |
|
2 |
|
||||||
|
|
|
|
|
|
|
|
|
|
|
|
|
|
|
|
|
|
|
|
|
|
|
|
|
|
|
||||||||||||
|
|
|
Var{x(k)N }= E |
|
|
|
|
xj |
(k)˙ |
|
|
|
xi (k)˙˝ − |
x(k) |
|
|
||||||||||||||||||||||
|
|
|
|
|
|
|
|
|
|
|
||||||||||||||||||||||||||||
|
|
|
|
|
|
|
|
|
|
|
|
|
|
|
™ N |
j=1 |
|
|
|
˙ N i =1 |
|
˙™ |
|
|
|
|||||||||||||
|
|
|
|
|
|
|
|
|
|
|
|
|
|
|
© |
|
|
|
|
|
|
|
˚ |
|
|
|
|
|
|
˚˛ |
|
|
|
|||||
|
|
|
|
|
|
|
|
{ |
|
|
|
|
N } |
|
|
|
|
|
|
|
|
|
¬ |
|
|
|
|
|
|
|
} |
|
|
|
|
|
||
|
|
|
|
|
|
|
|
|
|
|
|
|
|
|
|
|
2 { |
j |
|
|
|
i |
|
|
|
|
|
|||||||||||
|
|
|
|
|
|
|
|
|
|
|
|
|
|
|
|
|
|
|
1 |
|
N |
N |
|
|
|
|
|
|
|
|
|
|
|
|
|
|||
|
|
|
|
|
Var |
x(k) |
|
|
= |
|
|
|
|
|
|
|
E x (k)x (k) |
− x(k) 2 |
|
|
||||||||||||||||||
|
|
|
|
|
|
|
|
N |
|
|
|
|
|
|
||||||||||||||||||||||||
|
|
|
|
|
|
|
|
|
|
|
|
|
|
|
|
|
|
|
j =1 |
i =1 |
|
|
|
|
|
|
|
|
|
|
|
|
|
|||||
|
|
|
|
|
|
|
|
|
|
|
|
|
|
|
|
|
|
|
|
|
|
|
|
|
|
|
|
|
|
|
|
|
|
|
||||
|
|
|
|
|
|
|
|
|
|
|
|
|
|
|
|
|
|
|
|
|
|
|
|
¬ |
|
|
|
|
|
|
|
|
|
|
|
|
|
|
|
|
{ |
|
|
N } |
|
|
|
|
|
|
(N terms, j=1) |
|
|
|
|
|
|
|
|
|
(N2 =N terms) |
} |
|
|
|||||||||||||
|
|
|
|
|
|
|
2 { j |
} |
|
|
|
2 { j |
|
i |
|
|
||||||||||||||||||||||
|
|
|
|
|
|
|
|
= |
1 |
|
N |
E x2 (k) |
+ |
1 |
|
N |
|
|
N |
|
(k)x |
(k) − x(k) 2 (9.131) |
||||||||||||||||
|
|
Var |
x(k) |
|
|
|
|
|
|
|
|
|
|
E x |
||||||||||||||||||||||||
|
|
|
|
N |
|
|
|
|
|
N |
|
|
|
|
|
|
||||||||||||||||||||||
|
|
|
|
|
|
|
|
|
|
|
j =1 |
|
|
|
|
|
|
|
|
|
|
|
j =1 |
|
i =1 |
|
|
|
|
|
|
|||||||
|
|
|
|
|
|
|
|
|
|
|
|
|
|
|
|
|
|
|
|
|
|
|
|
|
|
|
|
|
|
|
|
|||||||
|
|
|
|
|
|
|
|
|
|
|
|
|
|
|
|
|
|
|
|
|
|
|
|
|
|
|
|
|
j π1 |
|
|
|
|
|
|
|
||
Now for the N squared terms: |
|
} |
|
|
|
|
{ j |
|
} { j |
|
} { j |
} |
||||||||||||||||||||||||||
{ j |
} |
|
[ |
|
j |
|
|
|
j |
] |
˝ |
|
|
|
{ j |
|
|
|
|
|
|
|
||||||||||||||||
E x |
2 |
(k) = E |
|
s (k) |
+ n (k) |
2 |
÷ |
|
|
|
2 |
|
|
|
|
|
|
|
|
|
|
|
|
|
|
2 |
(k) |
|||||||||||
|
© |
|
˛ |
= E s |
(k) + 2E s (k) E n (k) + e n |
|||||||||||||||||||||||||||||||||
|
|
|
|
|
|
|
|
|
|
|
|
|
|
|
|
|
|
|
|
|
|
|
|
|
|
|
|
|
|
|
|
|
|
(9.132) |
||||
|
|
|
|
|
|
|
|
|
|
|
|
|
|
|
|
|
|
|
|
|
|
|
|
|
|
|
|
|
|
|
|
|
|
|
|
|
|
|
= σs2 (k) +  s(k)
s(k) 2 + σn2 (k)
and, for the (N2 − N) terms with unlike indices:
E x |
(k)x |
(k) |
= E |
s |
(k) + n |
(k) |
[s |
(k) + n |
(k)] |
|
|
|
|
|
||||||
{ j |
i |
} |
{[ |
|
j |
|
j |
|
] |
i |
|
|
i |
|
} |
|
|
|
|
(9.133) |
|
|
|
{ |
j |
|
i |
} |
|
{ |
j |
i |
|
} |
{ j |
i |
i |
j |
} |
||
|
|
|
= E s |
(k)s |
(k) |
|
+ E n |
(k)n |
(k) |
+ E s |
(k)n |
(k) + s |
(k)n |
(k) |
|
|||||
Several important assumptions are generally applied to the preceding equation. First, noise and signal are uncorrelated and statistically independent, which means that E{s n} = E{s} E{n} = E{s} 0 = 0. Also, assuming that
© 2004 by CRC Press LLC
Noise and the Design of Low-Noise Amplifiers for Biomedical Applications |
375 |
noise samples taken at or more than t = T seconds apart will be uncorrelated
leads to E{nj(k) ni (k)} = E{nj (k)} E{ni (k)} 0. So, E{xj (k) xi (k)} = E{[sj (k) si (k)}. It is also assumed that sj (k) and si (k) taken at or more than T seconds apart
are independent. So finally:
{ j |
i |
} |
{[ |
j |
i |
]} |
{ j |
} |
i |
|
|
|
|
E x |
(k)x |
(k) |
= E |
s |
(k)s |
(k) |
= E s |
(k) |
E{s |
(k)} = |
s(k) |
2 |
(9.134) |
Now, putting all the terms together:
|
|
|
1 |
|
||
Var{x(k)N }= |
||||||
|
|
N |
||||
N |
2 |
|||||
|
|
|
|
© |
||
σs2 |
(k) + |
|
|
2 |
+ σn2 (k)˙˘ |
+ (N2 |
− N) |
|
2 |
˝÷ |
− |
|
2 |
|
s(k) |
s(k) |
s(k) |
||||||||||||
|
|
|
|
|
|
˚ |
|
|
|
|
˛ |
|
|
|
|
|
|
|
|
|
¬ |
|
|
|
|
|
|
|
|
Var{ |
|
N |
}= σs2 (k) + σn2 (k) |
|
|
|
|
|||||||
x(k) |
|
|
|
|
||||||||||
|
|
|
|
|
|
|
N |
|
|
|
|
|
|
|
(9.135A)
(9.135B)
The variance of the sample mean for the kth sample following a stimulus is a measure of the noisiness of the averaging process. The variance of the averaged signal, x, is seen to decrease as 1/N, where N is the total number of stimuli given and of responses averaged.
Another measure of the effectiveness of signal averaging is the noise factor,
F ∫ Sin  Nin , where Sin is the mean-squared input signal to the averaging process;
So No
Nin is the MS input noise; So is the MS output signal; and No is the MS output noise. The noise factor is normally used as a figure of merit for amplifiers. Because amplifiers generally add noise to the input signal and noise, the output signal-to-noise ratio (SNR) is less than the input SNR; thus, for a nonideal amplifier, F > 1. For an ideal noiseless amplifier, F = 1. The exception to this behavior is in signal averaging, in which the averaging process generally produces an output SNR greater than the input SNR, making F < 1. Note that the noise figure of a signal conditioning system is defined as:
NF ∫ 10 log10(F) dB |
(9.136) |
From the preceding calculations on the averaging process:
|
(k) |
= E s2 |
(k) |
|
= σ |
2 (k) + |
|
2 |
|
|||||
S |
|
s(k) |
(9.137) |
|||||||||||
in |
|
|
{ |
j |
} |
|
s |
|
|
|
|
|
||
|
N |
in |
(k) = E n |
2 |
(k) |
= σ 2 |
(k) |
|
(9.138) |
|||||
|
|
|
|
{ |
j |
|
} |
|
n |
|
|
|
|
|
o |
|
|
|
2 |
} |
|
σs (k) |
|
|
|
|
|
||
|
|
|
|
|
|
|
|
|
||||||
|
|
{ o |
|
2 |
|
|
|
|
|
|||||
S (k) = E s (k) |
|
= |
|
|
+ s(k) |
2 |
(9.139) |
|||||||
|
N |
|
||||||||||||
|
|
|
|
|
|
|
|
|
|
|
|
|
||
© 2004 by CRC Press LLC
376 |
Analysis and Application of Analog Electronic Circuits |
||
|
No |
(k) = σn2 (k) + σs2 (k) |
(9.140) |
|
|
N |
|
These terms can be put together to calculate the noise factor of the averaging process:
|
σs2 |
(k) + |
|
2 ˙˘ |
[1+ σs2 |
(k) σn2 |
(k)] |
|||
s(k) |
||||||||||
F = |
|
|
|
˚ |
|
|
|
|
|
(9.141) |
|
[σs2 (k) + N |
|
|
]2 |
|
|||||
|
|
s(k) |
|
|
||||||
Note that if the evoked transient is exactly the same for each stimulus,
σs2(k) 0 and F = 1/N.
The reader should appreciate that this is an idealized situation; in practice, a constant level of noise, σa2, is present on the output of the signal averager. This noise comes from signal conditioning amplifiers, quantization accompanying analog-to-digital conversion, and arithmetic round-off. The averager MS output noise can thus be written:
N |
o |
= |
σn2 (k) + σs2 (k) + σ 2 |
mean-squared volts |
|
|
|
N |
a |
|
|
|
|
|
|
|
|
and, as before, the MS signal is:
So (k) = σs2 (k) + s(k)2
N
The averaged MS output SNR is just:
|
|
|
2 |
SNRo = |
σs2 (k) + Ns(k) |
||
σs2 (k) + σn2 (k) + Nσa2 |
|||
and, if the evoked response is deterministic, σs2(k) 0, then:
|
N |
|
2 |
SNRo = |
s(k) |
||
σn2 (k) + N σa2 |
|||
(9.142)
(9.143)
(9.144)
(9.145)
Note that if the number, N, of stimuli and responses averaged becomes very large, then
|
|
|
|
|
2 |
|
SNR |
|
s(k) |
(9.146) |
|||
o |
|
σ 2 |
||||
|
|
|
|
|||
|
|
|
|
a |
|
|
© 2004 by CRC Press LLC