

- •Analysis and Application of Analog Electronic Circuits to Biomedical Instrumentation
- •Dedication
- •Preface
- •Reader Background
- •Rationale
- •Description of the Chapters
- •Features
- •The Author
- •Table of Contents
- •1.1 Introduction
- •1.2 Sources of Endogenous Bioelectric Signals
- •1.3 Nerve Action Potentials
- •1.4 Muscle Action Potentials
- •1.4.1 Introduction
- •1.4.2 The Origin of EMGs
- •1.5 The Electrocardiogram
- •1.5.1 Introduction
- •1.6 Other Biopotentials
- •1.6.1 Introduction
- •1.6.2 EEGs
- •1.6.3 Other Body Surface Potentials
- •1.7 Discussion
- •1.8 Electrical Properties of Bioelectrodes
- •1.9 Exogenous Bioelectric Signals
- •1.10 Chapter Summary
- •2.1 Introduction
- •2.2.1 Introduction
- •2.2.4 Schottky Diodes
- •2.3.1 Introduction
- •2.4.1 Introduction
- •2.5.1 Introduction
- •2.5.5 Broadbanding Strategies
- •2.6 Photons, Photodiodes, Photoconductors, LEDs, and Laser Diodes
- •2.6.1 Introduction
- •2.6.2 PIN Photodiodes
- •2.6.3 Avalanche Photodiodes
- •2.6.4 Signal Conditioning Circuits for Photodiodes
- •2.6.5 Photoconductors
- •2.6.6 LEDs
- •2.6.7 Laser Diodes
- •2.7 Chapter Summary
- •Home Problems
- •3.1 Introduction
- •3.2 DA Circuit Architecture
- •3.4 CM and DM Gain of Simple DA Stages at High Frequencies
- •3.4.1 Introduction
- •3.5 Input Resistance of Simple Transistor DAs
- •3.7 How Op Amps Can Be Used To Make DAs for Medical Applications
- •3.7.1 Introduction
- •3.8 Chapter Summary
- •Home Problems
- •4.1 Introduction
- •4.3 Some Effects of Negative Voltage Feedback
- •4.3.1 Reduction of Output Resistance
- •4.3.2 Reduction of Total Harmonic Distortion
- •4.3.4 Decrease in Gain Sensitivity
- •4.4 Effects of Negative Current Feedback
- •4.5 Positive Voltage Feedback
- •4.5.1 Introduction
- •4.6 Chapter Summary
- •Home Problems
- •5.1 Introduction
- •5.2.1 Introduction
- •5.2.2 Bode Plots
- •5.5.1 Introduction
- •5.5.3 The Wien Bridge Oscillator
- •5.6 Chapter Summary
- •Home Problems
- •6.1 Ideal Op Amps
- •6.1.1 Introduction
- •6.1.2 Properties of Ideal OP Amps
- •6.1.3 Some Examples of OP Amp Circuits Analyzed Using IOAs
- •6.2 Practical Op Amps
- •6.2.1 Introduction
- •6.2.2 Functional Categories of Real Op Amps
- •6.3.1 The GBWP of an Inverting Summer
- •6.4.3 Limitations of CFOAs
- •6.5 Voltage Comparators
- •6.5.1 Introduction
- •6.5.2. Applications of Voltage Comparators
- •6.5.3 Discussion
- •6.6 Some Applications of Op Amps in Biomedicine
- •6.6.1 Introduction
- •6.6.2 Analog Integrators and Differentiators
- •6.7 Chapter Summary
- •Home Problems
- •7.1 Introduction
- •7.2 Types of Analog Active Filters
- •7.2.1 Introduction
- •7.2.3 Biquad Active Filters
- •7.2.4 Generalized Impedance Converter AFs
- •7.3 Electronically Tunable AFs
- •7.3.1 Introduction
- •7.3.3 Use of Digitally Controlled Potentiometers To Tune a Sallen and Key LPF
- •7.5 Chapter Summary
- •7.5.1 Active Filters
- •7.5.2 Choice of AF Components
- •Home Problems
- •8.1 Introduction
- •8.2 Instrumentation Amps
- •8.3 Medical Isolation Amps
- •8.3.1 Introduction
- •8.3.3 A Prototype Magnetic IsoA
- •8.4.1 Introduction
- •8.6 Chapter Summary
- •9.1 Introduction
- •9.2 Descriptors of Random Noise in Biomedical Measurement Systems
- •9.2.1 Introduction
- •9.2.2 The Probability Density Function
- •9.2.3 The Power Density Spectrum
- •9.2.4 Sources of Random Noise in Signal Conditioning Systems
- •9.2.4.1 Noise from Resistors
- •9.2.4.3 Noise in JFETs
- •9.2.4.4 Noise in BJTs
- •9.3 Propagation of Noise through LTI Filters
- •9.4.2 Spot Noise Factor and Figure
- •9.5.1 Introduction
- •9.6.1 Introduction
- •9.7 Effect of Feedback on Noise
- •9.7.1 Introduction
- •9.8.1 Introduction
- •9.8.2 Calculation of the Minimum Resolvable AC Input Voltage to a Noisy Op Amp
- •9.8.5.1 Introduction
- •9.8.5.2 Bridge Sensitivity Calculations
- •9.8.7.1 Introduction
- •9.8.7.2 Analysis of SNR Improvement by Averaging
- •9.8.7.3 Discussion
- •9.10.1 Introduction
- •9.11 Chapter Summary
- •Home Problems
- •10.1 Introduction
- •10.2 Aliasing and the Sampling Theorem
- •10.2.1 Introduction
- •10.2.2 The Sampling Theorem
- •10.3 Digital-to-Analog Converters (DACs)
- •10.3.1 Introduction
- •10.3.2 DAC Designs
- •10.3.3 Static and Dynamic Characteristics of DACs
- •10.4 Hold Circuits
- •10.5 Analog-to-Digital Converters (ADCs)
- •10.5.1 Introduction
- •10.5.2 The Tracking (Servo) ADC
- •10.5.3 The Successive Approximation ADC
- •10.5.4 Integrating Converters
- •10.5.5 Flash Converters
- •10.6 Quantization Noise
- •10.7 Chapter Summary
- •Home Problems
- •11.1 Introduction
- •11.2 Modulation of a Sinusoidal Carrier Viewed in the Frequency Domain
- •11.3 Implementation of AM
- •11.3.1 Introduction
- •11.3.2 Some Amplitude Modulation Circuits
- •11.4 Generation of Phase and Frequency Modulation
- •11.4.1 Introduction
- •11.4.3 Integral Pulse Frequency Modulation as a Means of Frequency Modulation
- •11.5 Demodulation of Modulated Sinusoidal Carriers
- •11.5.1 Introduction
- •11.5.2 Detection of AM
- •11.5.3 Detection of FM Signals
- •11.5.4 Demodulation of DSBSCM Signals
- •11.6 Modulation and Demodulation of Digital Carriers
- •11.6.1 Introduction
- •11.6.2 Delta Modulation
- •11.7 Chapter Summary
- •Home Problems
- •12.1 Introduction
- •12.2.1 Introduction
- •12.2.2 The Analog Multiplier/LPF PSR
- •12.2.3 The Switched Op Amp PSR
- •12.2.4 The Chopper PSR
- •12.2.5 The Balanced Diode Bridge PSR
- •12.3 Phase Detectors
- •12.3.1 Introduction
- •12.3.2 The Analog Multiplier Phase Detector
- •12.3.3 Digital Phase Detectors
- •12.4 Voltage and Current-Controlled Oscillators
- •12.4.1 Introduction
- •12.4.2 An Analog VCO
- •12.4.3 Switched Integrating Capacitor VCOs
- •12.4.6 Summary
- •12.5 Phase-Locked Loops
- •12.5.1 Introduction
- •12.5.2 PLL Components
- •12.5.3 PLL Applications in Biomedicine
- •12.5.4 Discussion
- •12.6 True RMS Converters
- •12.6.1 Introduction
- •12.6.2 True RMS Circuits
- •12.7 IC Thermometers
- •12.7.1 Introduction
- •12.7.2 IC Temperature Transducers
- •12.8 Instrumentation Systems
- •12.8.1 Introduction
- •12.8.5 Respiratory Acoustic Impedance Measurement System
- •12.9 Chapter Summary
- •References
Instrumentation and Medical Isolation Amplifiers |
|
319 |
||||
|
|
|
+15 |
Isolated |
|
|
|
|
|
|
|
|
|
|
|
|
−15 |
± 15V |
|
|
|
|
|
Power supply |
|
||
|
|
|
|
|
||
|
|
|
|
+15 |
+15 |
|
|
|
|
|
|
RB3 |
R3 |
|
|
|
|
|
IB3 |
+15 |
|
|
|
D1 |
D2 |
D3 |
Vo |
+15 |
+15 |
|
OA3 |
|||
|
|
|
|
|||
|
|
RB1 |
R2 |
|
|
|
|
|
λ |
λ |
|
−15 |
|
Vin |
|
|
|
|||
|
IB1 |
+15 |
|
|
GND |
|
|
|
|
|
|||
|
|
|
|
|
||
OA1 |
|
|
|
|
|
|
|
|
R1 |
OA2 |
|
|
|
|
|
|
|
|
|
|
−15 |
|
|
Q1 |
|
|
|
|
|
|
|
|
|
|
Isolated |
|
|
|
|
|
|
GND |
|
|
−15 |
|
|
|
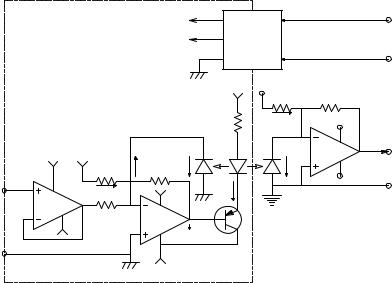
FIGURE 8.4
Simplified schematic of an analog feedback-type photo-optic coupler IsoA.
Thus, the output signal is proportional to Vin. The actual circuitry of the Burr–Brown ISO121 is more complex than described previously, but the basic operating principle remains the same.
Certified isolation amplifiers must be used in surgery and intensive-care hospital environments in which cardiac catheters are used. Although the scenarios for direct cardiac electroshock do not generally exist for outpatients, IsoAs are still used for ECG, EEG, and EMG applications to limit liability in the very unlikely event of an electroshock incident.
8.3.3A Prototype Magnetic IsoA
All of the IsoAs described thus far use a carrier and can thus face problems of aliasing in the output signal when the input signal’s highest frequency approaches one half the carrier frequency, as well as ripple in the output. One way to avoid the problems of carrier-based IsoAs is to use a technology that is dc coupled yet provides the required ohmic isolation. One approach is to use a transduction scheme that uses magnetic fields at signal rather than carrier frequencies. One such magnetic sensor is the Hall-effect device (Yang, 1988). Unfortunately, commercial Hall-effect sensors are not particularly sensitive and have low outputs that require amplification.
Fortunately, another relatively new technology was discovered in the late 1980s by Peter Gruenberg of the KFA Research Institute in Julich, Germany, and independently by Albert Fert at the University of Paris-Sud; this is the giant magnetoresistive (GMR) effect. Researchers at IBM extended the initial
© 2004 by CRC Press LLC
320 |
Analysis and Application of Analog Electronic Circuits |
|
V3 |
V3m |
|
|
T+ |
0 |
t |
|
|
|
−V3m |
|
V2 |
|
|
|
|
|
T+ |
|
|
T |
t |
|
|
|
|
Vs |
(Vin + VT) |
|
|
|
|
|
t |
|
Comparator |
|
1 pF |
|
|
|
|
|
|
V2 |
|
Hi
Vin |
Vs |
V3 |
Vo |
|
Lo Vs |
SFF |
LPF |
|
0 |
−V2 |
|
|
|
|
|
|
VT |
1 pF |
|
|
(Isolation capacitors) |
|
|
|
|
|
VpkT VT
t 0 
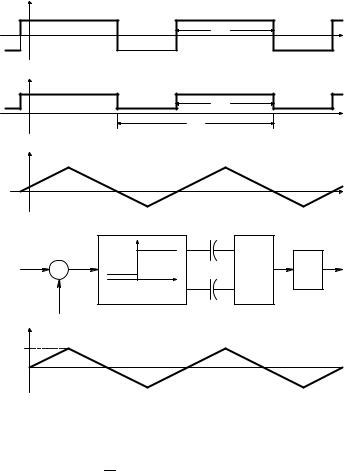
FIGURE 8.5
Waveforms relating to the operation of the Burr–Brown ISO121 capacitively coupled, duty cyclemodulated IsoA system. The low-frequency signal, Vin, is added to a symmetrical 0-mean triangle carrier wave; the sum is passed through a zero-crossing comparator that effectively performs duty-cycle modulation. If Vin > 0, T+ /T > 0.5; if Vin < 0, T+ /T < 0.5. The comparator
output, V2, and its complement, V2, are coupled to a flip-flop whose output square wave, V3, has zero mean at 50% duty cycle. The text shows that the time average value of V3, Vo, is proportional to Vin.
work on GMR devices; they developed sensitive GMR transducers based on sputtered thin film technology. IBM’s interest in developing sensitive miniature GMR devices has been to improve the data density stored on computer floppy and hard-drive magnetic discs. IBM calls its GMR sensor the spin valve read-head.
GMR sensors have a resistance modulated by an imposed magnetic flux density; therefore, a Wheatsone bridge can be used to sense the R/RM, and thus the B. Unfortunately, GMRs are not particularly linear, which makes them acceptable for binary applications but presents problems for linear analog sensing.
A basic GMR sensor is a multiple-layer thin film device. In its simplest form, it has a nonmagnetic conductive spacing layer sandwiched between
© 2004 by CRC Press LLC
Instrumentation and Medical Isolation Amplifiers |
321 |
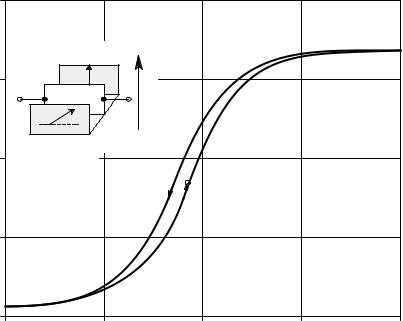
two ferromagnetic film layers. Usually, the magnetization in one ferromagnetic layer is fixed or pinned along a set direction. The magnetization of the free layer is allowed to rotate in response to an externally applied magnetic field. Low resistance occurs when the pinned and free layer are magnetically oriented in the same direction because electrons in the conductor layer with parallel spin directions move freely in both films. Higher resistance occurs when the magnetic orientations in the two films oppose each other because movement of electrons in the conductor of either spin direction is hampered by one or the other magnetic film. Depending on the strength and orientation of the applied external B field, the pinning direction, and the materials used and their thicknesses, the RM = f(B, θ, ϕ) curve can have a variety of shapes (Wilson, 1996). In many cases, the GMR RM = f(B, θ, ϕ) curve exhibits hysteresis and some dead zone as shown in Figure 8.6. This spin valve has the “crossed easy axis” configuration in which the applied B is perpendicular to the free layer easy axis and the pinning direction is parallel to B. The response is linear around Q and is relatively hysteresis free (Wilson, 1996). Because of its magnetic sensitivity, the GMR must be magnetically shielded from the Earth’s field and stray magnetic fields from man-made power wiring and machinery. To be used as a linear device, such a sensor must be magnetically biased around the Q-point.
198 |
|
|
|
|
|
|
RM |
|
|
|
|
|
|
Ω |
Pinned |
|
|
|
|
|
|
|
|
|
|
|
|
|
layer |
|
|
|
|
|
196 |
20 Å |
M2 |
B |
|
|
|
Cu film |
|
|
|
|
||
|
M1 |
|
|
|
|
|
|
Free |
|
|
|
|
|
|
layer |
|
|
|
|
|
|
Crossed easy axis |
|
|
|
|
|
194 |
configuration |
|
|
|
|
|
|
|
|
|
|
|
|
|
|
|
Q |
|
|
|
192 |
|
|
|
|
|
|
190 |
0 |
5 |
10 |
B (Gauss) |
15 |
20 |
|
||||||
FIGURE 8.6
Resistance vs. flux density of a typical giant magnetoresistor (GMR). Note the hysteresis.
© 2004 by CRC Press LLC

322 Analysis and Application of Analog Electronic Circuits
Much research is currently going on to improve the linearity and sensitivity of spin valves or GMR sensors. Attention is being paid to the use of multiple layered thin films of various compositions, including two pinned layers; 6 to 12 layers are being studied by Fujitsu (Kanai et al., 2001).
GMR sensors are available commercially. Infineon Technologies offers a four-element GMR IC package in which the four GMRs are connected in a bridge. Their GMR B6 is intended as a rotary position sensor in that the bridge output is a sinusoidal function of the input magnet’s B field angle. The magnetic field-free value of each resistor is approximately 700 Ω. Rhopoint Components of Oxted, Surrey, U.K. offers a 12-sensor GMR device kit for experimenters and research and development use.
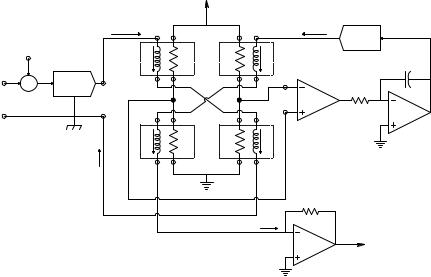
The author’s version of a prototype IsoA design based on GM resistors is shown in Figure 8.7. Four GMR resistors are connected as a Wheatstone bridge (Wilson). The bridge can be powered with dc or ac; if ac is used, a phase-sensitive rectifier must be placed between the DA and the integrator. The quantity under isolated measurement is transduced to Vs , which is converted to a signal current, IS, by a VCCS with transconductance, GM. A dc bias current component, Iso, must be added to IS to move the operating point of the GMR resistors to a linear region of its RM = f(B) curve. The current IS through the coils on the opposite diagonals of the bridge creates equal B fields, which cause identical changes in the GMRs, Rs, that, in turn, unbalance the bridge. The bridge output is amplified by the DA and serves as the input to an integrator. The integrator output causes a feedback current, IF, to flow that forces Rf = Rs in the other two diagonal RMs, which re-nulls the bridge output. Because of symmetry, the feedback current IF = IS + Iso at null and the output voltage of the op amp transresistor is:
Vo = −IF RF = −Vs GM RF + Iso RF |
(8.3) |
Thus, |
|
Vs = (Iso RF − Vo ) (GM RF ) |
(8.4) |
Galvanic isolation of the GMR bridge IsoA depends on the insulation between the chip containing the four GMR resistors and the two input coils. The capacitance between the coils and RMs and the dielectric breakdown of this insulation are important.
8.4Safety Standards in Medical Electronic Amplifiers
8.4.1Introduction
The central rationale for safety standards for medical electronic equipment is based on the need to prevent harm to human patients and health-care
© 2004 by CRC Press LLC
Instrumentation and Medical Isolation Amplifiers |
|
|
323 |
||
|
|
Vb |
|
|
|
Is + Iso |
|
|
|
IF |
|
|
|
|
|
|
|
|
|
|
|
GM |
|
Vso |
RM |
RM |
IF |
|
|
|
|
|
|||
|
|
|
|
C |
|
GM |
|
|
|
|
|
+ |
|
|
+ |
R |
|
Vs |
|
|
∆V |
DA |
|
|
|
|
|
OA |
V2 |
IF |
RM |
RM |
Is + Iso |
|
|
Is + Iso |
|
|
|
|
|
RF
IF
Vo
OA
FIGURE 8.7
Architecture of an IsoA designed by the author using four GMR elements in a bridge. A type 1 feedback loop is used to autonull the bridge. Autonulling ensures linear operation of the GMRs. Note that the input circuit ground is separate from the signal conditioning and output ground. Vso is a bias voltage that causes the GMRs to operate in their linear ranges.
workers attached to or using such equipment. Besides user safety, having a biomedical electronic product certified by one or more of the qualified test agencies reduces the litigation risk for those persons who designed, sold, and used it in practice if any untoward incident should occur. (The U.S. is legendary for its medical malpractice litigation and the substantial awards that are made.) Product certification is also necessary in various jurisdictions in order to be able to sell a biomedical electronic product to hospitals, clinics, physicians, research labs, etc.
An excellent treatise on electrical safety and the physiological effects of electric currents on the body can be found in Chapter 14 of Webster (1992). A summary of the effects of injuries caused by electric current can also be found in the on-line Merck Manual, Section 20, Chapter 277 (2003). An excellent paper on safety standards and tests for medical electronic products can be found at the Eisner Safety Consultants Website (2003).
Electrical currents can enter the body in a variety of ways; probably the most common is through the skin on a hand, the head, or a foot. Note that for a circuit to exist, the current must leave the body, also through a hand, the head, or feet. Electric shock effects are usually described in terms of the current that flows through the body and if AC, the frequency of the current. Direct current can also have profound physiological effects, as can transient currents such as those from capacitor discharges, static electricity, and lightning. Table 8.2 summarizes typical physiological effects from dc, 60-Hz, and
© 2004 by CRC Press LLC

324 |
Analysis and Application of Analog Electronic Circuits |
TABLE 8.2
Physiological Effects in the Body of Electric Currents Introduced through the Hands
Current in mA |
|
||
60 Hz |
10 kHz |
DC |
Effect |
|
|
|
|
0 to 0.3 |
0 to 5 |
0 to 0.6 |
No sensation |
2 |
8 |
3.5 |
Slight tingling on hand |
1 |
11 |
6 |
“Shock”; not painful |
10 |
51 |
58 |
Painful muscle spasms; recipient may let go |
20 |
60 |
65 |
Painful; muscle tetanus; recipient cannot let go |
>100 |
|
>500 |
Deep burns, edema, cardiac fibrillation, respiratory paralysis |
>2000 |
|
>2000 |
All of the above; death |
Note: A current ∞ time product determines tissue damage once the power density in tissues reaches the level at which temperatures rise to a level at which “cooking” occurs. Values are “typical” and can vary widely among individuals due to fat, muscle mass, etc.
10-kHz electric currents in a macroshock scenario in which the current is applied between the hands. The data are based on several sources, including human and animal studies.
Figure 8.8 illustrates let-go current vs. frequency for the hand-to-hand current path in humans. Plotted is the current vs. frequency for the median of the test population; the bars show the 99.5 and 0.5 percentile limits. This curve and the preceding table teach that power line frequency (50 or 60 Hz) is the most physiologically effective in producing electric shock damage to the body and heart. Direct current and AC at 10 kHz are about one sixth as effective in doing damage. Consequently, impedance pneumographs and plethysmographs typically pass mA level currents with frequencies of approximately 75 kHz through the chest with no untoward effects.
When the heart is stimulated directly, as in open-heart surgery or cardiac pacemaker catheterization, the scenario is called microshock. The 60-Hz current required to induce ventricular fibrillation can be as low as 20 μA in dogs. In humans, microshock current causing fibrillation is on the order of 80 to 600 μA (Webster, 1990, Chapter 14).
8.4.2Certification Criteria for Medical Electronic Systems
The data presented show that it is extremely important to prevent harmful currents from flowing into the body under macroshock conditions from any amplifier connected to the body by electrodes, such as in ECG, EEG, EMG, EOG, etc. measurements. The U.S. has a number of regulatory and certifying agencies that ensure medical electronic devices are safe, including :
•Food and Drug Administration (FDA)
•National Fire Protection Agency (NFPA) and its National Electrical Code (NEC)
•American National Standards Institute/Association for the Advancement of Medical Instrumentation (ANSI/AAMI ES1-1993)
©2004 by CRC Press LLC
Instrumentation and Medical Isolation Amplifiers |
325 |
Let-go current mA
80
60
40
99.5
20
0.5
0
5 10 100 Frequency, Hz 103 5000 104
FIGURE 8.8
Let-go current vs. frequency for the hand-to-hand current path in humans. Note that the most dangerous frequency is around 50 to 60 Hz.
•Occupational Health and Safety Administration (OSHA)
•Underwriter’s Laboratories (UL)
Europe has are two major organizations: (1) the European Committee for Electrotechnical Standardization (CENELEC) and (2) the International Electrotechnical Commission (IEC).
Gradually, the standards in the U.S. appear to be converging on those established by the IEC, which has developed a set of standards to certify medical instruments called the IEC60601-1 that covers all of the general requirements for all medical based products. (Some papers refer to IEC60601-1 as IEC601-1.) Many of the U.S. standards have been based on IEC requirements set in the past decade, but some, such as UL544, were phased out in January, 2003. The new UL2601-1 is largely based on the IEC regulations, with some exceptions (Mentelos, 2003).
The IEC60601-1 standards are subdivided into several IEC60601-X-YZ parts, which cover specific types of medical equipment. The interest here, however, is in medical isolation amplifiers used to record potentials from
© 2004 by CRC Press LLC
326 |
Analysis and Application of Analog Electronic Circuits |
the body surface. Four classes of basic electrical safety tests are defined by the IEC. These include:
•Protective earth verification: ground continuity test; ground bond test
•Dielectric strength: AC hipot test; DC hipot test
•High resistance: insulation resistance test
•Leakage current: Earth leakage, touch/chassis (enclosure); patient leakage and patient auxiliary leakage
The earth (ground or green wire) verification test passes 25 amps from the line cord plug ground (green) terminal to the chassis, to ensure cord-to- chassis ground connection robustness, and measures the voltage between the current source and the chassis or cabinet. The resistance of the grounding system must be <0.1 Ω for a detachable line cord and <0.2 Ω for a fixed cord according to IEC60601-1 specifications. Resistance is calculated by Ohm’s law: R = V/25 ohms.
The dielectric strength test applies a high ac or dc voltage to the line power input to ensure that no insulation breakdown or flashover (arcing) occurs between ground and the input power line with both terminals tied together. The basic IEC60601-1 standard requires the DUT to withstand 1250 VRMS at 60 Hz for 1 min. Medical isolation amplifiers easily exceed this requirement (see Table 8.1). For example, the Intronics IA175 IsoA is rated at 3000 Vpk, 60 Hz continuous from patient inputs to the outputs/power common. The IA175 runs on +15 VDC, so further isolation can be obtained by using a medical-grade power supply that meets IEC60601-1 standards.
The insulation resistance test is a voltmeter–ammeter test of the DUT’s insulation using a high-voltage DC source. For example, a high DC potential is applied to the IsoA’s power input common, e.g., 1000 V, and the steadystate current to ground is measured at the isolated power supply’s neutral. Such current would be 1 nA DC if the resistance were 1012 Ω.
Finally, leakage currents are considered. The four types of leakage current defined by the IEC as described by Eisner (2001) are:
Earth leakage: the most important and most common of the line leakage current tests, earth leakage current is basically the current flowing back through the ground conductor on the power cord [green wire]. It is measured by opening the ground conductor, inserting a circuit with the simulated impedance of the human body and measuring the voltage across part of the circuit with a true RMS voltmeter.
Patient leakage: a line leakage current test that measures the current that would flow from or to applied parts such as sensor and patient leads.
Patient auxiliary leakage: that line leakage current flowing in the patient in NORMAL use between applied parts of the DUT and not intended to produce a physiological effect.
© 2004 by CRC Press LLC
Instrumentation and Medical Isolation Amplifiers |
327 |
Touch/chassis leakage: a line leakage current test [that] simulates the effect of a person touching exposed metal parts of a product and detects whether or not the leakage current that flows through the person’s body remains below a safe level. Line leakage tests are conducted by applying power to the product being tested, then measuring the leakage current from any exposed metal on the chassis of the product under various fault conditions (such as “no ground”). A special circuit is used to simulate the impedance of the human body.
The circuit used to simulate the body’s impedance as defined by IEC60601- 1 is shown in Figure 8.9. At 60 Hz, this phantom presents an impedance of 999.7–−0.32∞ Ω, basically 1 kΩ. The reactance of the 0.015 μF capacitor is Xc = −1.768 ∞ 105 Ω at 60 Hz. (The author finds it curious that leakage currents are measured through this 1-kΩ body phantom, rather than using the shortcircuit leakage current.) The Eisner (2001) Web paper on IEC60601-1 illustrates in detail the various circuits used to measure the four types of leakage current; space limitations prevent duplication of them here. Table 8.3 summarizes the leakage current limits from two U.S. standards and IEC60601-1 (Mentelos, 2003).
Modern medical isolation amplifiers such as the Intronics IA175 generally exceed specifications. For example, the maximum leakage currents, inputs to common @ 115 VAC, 60 Hz, are only 8 μA max. The actual input impedance of the IA175 is 108 Ω ™ 3 pF for DM in and 1011 Ω ™ 20 pF for CM
10 kΩ
± 5%
ZB |
→ |
1 kΩ |
0.015 F |
TRMS |
|
± 5% |
± 5% |
Voltmeter |
|||
|
|
||||
|
|
|
|
≥ 1 MΩ Rin |
FIGURE 8.9
The IEC body phantom impedance model defined by the IEC60601-1 standard.
TABLE 8.3
Leakage Current Limits for Three Standards
Leakage Type |
|
UL544 |
UL2601-1 IEC60601-1 |
|
|
|
|
|
|
Earth leakage |
300 μA |
300 μA |
1 mA |
|
Enclosure leakage |
300 μA |
300 μA |
500 μA |
|
Patient leakage |
10 |
μA input |
50 μA |
50 μA |
(auxiliary) |
20 |
μA at end of cable |
||
Note: Units cannot be certified by UL544 after 1/1/03 ; UL certification expires after 1/1/05. UL2601-1 and IEC60601-1 should be used for all new designs of medical electronic equipment.
© 2004 by CRC Press LLC

328 |
|
Analysis and Application of Analog Electronic Circuits |
||||
|
|
|
|
+ 5V |
|
|
|
|
Vbias |
|
|
|
+ 5V |
|
|
|
|
|
|
|
|
|
PHOC |
|
1k |
|
|
|
|
|
|
|
|
|
Vin |
DA |
VFC |
|
|
|
|
|
|
LED |
PhotT |
180 pF |
FVC |
Vo |
|
|
|
||||
|
|
|
|
|
|
OA |
|
|
330 |
|
|
|
|
|
|
Isolation |
|
390k |
|
|
|
|
33k |
|
1k |
|
|
|
|
barrier |
|
|
||
|
|
|
|
|
|
|
FIGURE 8.10
An IsoA architecture for ECG recording using a digital photo-optic coupler. Pulses from a voltage-to-frequency converter are sent to a frequency-to-voltage converter through the PhOC to recover a signal proportional to Vin.
inputs. The maximum CM voltage, inputs to outputs/input power common
is 3000 Vpk, 60 Hz AC for 1 min. The peak continuous DC CM input voltage is ±5000 V. The CMRR with a balanced differential source is 126 dB at 60 Hz.
The small-signal −3-dB frequency is 1 kHz, which is ideal for ECG, EEG, and EOG applications.
An inexpensive isolation amplifier to measure the ECG in an experimental setting can be made from a battery-operated AD620 IA connected to a bat- tery-operated, low-current, voltage-to-frequency converter (VFC) such as the AD654. The VFC is given an FM center frequency with a bias voltage (not shown in Figure 8.10). The bipolar ECG signal output from the IA frequency modulates the VFC’s digital output. To realize isolation, the VFC drives a photo-optic coupler with output that is the input to a frequency-to-voltage converter (FVC) such as the ADVFC32. The VFC carrier bias at the output of the FVC is subtracted out and the ECG signal is further amplified and filtered.
Figure 8.10 illustrates this system. The photo-optic coupler’s phototransistor (PhotT) is given positive feedback to speed up its switching to a maximum of 500 kHz (Stapleton and O’Grady, 2001). Of course, if this design were to be used in a medical or clinical application, it would need to be tested and meet or exceed IEC60601-1 standards, etc. If the isolation and insulation on the PHOC were not adequate, one could use a fiber optic cable to couple the LED to the phototransistor.
Note that radiotelemetry is another means of providing extreme isolation between a battery-operated amplifier, modulator, and RF transmitter and a line-powered receiver, demodulator, and signal conditioner. In fisheries biology, fish are tracked underwater and data can be sent by battery-powered modulated ultrasonic “tags.” Again, extreme isolation is inherent in ultrasonic telemetry.
© 2004 by CRC Press LLC