

GrafNet |
Chapter 3 |
|
|
|
|
3.5.3Datum Options
See Section 2.6.5, on Page 97 for help with this feature or see Page 261 for a discussion on datums.
3.5.4Grid Options
See Page 133 for information regarding this feature.
3.5.5Geoid Options
This feature lets you select the geoid for the project. The geoid selected is used as a reference when outputting orthometric heights in the Traverse Solution (TRV) file. It will also be used as a default for orthometric height output when running the network adjustment.
3.5.6Preferences
GrafNet Display
See Page 102 for information regarding any options not described here.
Zoom Display Settings
The Ellipse scale field changes the size of the error ellipses. Projects covering large areas might have large ellipses and decreasing the values for all three zoom scales (0, 1, and 2) will make the ellipses smaller.
Error EllipseDisplay
Controls whether relative or absolute error ellipses are displayed. First, error ellipses can be displayed for session solutions. Second, ellipses can be displayed for the stations after a network adjustment is run. The crosses on the ellipse option merely shows the axes of the error ellipses.
Solution
In addition to the options described in Section 2.6.10, on Page 102 , the solution tab offers GrafNet users the ability to automatically run a network adjustment after processing has completed.
3.6Output Menu
3.6.1Export Wizard
See Page 111 for information regarding this feature.
3.6.2Write Coordinates
See Page 122 for information regarding this feature.
GrafNav / GrafNet 8.10 User Guide Rev 4 |
171 |
Chapter 3 |
GrafNet |
|
|
Table 13: Station Colour Legend
Colour |
Description |
|
|
|
|
Cyan |
Control point – A reference station with |
|
known coordinates |
||
|
||
|
|
|
|
Check point – Station has known |
|
|
coordinates available, but they will only |
|
Dark Purple |
be used as a check. Comparisons are |
|
found in the TRV file. The network |
||
|
||
|
adjustment output file (NET) will also |
|
|
show check point residuals. |
|
|
|
|
|
Tie point – Two or more sessions are |
|
Light Purple |
connected as remotes to this station via |
|
the traverse solution. The TRV file will |
||
|
||
|
show traverse ties. |
|
|
|
|
Yellow |
Traverse point – No tie information can |
|
be computed for traverse solution. |
||
|
||
|
|
3.6.3View Coordinates
See Page 124 for information regarding this feature.
3.6.4Export DXF
See Page 124 for information regarding any feature not described below. Only the options specific to GrafNet are discussed here.
Station Error Ellipses
Display around each station and are only available if a network adjustment has been completed.
Baseline Error Ellipses
Only the baselines need to be processed.
Error ellipse scale factor
The ellipse scale factor scales the ellipses so they will be visible if you do not see them in the DXF file.
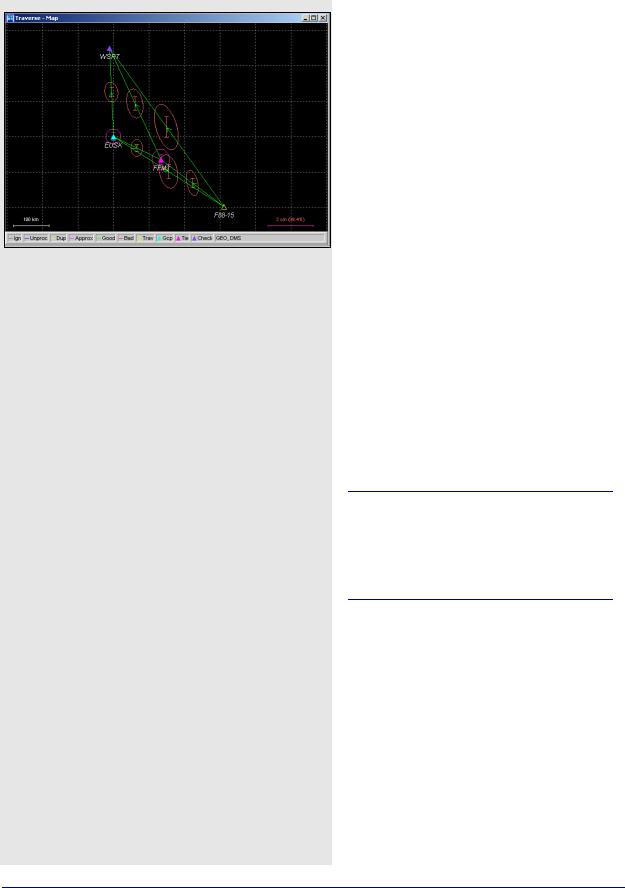
3.6.5Show Map Window
Map Window
This window displays a graphical representation of the project area. It shows the stations and connecting baselines.
Mouse Usage in Map Window
Either double-clicking or right-clicking on a station, gives you access to several options, which are described in Section 3.6.6, on Page 172 .
Clicking on a station displays the station in the Stations window of the Data Manager, while clicking on a baseline will display that baseline and any duplicates in the Sessions window. See Section 3.6.6, on Page 172 for more information.
3.6.6Show Data Window
Data Manager
This interactive window allows for easy display and organization of the project components. The Data Manager gives statistical information regarding all observations and baselines, among other things.
172 |
GrafNav / GrafNet 8.10 User Guide Rev 4 |

GrafNet |
Chapter 3 |
|
|
|
|
Observations Window
The Observations window displays information regarding all the observation files (GPB) that are included in the project. The columns that are in the shaded box are displayed in the Observations window. The following options are available by right-clicking on an observation:
View
Displays Information window for the observation file.
Edit
Opens the Add / Edit Observation window, in which the station name and antenna information can be corrected.
Delete Observation
Removes the observation period from the project.
View GPB File
Opens observation file in GPB Viewer.
View STA File
Opens the station file for the associated GPB file.
View Ephemeris File
Opens ephemeris file (EPP) for the associate GPB file.
Plot Coverage
Opens the File Data Coverage plot for all observations in the project. See Table 4 on Page 107 for information regarding this plot.
Plot L1 Satellite Lock
Launches the L1 Satellite Lock / Elevation plot. See Table 4 on Page 107 .
Plot L2 Satellite Lock
Launches the L2 Satellite Lock / Elevation plot.
Show Sessions using Observation
Displays all sessions involving the observation period in the Sessions window.
Expanding the Observations branch in the Data Objects window on the left-hand side of the Data Manager allows the observations to be displayed individually in the Observations window. Expanding each observation in the Data Objects window displays the station that was observed.
Columns in the Observation Window
Name
Name of the station at which the observations were made.
AntHgt
Antenna height for the period at which the observations were made.
AntType
Type of antenna used at the station
File
File, path and name of the GPB observation file.
#
If multiple observations periods are contained within one GPB file, this column indicates which of those observation periods is being referred to. Observation periods are numbered sequentially in the order they appear in the GPB file.
Length
Length of the observation period.
Start Date
Date of which the observation period started.
Start Time
Time of day at which the observation period started.
Receiver
Type of receiver used to log observations.
Freq
Indicates whether data is single or dual frequency.
Int(s)
Interval, in seconds, at which the data was logged.
GrafNav / GrafNet 8.10 User Guide Rev 4 |
173 |

Chapter 3 |
GrafNet |
|
|
Columns in the stations window(
Name
Name of station.
Type
See Table 13 on Page 172 for information on station types.
Latitude
Latitude coordinate of the station.
Longitude
Longitude coordinate of the station.
EllHgt
Ellipsoidal height of the station.
Source
Indicates whether the station coordinates are from the traverse solution or the network adjustment.
#Files
Number of observations periods for that station.
TotalLen
Total observation time made at that station.
A(mm)
Semi-major axis of error ellipse at that station, as defined from the network adjustment.
B(mm)
Semi-minor axis of error ellipse at that station, as defined from the network adjustment.
DH(mm)
Estimated height standard deviation.
Stations Window
The Stations window displays information regarding all the points observed in the network. The columns listed in the shaded box are displayed in the Stations window. The following options are available by right-clicking on a station:
View Solution
Displays solution from traverse computation and network adjustment, if valid.
Add as Control Point
Allows you to define station as a control point.
Add as Check Point
Allows you to define station as check point.
Edit Control / Check Point
Allows for editing of the input coordinates of stations already defined as check or control points.
Toggle between Control / Check Point
Switches status between control point and check point.
Add to Favourites
Adds station to Favourites list, using the computed coordinates.
Remove Processing Files
Removes all observation files logged at that station from project.
Show Observations
Displays all observation periods for that station in the Observations window.
Show Connecting Sessions
Displays all sessions involving that station in the
Sessions window.
Expanding the Stations branch in the Data Objects window on the left-hand side of the Data Manager will allow for the stations to be displayed individually in the Stations window. Further expanding each station in the Data Objects window will display all observation files in which the station was observed.
174 |
GrafNav / GrafNet 8.10 User Guide Rev 4 |

GrafNet |
Chapter 3 |
|
|
|
|
Sessions Window
The Sessions window displays information regarding all the sessions in the network. The columns listed in the shaded box are displayed in this window. The following options are available by right-clicking on a session:
View Results
Allows you to view results of forward or reverse processing, or view the combined solution.
View Information
Displays Information box for the session.
View File
Allows access to message log, static summary, trajectory output, or configuration files.
Plot
Allows access the plots discussed in Table 4 on
Page 107 .
Options
Allows access to the processing settings so that they can be set individually for this session. See Section 3.4, on Page 159 for additional information.
Override Status
Manually sets the status of the session. See Table 11 on Page 148 for information. Ignore redundant or troublesome sessions. You can assign a Good status to a failed baseline if the solution is, in fact, correct. Only do this on closed loop networks.
Process
Processes the session independently of all others.
GrafNav
Launches the baseline into GrafNav. See Section 2.5, on Page 61 for additional information.
Delete
Deletes of all processing files related to that session, or for the deletion of either the forward or reverse solutions.
Compute Azimuth / Distance
Displays the Distance and Azimuth box for the session. See Section 2.8.2, on Page 129 for help.
Show To / From Stations
Displays both stations in the Stations window. See on Page 174 for information.
Show To / From Observations
Displays both station Observations window. See
Observation Window on on Page 173 for information.
Expand the Sessions branch in Data Objects of the Data Manager to display individual in the Sessions window.
Columns in the Sessions Window
Name
Name of session, which serves to indicate direction of coordinate transfer.
SD
Standard deviation, in mm, of baseline, as calculated by the Kalman filter.
Reliability
Reliability of the fixed static solution, if available.
RMS
RMS of the fixed static solution. Applies only to fixed baselines.
SolType
Indicates solution type. See Table 11 on Page 148 for a full description.
Time
Length of session, in hh:mm format.
Dist
Baseline distance, in km.
Status
Solution status. See Table 11 on Page 148 for descriptions.
From
Indicates the FromStation.
To
Indicates the ToStation.
#
If multiple sessions exist for same baseline, indicates which session is being referred to.
GrafNav / GrafNet 8.10 User Guide Rev 4 |
175 |

Chapter 3 |
GrafNet |
|
|
Columns in the Control / Check Points Window
Name
Name of the station.
Type
Type of control or check point, which can be 3D, horizontal or vertical.
Latitude
Known latitude coordinate of the station.
Longitude
Known longitude coordinate of the station.
EllHgt
Known ellipsoidal height of the station.
HzSD
Standard deviation of the known horizontal coordinates. Applies only to control points.
VtSD
Standard deviation of the known vertical coordinate. Applies only to control points.
dE
Easting residual between input coordinate and traverse solution at check point.
dN
Northing residual between input coordinate and traverse solution at check point
dH
Height residual between input coordinate and traverse solution at check point
Control / Check Points
The Control / Check Points window displays information regarding all the stations assigned known coordinates in the network. The columns listed in the shaded box are displayed in the Control / Check Points window.
The following options are available by right-clicking on a control or check point:
View Info
Displays Information box for the point.
Edit
Allows for editing of known coordinates via the Add / Edit Control Point window.
Toggle between Control / Check
Switches status between control point and check point.
Show Station
Displays station in the Stations window. See Stations Window on on Page 174 for information.
Expanding the Control or Check Points branches in the Data Objects window on the left-hand side of the Data Manager allows for the points to be displayed individually in the Control / Check Points window.
176 |
GrafNav / GrafNet 8.10 User Guide Rev 4 |