

Chapter 2 |
GrafNav |
|
|
Table 7: Quality Number Description
Quality |
Colour |
Description |
Accuracy |
|
|
|
|
|
|
1 |
Green |
Fixed integer |
0.00 – 0.15 |
|
|
|
|
|
|
2 |
Cyan |
Converged float |
0.05 – 0.40 |
|
or noisy fixed |
||||
|
|
integer |
|
|
|
|
|
|
|
3 |
Blue |
Converging float |
0.20 – 1.00 |
|
|
|
|
|
|
4 |
Purple |
Converging float |
0.50 – 2.00 |
|
|
|
|
|
|
5 |
Magenta |
DGPS |
1.00 – 5.00 |
|
|
|
|
|
|
6 |
Red |
DGPS |
2.00 – 10.00 |
|
|
|
|
|
|
Unprocessed |
Grey |
Has not been |
N/A |
|
processed |
||||
|
|
|
||
|
|
|
|
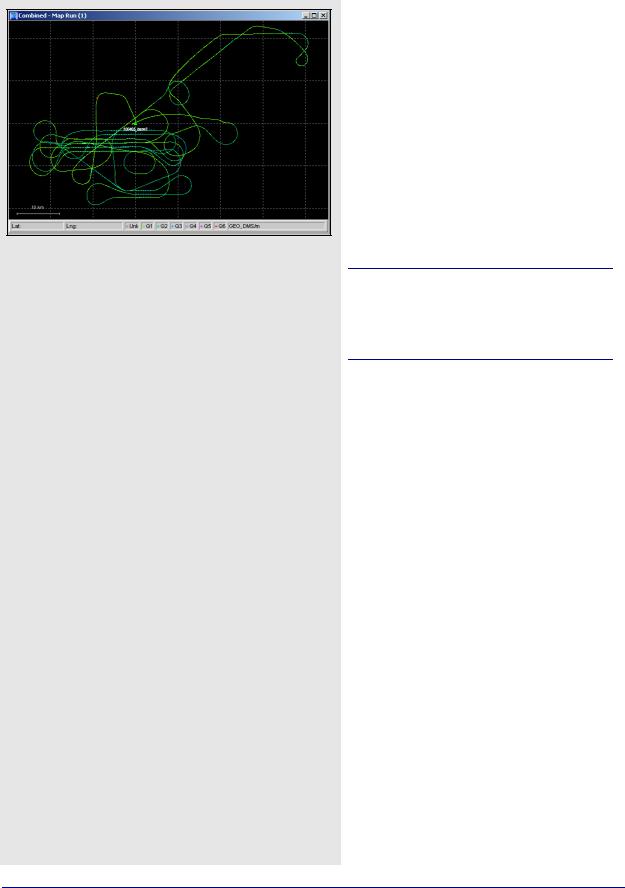
2.7.11Show Map Window
This screen is a graphical representation of the project area. It shows the master stations, the location of the remote station at each epoch, and station or event marks.
The master stations are represented by solid green triangles. Event marks are shown as cyan circles, while station marks are shown as yellow triangles. See Section 2.6.10, on Page 102 for help enabling or disabling certain features of this display.
Remote locations are shown as small crosses. The colour of the crosses depends on the quality of the solution. The colours displayed are listed in Table 7.
The accuracies given are only guidelines. The actual accuracies might be different and, in fact, much worse. Check the standard deviation values, which are also a guideline.
126 |
GrafNav / GrafNet 8.10 User Guide Rev 4 |
GrafNav |
Chapter 2 |
|
|
|
|
Mouse Usage in Map Window
Positioning the cursor on a station or epoch mark and clicking with the left mouse button brings up the Station Information or Epoch Information message box. Clicking the right mouse button brings up the Object Menu. See
Section 2.4.7, on Page 57 for additional information.
If you have a scroll-wheel on your mouse, you can use it to zoom in and out by scrolling forwards and backwards over the area of interest.
Right-clicking on the Map Window provides you with several options, including the ability to load a specific solution and to open the Feature Editor.
The Save to HTML option generates an HTML file containing a bitmap version of the Map Window. These HTML and BMP files are saved to the HTML folder contained within the project folder.
See Section 2.8, on Page 129 for additional interactive mapping tools.
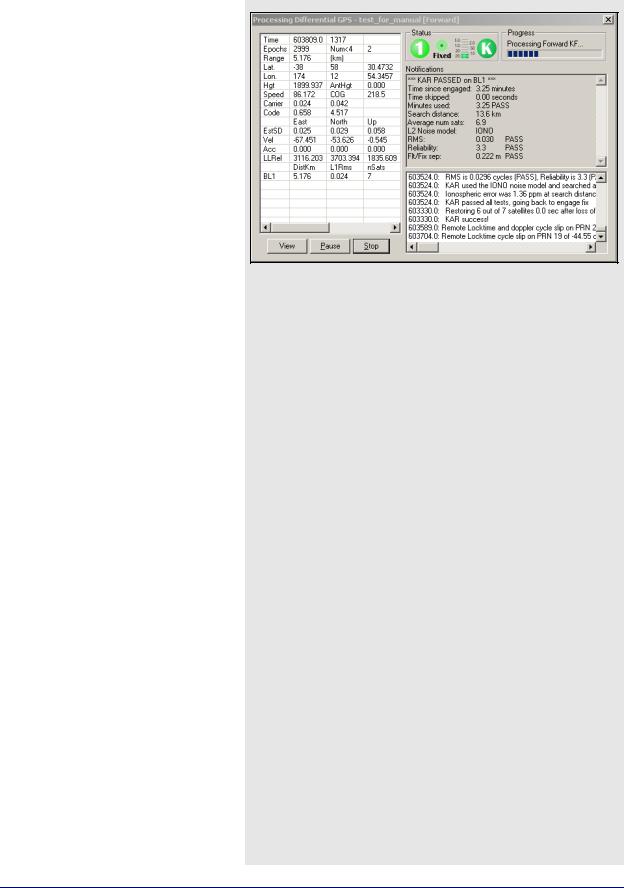
2.7.12 Processing Window
This window appears during processing and shows position, status, satellite and message information originating from the processing engine. This screen is updated every 500 milliseconds.
Status
This window displays a graphical quality bar in the Status box. The first icon on the left shows the quality factor. This number ranges from 1 to 6 and is most sensitive to solution stability. Stable solutions are usually 1 or 2 for carrier phase processing. For code-only processing, the quality ranges from 3 to 6. See Table 7 on
Page 126 for a description of quality factors. If this factor jumps from 1 to 6, either a serious loss of lock has occurred, or unfixable bad measurements have incurred a Kalman filter reset.
The right-most icon of the Status box displays a K during kinematic processing and an S for static processing.
Table 8: Notifications Window Messages
Message |
Description |
|
|
|
|
Time since engage |
Number of seconds or minutes since KAR was |
|
engaged. |
||
|
||
|
|
|
|
Time that KAR was unable to restore. Once KAR |
|
Time skipped |
has a successful solution, it tries to go backwards as |
|
far as possible. This is the difference between the |
||
|
||
|
restore time and the original cycle slip time. |
|
|
|
|
Minutes used |
Time that KAR used for a solution. It is not the time |
|
since engagement. |
||
|
||
|
|
|
Search distance |
This is the distance when the ambiguity search was |
|
performed. This is not the distance when KAR was |
||
|
restored. |
|
|
|
|
Avgerage num sats |
Average number of satellites used to compute KAR |
|
statistics. It is always be greater than or equal to 5. |
||
|
||
|
|
|
L2 Noise model |
Shows the model that KAR used for L2 during |
|
processing. See KAR Options on Page 70 for |
||
|
additional information. |
|
|
|
|
RMS |
This is the RMS fit of the KAR search, in cycles. |
|
Values better than 0.04 usually mean a correct |
||
|
solution. |
|
|
|
|
|
This is the ratio between the second best RMS and |
|
Reliability |
the best RMS. Ratios above 3 or 4 are usually a |
|
pass for dual frequency. The tolerance is variable |
||
|
||
|
depending on the float-fixed separation. |
|
|
|
|
|
This is the distance between the solved fixed integer |
|
Flt/Fix separation |
solution and the float solution at time of search. Low |
|
numbers mean a good correspondence between |
||
|
||
|
the two solutions. |
|
|
|
GrafNav / GrafNet 8.10 User Guide Rev 4 |
127 |

Chapter 2 |
GrafNav |
|
|
Table 9: Processing Window Parameters
Parameter |
Description |
|
|
|
|
Acceleration Vector |
Acceleration components in Local Level frame. |
|
|
|
|
Baseline Data (MB) |
Displays distance, carrier phase RMS, and number of |
|
satellites information for each baseline. |
||
|
||
|
|
|
Baseline Distance |
Distance separation for projects containing only one |
|
base station. |
||
|
||
|
|
|
Channel (Ambiguity) |
Displays the ambiguities, as well as their standard |
|
deviation, for each satellite being tracked. |
||
|
||
|
|
|
Channel (Az/Elev) |
Displays elevation and azimuth for each satellite being |
|
tracked, in degrees. |
||
|
||
|
|
|
Channel (Flag/Locktime) |
Displays status flag and locktime count for each satellite |
|
being tracked. |
||
|
||
|
|
|
DOPs |
Displays DD_DOP, PDOP, HDOP and VDOP. |
|
|
|
|
Estimated Accuracy |
Standard deviation of the position components in the |
|
Local Level frame. |
||
|
||
|
|
|
Geographic Position |
Displays position and antenna height of remote at current |
|
epoch. |
||
|
||
|
|
|
Local Level Vector |
Local Level vector in metres. |
|
|
|
|
Measurement RMS |
RMS and standard deviation of the L1 carrier phase and |
|
C/A code measurements. |
||
|
||
|
|
|
Speed/COG |
Vehicle instantaneous velocity vector in m/s, and course- |
|
over-ground. These values may be inaccurate for code- |
||
|
only processing. |
|
|
|
|
Status Flags |
Solution quality information such as number of satellites, |
|
quality factor and ambiguity status. |
||
|
||
|
|
|
Time/Epochs |
Displays time in seconds of the week, as well as a |
|
continuous count of epochs processed. The GPS week |
||
|
number is also shown. |
|
|
|
|
Velocity Vector |
Components of velocity in the Local Level frame. |
|
|
|
|
Channel Data B/L |
Allows for selection of baseline for which to display |
|
channel information. |
||
|
||
|
|
|
Table 10: Notifications for Static Processing |
|
|
|
|
Message |
|
Information |
|
|
|
RMS |
|
RMS value computed by fixed solution (should be less than 0.02), in |
|
metres |
|
|
|
|
|
|
|
|
|
This is the ratio between the second best RMS and the best RMS. |
Reliability |
|
Ratios above 3 or 4 are usually always a pass for dual frequency. The |
|
tolerance is 1.5. For single frequency, ratios are lower, but greater |
|
|
|
|
|
|
than 2 is usually correct. The tolerance for single frequency is 1.35. |
|
|
|
Frequency |
|
This means the data type used. If a fixed solution fails on a short |
|
baseline using dual frequency data, the software tries again using |
|
|
|
only single frequency. |
|
|
|
Time |
|
Amount of time used in the solution, in hh:mm:ss format |
|
|
|
|
|
Fixed static solution type used. Continuous looks for the best |
Type |
|
“continuous” overall time period/block of data. NewFixed (multi-sat) |
|
|
uses all of the data, although it may reject some satellite arcs. |
|
|
|
Progress
The Progress box shows whether the engine is processing in the forward or reverse direction, and how far along it is.
View
In the left-hand window, various parameters are available for display via the View button. The list of available parameters is given in Table 9.
Notifications
For kinematic processing, the Notifications window displays all information pertaining to the last KAR solution. Descriptions of the messages that are in Table 10.
For static processing, the Notifications window displays all information pertaining to the fixed solution. Descriptions of the messages that are displayed are in Table 8. Messages included in the
Notification Window for static processing are in Table 10.
128 |
GrafNav / GrafNet 8.10 User Guide Rev 4 |