

- •Table of Contents
- •Congratulations!
- •Scope
- •How to use this manual
- •Prerequisites
- •Conventions and Customer Service
- •What’s New!
- •Precise Point Positioning (PPP) processor
- •Software License
- •Warranty
- •Introduction and Installation
- •1.1 Waypoint Products Group Software Overview
- •1.2 Installation
- •1.2.1 What You Need To Start
- •1.2.2 CD Contents and Installation
- •1.2.3 Upgrading
- •1.3 Processing Modes and Solutions
- •1.4 Overview of the Products
- •1.4.1 GrafNav
- •1.4.2 GrafNet
- •1.4.3 GrafNav Lite
- •1.4.4 GrafNav / GrafNet Static
- •1.4.5 GrafMov
- •1.4.6 GrafNav Batch
- •1.4.7 Inertial Explorer
- •1.5 Utilities
- •1.5.1 Copy User Files
- •1.5.2 Download Service Data
- •1.5.3 GPS Data Logger
- •1.5.4 GPB Viewer
- •1.5.5 Mission Planner
- •1.5.6 Data Converter
- •GrafNav
- •2.1 GrafNav, GrafNav Lite and GrafNav / GrafNet Static Overview
- •2.2 Start a Project with GrafNav
- •2.3 File Menu
- •2.3.1 New Project
- •2.3.2 Open
- •2.3.3 Save Project
- •2.3.4 Save As
- •2.3.5 Print
- •2.3.6 Add Master Files
- •2.3.7 Add Remote Files
- •2.3.8 Alternate Precise / Correction Files
- •2.3.9 Show Master Files
- •2.3.10 Load
- •2.3.12 GPB Utilities
- •2.3.13 Remove Processing Files
- •2.3.15 Recent projects
- •2.3.16 Exit
- •2.4 View Menu
- •2.4.1 GPS Observations
- •2.4.2 Forward and Reverse Solutions
- •2.4.3 Processing History
- •2.4.4 Processing Summary
- •2.4.5 Return Status
- •2.4.6 Features
- •2.4.7 Objects
- •2.4.8 ASCII File (s)
- •2.4.10 Current CFG File
- •2.5 Process Menu
- •2.5.1 Process GNSS (differential)
- •2.5.2 Process PPP (single point)
- •2.5.3 Combine Solutions
- •2.5.4 Launch Batch Processor
- •2.5.5 Stop Auto Run
- •2.5.6 Load GNSS Solution
- •2.5.7 Load PPP Solution
- •2.5.8 Load Any Solution
- •2.5.9 Import Solutions and Setting
- •2.6 Settings Menu
- •2.6.1 GNSS Processing
- •2.6.2 PPP Processing
- •2.6.3 Coordinate
- •2.6.4 Individual
- •2.6.5 Datum
- •2.6.6 DEM Plotting
- •2.6.7 Photogrammetry
- •2.6.8 Manage Profiles
- •2.6.9 Compare Configuration Files
- •2.6.10 Preferences
- •2.7 Output Menu
- •2.7.1 Plot GPS Data
- •2.7.3 Plot Master / Remote Satellite Lock
- •2.7.4 Export Wizard
- •2.7.5 Write Coordinates
- •2.7.6 View Coordinates
- •2.7.7 Export Binary Values
- •2.7.8 Write Combined File
- •2.7.9 Build HTML Report
- •2.7.10 Export to Google Earth
- •2.7.11 Show Map Window
- •2.7.12 Processing Window
- •2.8 Tools Menu
- •2.8.1 Zoom In & Zoom Out
- •2.8.2 Distance & Azimuth Tool
- •2.8.3 Move Pane
- •2.8.4 Find Epoch Time
- •2.8.5 Datum Manager
- •2.8.6 Geoid
- •2.8.7 Grid/Map Projection
- •2.8.8 Convert Coordinate File
- •2.8.9 Time Conversion
- •2.8.10 Favourites Manager
- •2.8.11 Mission Planner
- •2.8.12 Download Service Data
- •2.9 Window Menu
- •2.9.1 Cascade
- •2.9.2 Tile
- •2.9.3 Next and Previous
- •2.9.4 Close Window
- •2.9.5 Close All Windows
- •2.10 Help Menu
- •2.10.1 Help Topics
- •2.10.2 www.novatel.com
- •2.10.3 About GrafNav
- •GrafNet
- •3.1 GrafNet Overview
- •3.1.1 Types of Networks
- •3.1.2 Solution Types
- •3.1.3 Computing Coordinates
- •3.2 Start a Project with GrafNet
- •3.2.1 Fix Bad Baselines
- •3.2.2 Unfixable Data
- •3.3 File
- •3.3.1 New Project
- •3.3.2 Open Project
- •3.3.3 Save Project
- •3.3.4 Save As
- •3.3.5 Print
- •3.3.6 Add / Remove Observations
- •3.3.7 Add / Remove Control Points
- •3.3.8 Add / Remove Check Points
- •3.3.9 Alternate Ephemeris / Correction Files
- •3.3.10 Remove Processing Files
- •3.3.11 Import Project Files
- •3.3.12 View
- •3.3.13 Convert
- •3.3.14 GPB Utilities
- •3.3.15 Recent projects
- •3.3.16 Exit
- •3.4 Process Menu
- •3.4.1 Processing Sessions
- •3.4.2 Rescanning Solution Files
- •3.4.3 Ignore Trivial Sessions
- •3.4.4 Unignore All Sessions
- •3.4.5 Compute Loop Ties
- •3.4.6 Network Adjustment
- •3.4.7 View Traverse Solution
- •3.4.8 View Processing Report
- •3.4.9 View All Sessions
- •3.4.10 View All Observations
- •3.4.11 View All Stations
- •3.5 Options Menu
- •3.5.1 Global Settings
- •3.5.3 Datum Options
- •3.5.4 Grid Options
- •3.5.5 Geoid Options
- •3.5.6 Preferences
- •3.6 Output Menu
- •3.6.1 Export Wizard
- •3.6.2 Write Coordinates
- •3.6.3 View Coordinates
- •3.6.4 Export DXF
- •3.6.5 Show Map Window
- •3.6.6 Show Data Window
- •3.6.7 Baselines Window
- •3.6.8 Processing Window
- •3.7 Tools Menu
- •3.8 Help Menu
- •GrafNav Batch
- •4.1 Overview of GrafNav Batch
- •4.1.1 Getting Started with GrafNav Batch
- •4.2 File Menu
- •4.2.1 New Project
- •4.2.2 Open Project
- •4.2.3 Save Project
- •4.2.4 Save As
- •4.2.5 Print
- •4.2.6 Add Baselines
- •4.2.8 Add Combined Baselines
- •4.2.9 Import CFG Files
- •4.2.10 Edit Selected Baseline Settings
- •4.2.11 Removing Selected Baselines
- •4.2.12 View ASCII Files
- •4.2.13 View Raw GPS Data
- •4.2.14 Convert GPS Data
- •4.2.15 GPB Utilities
- •4.2.16 Remove Process Files
- •4.2.17 Recent Projects
- •4.2.18 Exit
- •4.3 Process Menu
- •4.3.1 Process All Baselines
- •4.3.2 Process Selected
- •4.3.3 GrafNav on Selected Baselines
- •4.3.4 View Selected Processing Summary
- •4.3.5 Load All Solutions
- •4.3.6 Load Selected Solutions
- •4.4 Settings Menu
- •4.4.1 Global
- •4.4.2 Selected
- •4.4.3 Copy Processing Options
- •4.4.4 Load into Selected From
- •4.4.5 Manage
- •4.4.6 Preferences
- •4.5 Output Menu
- •4.5.1 Plot Selected GPS Data
- •4.5.2 View Selected Map
- •4.5.3 Export All
- •4.5.4 Export Selected
- •4.6 Tools Menu
- •4.7 Windows
- •4.8 Help Menu
- •GrafMov
- •5.1 Overview of GrafMov
- •5.2 Getting Started with GrafMov
- •5.3 File Menu
- •5.3.1 Add Master File
- •5.4 View Menu
- •5.5 Process Menu
- •5.6 Setting Menu
- •5.6.1 Moving Baseline Options
- •5.7 Output Menu
- •5.7.1 Plot GPS Data
- •5.8 Tools Menu
- •5.9 Interactive Windows
- •5.10 Help Menu
- •AutoNav
- •6.1 Overview of AutoNav
- •6.2 Getting Started with AutoNav
- •6.3 Base Station Files
- •6.4 Remote Files
- •6.5 Interactive Windows
- •File Formats
- •7.1 Overview of the File Formats
- •7.2 CFG File
- •7.3 GPS Data Files
- •7.3.1 GPB File
- •7.3.2 STA File
- •7.3.3 Old Station File Format
- •7.3.4 EPP File
- •7.4 Output Files
- •7.4.1 FML & RML Files
- •7.4.2 FSS & RSS Files
- •7.4.3 FWD & REV Files
- •7.4.4 FBV & RBV Files
- •Utilities
- •8.1 Utilities Overview
- •8.2 GPB Viewer Overview
- •8.2.1 File
- •8.2.2 Move
- •8.2.3 Edit
- •8.3 Concatenate, Splice and Resample Overview
- •8.3.1 Concatenate, Splice and Resample GPB Files
- •8.4 GPS Data Converter Overview
- •8.4.1 Convert Raw GPS data to GPB
- •8.4.2 Supported Receivers
- •8.5 GPS Data Logger Overview
- •8.5.1 Getting Started with WLOG
- •8.5.2 File
- •8.5.3 Display
- •8.5.4 Plot
- •8.5.5 Zoom Menu
- •8.5.6 Events Menu
- •8.6 WinCE Data Logger Overview
- •8.6.1 Installing CELOG
- •8.6.2 Getting Started with CELOG
- •8.6.3 Variable Display File
- •FAQ and Tips
- •9.1 Overview of FAQ and Tips
- •9.2 General FAQ and Tips
- •9.2.1 How can I store Master Station Coordinates?
- •9.2.2 How can I obtain Master Station Coordinates?
- •9.2.3 How can I customize output formats?
- •9.2.4 How can I download base station data?
- •9.3 Kinematic Processing FAQ and Tips
- •9.3.2 Should I combine forward and reverse solutions?
- •9.3.3 How can I use static / kinematic flags?
- •9.3.4 How do I eliminate problem satellites?
- •9.3.5 How do I set the measurement standard deviations?
- •9.3.6 How do I control bad data?
- •9.3.7 How do I avoid missing epochs?
- •9.3.8 Should I avoid using RINEX for kinematic data?
- •9.3.9 How do I process kinematic data logged during an ionospheric storm?
- •9.3.10 How do I process long kinematic baselines?
- •9.4 Integer Ambiguity Determination Tips
- •9.4.1 How can I detect and fix incorrect integer fixes?
- •9.4.2 How can I help KAR/ARTK find a solution?
- •9.4.3 How can I use KAR and ARTK to improve poor combined separations?
- •9.5 Static Processing FAQ and Tips
- •9.5.1 Can I use GrafNet for static batch processing?
- •9.5.2 Can I use kinematic processing on static baselines?
- •9.5.3 Using KAR or ARTK in GrafNet
- •9.5.4 How can I optimize the fixed static solution?
- •9.5.5 How can I refine L1/L2 integer solutions?
- •9.5.6 Can I use a larger interval for static processing?
- •9.5.7 How do I process static data logged during ionospheric storms?
- •9.5.8 How do I process long static baselines?
- •9.6.1 How should I choose a processing mode?
- •9.6.2 How important are base station coordinates?
- •9.6.3 How can I use the MB Plots?
- •9.6.4 How do I select a data interval?
- •9.6.6 How should I decide which base stations to use?
- •9.6.7 How do I deal with problematic baselines?
- •9.6.9 How can I use the fixed static solution?
- •9.6.10 What is the best way to process data with large base to rover separations?
- •9.6.11 How can I speed up processing?
- •9.7 PPP (Precise Point Positioning)
- •9.7.1 What is Precise Point Positioning?
- •9.7.2 How does PPP differ from differential processing?
- •9.7.3 How accurate is PPP?
- •9.7.4 What is PPP used for?
- •9.7.5 Who should use PPP?
- •9.7.6 Are there any limitations to PPP?
- •9.8 Common Inquiries
- •9.8.1 How can I determine the quality of a final solution?
- •9.8.2 How do I copy user files?
- •9.8.3 How do I update manufacturer files?
- •9.8.4 How do I produce local coordinates?
- •9.8.5 How do I define a local cartesian coordinate system?
- •9.8.6 How do I define a local coordinate grid?
- •9.8.7 How do I process an aerial survey with camera event marks?
- •9.9 Digital Elevation Models (DEM) FAQ and Tips
- •9.9.1 Why would I use a DEM?
- •9.9.2 What are the DEM sources?
- •9.9.3 What DEM formats are supported by GrafNav?
- •9.9.4 How do I handle large DEMs?
- •9.10 Datum FAQ and Tips
- •9.10.1 What are the available datums - related features?
- •9.10.2 How are datums handled within the software?
- •9.10.3 How do I make additional datums available?
- •9.10.4 How do I enter a 7-parameter transformation?
- •9.10.6 How do I use NADCON conversion files?
- •9.10.7 How do I prevent corruption from conversion errors?
- •9.11 Projections FAQ and Tips
- •9.11.1 What features are available with map projections?
- •9.12 Geoid FAQ and Tips
- •9.12.1 What are the available geoid - related features?
- •9.12.2 How can I create a WPG file?
- •A: Output Variables
- •B: Antenna Measurements Diagram
- •C: Summary of Commands
- •Index
Chapter 9 |
FAQ and Tips |
|
|
Figure 6: The Effect of Bad Base Station Coordinates in MB Processing
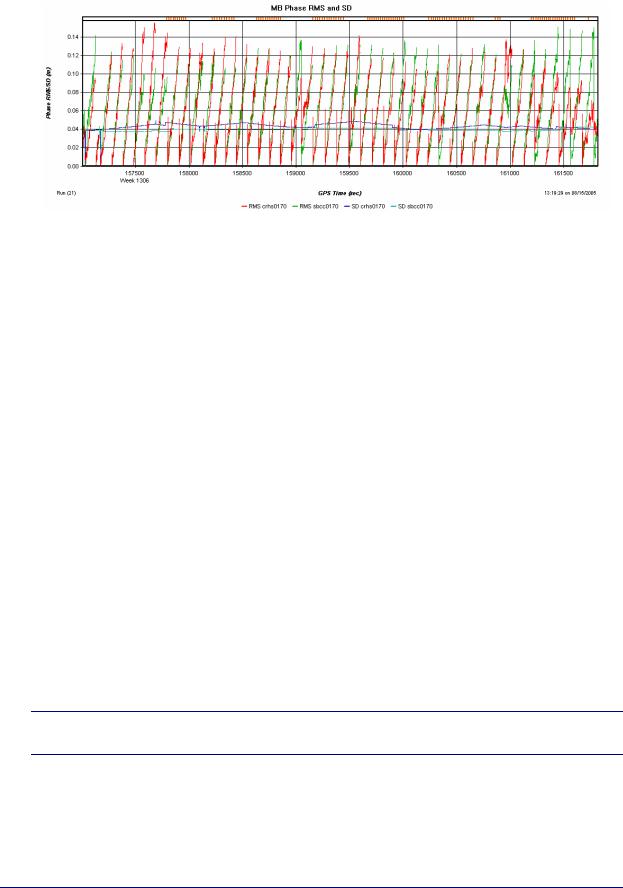
9.6.3How can I use the MB Plots?
When using the MB-KF methodology, a number of new plots are available. These utilize the FBV/RBV files that are produced in addition to the regular ASCII outputs. Binary Value (FBV/RBV) files contain separate statistics for each baseline and satellite. The Output | Plot Multi-Base feature shows the baseline values. Here are some of the more common plots, list in order of usefulness:
Carrier Phase RMS/SD
Shows carrier residuals for each baseline along with measurement standard deviations. This plot indicates how well the carrier phase fits with the overall solution. It also shows errors in base position, and it can be used to determine if one baseline is worse than another.
Number of Baselines
Shows how many baselines are used for processing. This is important to check as it will indicate if any baselines are ignored or rejected during data line-up.
Distance Separation
Shows distances from remote to each of the base stations.
Effective Weighting
This number is computed after the fact as is an approximate indicator of how much weight each baseline has. This value is not used to compute the solution, but it can be very helpful in indicating which baseline has the most weight. It is most affected by proximity, but the number of satellites can have an effect as well.
Carrier Separation
Shows the difference between combined KF solution and individual baseline solutions using code+carrier. It is not really a measure of accuracy, but it does indicate how well multiple baselines fit to each other.
Number of Satellites/DOP
You can plot the number of satellites and/or DOP values. This shows if one base is tracking fewer satellite than another. For very large areas, it also shows the effect of different satellites being above the elevation mask.
Tip: Consider creating a group of one or more of the above plots to help you load them faster. Regularly used data plots can be included in the group as well.
272 |
GrafNav / GrafNet 8.10 User Guide Rev 4 |

FAQ and Tips |
Chapter 9 |
|
|
|
|
9.6.4How do I select a data interval?
In theory, all base stations do not need to be logged at the same data interval but, in reality, they should be. The MBKF methodology can handle data with varying data rates, but the constant dropping in and out of base data will result in closer bases possibly not being used when they should. In addition, it may destabilize the filter. In the sequential method, processing is not affected, but a bumpy trajectory can be produced after combining.
For these reasons, both GrafNav and GrafNav Batch can resample data right within the interface. See View | GPS Observations | Master | Resample/Fill Gaps, using | Processing Interval, and be sure to set the processing interval to the remote data interval before performing this operation. You can also select View | GPS Observations | Master | Resample/Fill Gaps using | Remote File Times, which resamples to each exact epoch in the remote file. If only one remote file is processed, this is works well. If many remotes are present for the same time, then data gaps in the remote used for resampling causes drop-outs at the resampled master.
9.6.5How do I handle data drop-outs at the master station?
Isolated data gaps are not as severe as differences in the interval. However, depending on the frequency, side effects can be present as well. For this reason, GrafNav will prompt you to resample the master data if small gaps are detected while creating a new project. This process will fill in these gaps. Resampling can always be performed in the manner described in Section 9.6.4, on Page 273 . This operation is suggested if a significant number of drop-outs are present. To determine how many data gaps there are, select View | GPS Observations | Master | Show Time Gaps.
9.6.6How should I decide which base stations to use?
In general, only base stations that are within the project area should be included. This is because stations farther away will hinder, rather than help, results as they only serve to add increased errors due to tropospheric and ionospheric effects. As a general rule of thumb, if a base station never becomes the closest station, it should not be included. In addition, using two stations very close together adds nothing in comparison to just using one. In such a case, if different, pick the base that tracks the most satellites.
9.6.7How do I deal with problematic baselines?
Poor baselines can be defined with the following criteria:
1.One baseline continuously tracking fewer satellites than the others. See Number of satellites under
Tools | Plot Multi-Base.
2.KAR regularly resolving incorrectly, or not at all, on one baseline but not the others.
3.Numerous cycle slips in the Message Log files stemming only from one base.
4.Print cycle slips to message log must be enabled under the Advanced 1 tab.
5.Numerous bad data messages (those starting with $$$) are present in Message Log files (FML/ RML) and seem to stem only from one base station.
6.Having larger carrier phase or C/A code RMS residuals. See C/A Code and Carrier Phase Measurement Residual RMS plots under Tools | Plot Multi-Base.
For the first three cases, eliminating the baseline only from KAR should be sufficient. This is performed from
Settings | Individual | General, by clicking the Omit… button. Reject all satellites, on the selected baseline for the entire data set, but from KAR/Fixed-Static only.
For the fifth case, there are two approaches. The easiest is to disable it, which works best in most cases. Disabling can be performed a number of ways, but the easiest is to right-click on the base in the Map Window, and click Edit. Once the Disabled option is selected, the base station symbol should have a red X on it. The other alternative is to deweight it, which is done from Settings | Individual | Measurement. From the Values are for list under the Measurement
GrafNav / GrafNet 8.10 User Guide Rev 4 |
273 |

Chapter 9 |
FAQ and Tips |
|
|
Standard Deviations box, select the problematic baseline. Disable the Use main settings option. Enter code and carrier phase standard deviations that are more representative of the data for this baseline. You may also wish to disable this baseline from KAR as well, which is explained in the paragraph above.
For the fourth case, disabling the base station is the best approach. See the paragraph above for help.
9.6.8Can I use KAR and ARTK with MB-KF processing?
In general, very little is different. By default, KAR uses the closest baseline for resolving KAR, or all those under 8 km. After the KAR fix, the other baselines is fixed to the same location as well. ARTK tries to fix to all the baselines, but, generally, only the closest is used.
A useful setting (for corridor work especially) is the Engage if distance < tolerance1, reset if > tolerance2 option. It engages KAR on the first occurrence the proximity to each base is less than tolerance1. KAR engagement is reset if distance is greater than tolerance2. The values tolerance1 and tolerance2 may need to be refined for a particular data set.
This latter feature is a useful means of taking advantage of periods where the remote is close to base stations in order to improved fixed integer accuracies. The only disadvantage of using this method is that KAR may engage in the middle of the flight line, possibly causing a position shift, which is not necessarily desirable during image, laser or SAR data capture. The only alternative is to manually fix KAR during the turns, although this approach is more time consuming, but can ensure that engagements do not happen during data capture.
9.6.9How can I use the fixed static solution?
KAR is the most common way to resolve fixed integer ambiguities, but the fixed solution works well too and can often be more accurate. It obviously needs a static period of a few minutes for dual frequency, while longer times are needed for longer baselines. For MB-KF processing, this process becomes more complex because GrafNav attempts to compute a fixed solution to all baselines. It will disable those where the distance or time is too long or short, respectively. See Settings | Individual | Advanced.
For each static period, only one fixed solution will be utilized for “fixing”. A number of criteria are used to pick the best one, including distance, RMS, reliability and estimated standard deviation. The fixed solution used, will be signaled as BEST in the GrafNav interface. To view the solutions, right-click on the static sessions, or select View | Objects | KAR/Static. Click the View button for the desired static session. All of the static sessions will be shown. For combined solutions, both forward and reverse will be shown. In addition, a Combined static solution may also be computed. This is signaled as PRIMARY, and these solutions are only used for exporting and do not affect processing. In summary, each static session has one BEST solution for each direction, which is used to fix the kinematic trajectory. Each session will then have one PRIMARY solution used for exporting. In some cases, both solutions will be the same.
If the BEST fixed solution used is deemed in incorrect from the forward/reverse separation or other means, then it can be disabled from the fixed solution. To do this, first note the start/end times of the static session by clicking Edit from the Object Menu. From the Settings | Individual | General, click the Omit… button. After clicking Add, disable all satellites from the erroneous baseline for the noted time period. Be sure to select KAR/Fixed-Static only and to reprocess.
9.6.10 What is the best way to process data with large base to rover separations?
Some projects have numerous base stations that are very far apart. For instance, if the maximum distance between bases is greater than 250km, the Kalman filter can become destabilized during multi-base processing. There will be multiple error messages and filter resets shown in the message log (look for the $$$ identifier), and there are two ways to deal with this effect:
1.Limit the maximum base-rover distance. This effectively rejects base stations when they become too distant. At least one base will always be used (even if it is outside the provided tolerance). However, care should be taken to ensure that at least two base stations are within the distance tolerance at all times. The baseline distance can be limited under the Measurement tab, while the
274 |
GrafNav / GrafNet 8.10 User Guide Rev 4 |