

Chapter 2 |
GrafNav |
|
|
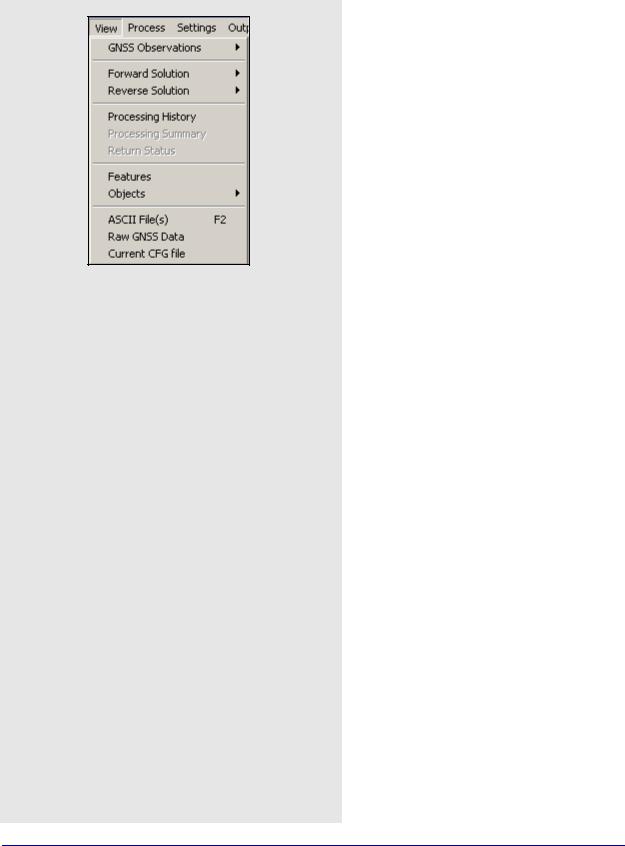
2.4 View Menu
Messages reported from message log
•Times at which KAR was engaged and the reasons for its engagement. These messages are preceded by ***.
•Any satellites with no ephemeris information.
•Epochs of less than 4 common satellites between the master and remote.
•Periods of extremely poor satellite geometry where the DD_DOP is greater than 100. The epochs are skipped and not used for plotting or outputting. This message is the only means of determining these periods.
•The occurrence of cycle slips. This log gives a time and record of these slips that mean problems in kinematic data.
•Data errors, like invalid measurements, that cause filter resets or the rejection of satellites. These messages are preceded by $$$.
•Entering static and kinematic modes.
•Events resulting from significant changes in the satellites’ geometry. These include changes in the base satellite and the rising or falling of satellites above or below the elevation mask.
•The fixing of the remote’s position. These messages are preceded by ###.
•The omission of satellites, baselines or time periods from processing.
2.4.1 GPS Observations
This option gives you access to all the features listed in Object menu found under File | Show Master Files | View/Edit GPS for all master and remote files in the for a list of the features.
2.4.2Forward and Reverse Solutions
GNSS / PPP Message Log
This file displays all messages sent to the message window during processing. There is one present for each direction processed. Possible messages reported here are listed in the shaded box.
52 |
GrafNav / GrafNet 8.10 User Guide Rev 4 |

GrafNav |
Chapter 2 |
|
|
|
|
GNSS Static/KAR Summaries
This summary file displays the processing settings and the statistics for successful KAR fixes and static sessions. Other items reported in this summary are listed in the shaded box. See Chapter 7 on Page 207 for an example of this summary file.
GNSS / PPP Trajectory
This file gives a detailed output for each epoch. It keeps a record of the data computed during kinematic processing. There is a plot available for most of the statistical information contained in these files. This file is normally used for the following reasons:
•Comparison of numerical values between epochs or solutions.
•Searching for information relevant to a specific epoch via use of the F3 key.
•Determining which satellites were used in the solution and which was designated the base satellite.
•See Section 7.4.3, on Page 219 for a complete description of both the old and new output formats.
Static/KAR summary report items
•Final solutions for all static sessions, as well as type of solution obtained.
•Time and place at which KAR engaged successfully, as well as the corresponding statistics. Such information is useful for evaluating whether or not KAR resolved ambiguities correctly.
•Processing settings, including datum information, as well as master station coordinates.
•Satellite usage information pertaining to static sessions.
•Slope, horizontal, and corrected ellipsoidal distances for all static sessions.
•Program completion information.
GrafNav / GrafNet 8.10 User Guide Rev 4 |
53 |
Chapter 2 |
GrafNav |
|
|
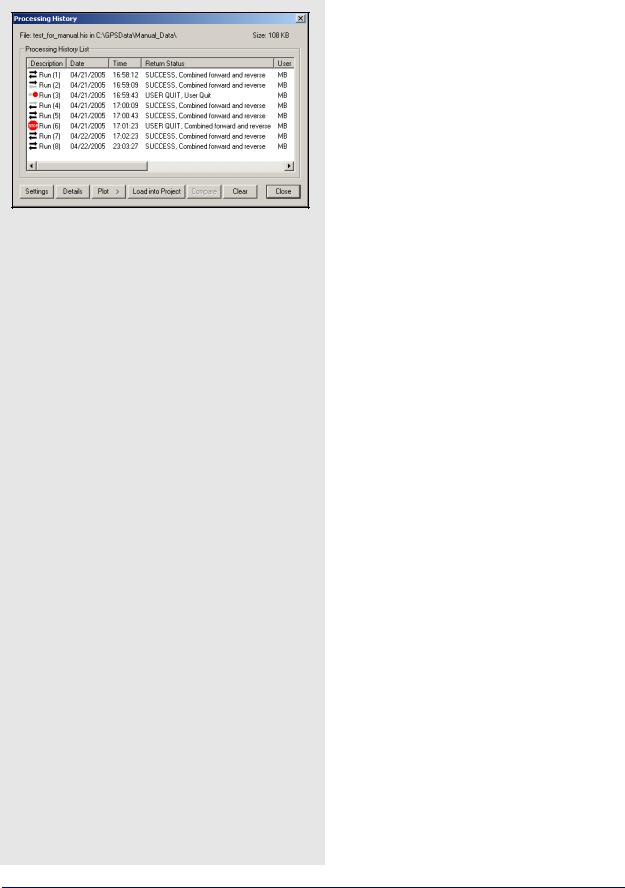
Processing history view options
Settings
Brings up the processing settings used for the selected run.
Details
Displays more information about the selected run, including the following option for the configuration file.
Save CFG As
Saves the processing settings into a new configuration file. This is an effective way to start a new project using a previous configuration. You are prompted to enter a new name.
Plot
Accesses the Combined Separation, Estimated Position Accuracy, Quality Factor and Float/Fixed Status plots for the selected run. Be aware that if processing was not performed successfully in each direction, certain plots can be unavailable or incomplete. This feature is very useful for comparing different runs.
Load into Project
Loads the processing settings for the selected run into the current project. You are prompted to backup the current project to a BAK file.
Compare
Compares two configuration files that are selected by holding down the Ctrl key. This feature is useful for determining the difference between the settings used for two runs.
Clear
Deletes the entire processing history.
2.4.3Processing History
This feature displays the processing history in a chronological list and can be used to restore a previous processing run. It contains the date and time when each run was performed. It also contains a description of the run, including the directions being processed, your initial processing settings and the return status. View options in the Process History box are listed in the shaded box.
2.4.4Processing Summary
This option gives statistics on the current solution loaded in GrafNav. It is for kinematic processing and static processing. The Processing Summary options are the following:
•Solution type
•Baseline distances
•Number of epochs not processed, percentage of epochs having double difference DOP over 10 and epochs with bad measurements
•Total number of epochs
•Quality number percentages
•Estimated position standard deviations calculated from the Kalman filter
•RMS values of the GPS measurements and the RMS forward/reverse separation values for east, north and height.
Where the float solution has had time to converge to a lower value of error since the larger error values occur at the beginning of the processing direction, the RMS values are represented for 25%-75% weighting. These values take into account the weighting of the forward/reverse combined solution in this percentage range. This also applies to a KAR fixed solution. The RMS values for the 25%-75% weighting of the combined solution are generally lower than the RMS values from the forward/reverse separation because if one solution has high error values, most of the weight is placed on the other processing direction. C/A code and L1 phase measurements are deemed unacceptable based on the standard deviation rejection tolerances and PPM distance error specified in the processing options.
The Processing Summary can be added to the end of an output text file created through the Export Wizard. See Section 2.7.4, on Page 111 for information about the Export Wizard.
54 |
GrafNav / GrafNet 8.10 User Guide Rev 4 |

GrafNav |
Chapter 2 |
|
|
|
|
2.4.5Return Status
This option displays the processing status of the most recent processing run. This feature allows you to see whether the processing was successful. It shows the contents of the Finish{} record in the FSS/RSS file.
2.4.6Features
The Feature Editor window is used for the following reasons:
•Examining which features are loaded.
•Examining the quality/accuracy of features after processing.
•Examining the time difference, azimuth and distance between successive marks to identify timing and numbering errors.
•Editing station feature names, timetags, as well as antenna heights and models. For camera marks, the line number can be inserted into Desc/ Info field.
•Re-numbering stations and camera event marks.
•Disabling features so that they are not displayed or exported.
•Editing the crab/drift angle for applying 3-D offsets to camera event marks.
The shaded box has a list of the columns that are displayed.
Changes made to stations are now saved automatically to an NST file. To revert back to the original station information, use File | Load | Station File or File | Load | Camera Event Marks.
Displayed in the Features Editor window
Name
The name of the feature. The symbol next to the name is the type of point. Examples include a station, camera mark or GIS mark. The symbol appears grey if the feature has been disabled.
Time
This is the feature’s GPS capture time. To show the time in HH:MM:SS, select Show HMS.
Q
Shows quality number of the feature’s solution:
1= fixed integer |
3 & 4 |
= converging float |
2 = stable float |
5 & 6 |
= DGPS |
Std(m)
Combined standard deviation of the north, east and height components, including additive PPM based error.
Fix
Shows the ambiguity status of the feature’s solution:
Y = fixed integer |
N = float solution |
Azimuth
Azimuth, in degrees-minutes-seconds, from previous feature to current feature.
Dist(m)
Distance, in metres, from previous point to current point.
Dt(s)
Time difference, in seconds, between current and previous point.
Height
Height, in metres, of feature. This is normally an ellipsoidal height, but if the master station height was entered as orthometric, then this height is more orthometric. Use the Export Wizard to get the exact orthometric height. For stations, like STA and GIS, with antenna heights, this height is of the monument and not the antenna.
Name
Repeat of the feature name.
AntHgt
The height of the antenna above the monument. Camera marks do not have an antenna height, and so N/A is displayed.
Desc/Info
Describes the feature or line information for the camera mark.
Remarks
Remarks field.
GrafNav / GrafNet 8.10 User Guide Rev 4 |
55 |

Chapter 2 |
GrafNav |
|
|
Options in the Features Editor window
Move to Static
Use this option for surveys with short static segments. This process moves stations within static sessions to the end-points. Each static session with a station is replaced with one at the start and one at the end. The remarks field is modified to be BEGIN_STATIC or END_STATIC and notifies the Export Wizard to combine the two solutions upon output. During combining, features where the begin solution and end solution do not match are flagged to aid quality control. This option only works for static sessions with features.
Global Edit, Re-Number and Move to Static work with multiple features selected. To select a continuous block, hold down the Shift key while clicking on features. To select individual features, use the Ctrl key.
Add Station
Lets you manually add a station. Also add stations by right-clicking on epochs in the map window. You might want to add stations to static sessions that have none because static sessions cannot handle a varying antenna height and a station can.
Remove
Removes the selected stations. Multiple stations can be selected and you might consider disabling a feature instead of deleting it.
Edit
Edits the station name, time-tag, description and antenna height of the selected feature.
View Info
Shows processing information for any selected feature enabled during processing.
Global Edit
Make changes to multiple selected features. Modifications can be made to the antenna heights, descriptions, camera line information, remarks and drift/crab angles.
Re-Number
Re-number a selection of stations. Numbering can be performed starting from the bottom or the top of the list. You can specify the starting number and the increment value. To decrease numbers, use a negative number.
The shaded box contains a list of the options that are available with the buttons on the right-hand side of the Features Editor window.
56 |
GrafNav / GrafNet 8.10 User Guide Rev 4 |