

GrafNav |
Chapter 2 |
|
|
|
|
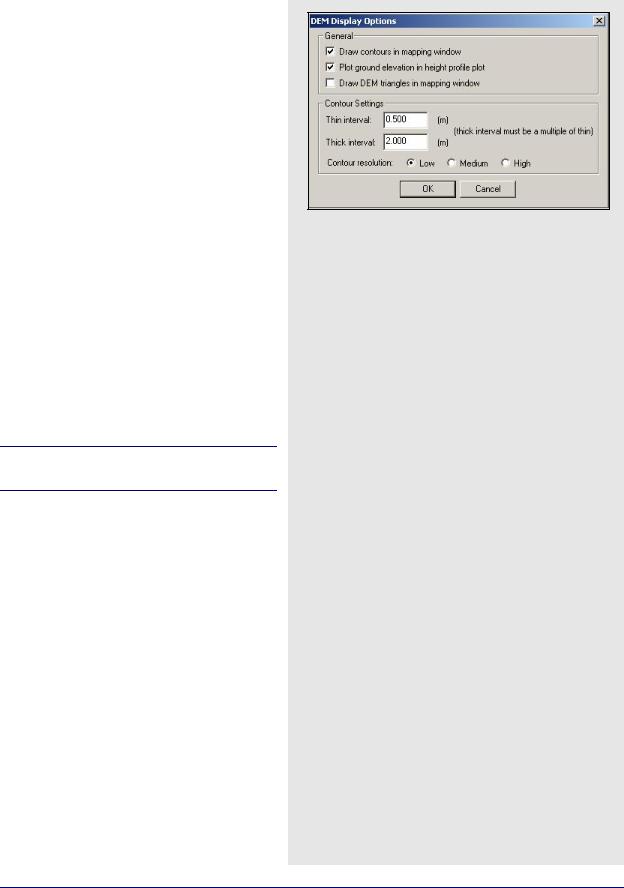
2.6.6DEM Plotting
Using the DEM plotting options speeds up issues concerning the use of large DEMs.
General
Drawing contours in the Map Window
This shows up with the trajectory to display a topographic representation of the GPS survey. Zoom in to view the elevation of each contour.
Plotting the ground elevation in the height profile plot
Compares the ground height to the height of their trajectory. Sometimes the ground height slows down the plotting of the height profile. Turing this off allows you to only view the height of the trajectory.
Drawing the DEM triangles
Displays the TIN model of the network formed. Turning these options off reduces any sluggish response from the program when viewing the
Map Window.
Contour Settings
You can also control the interval of the contour elevations by entering the thick and thin line intervals.
The thick interval must be a multiple of the thin.
Contour resolution
Selecting a higher resolution shows more smoothness in the contour lines and gives more details. It might also slow down CPU response and use more RAM. Having a lower contour resolution speeds up the response from GrafNav.
GrafNav / GrafNet 8.10 User Guide Rev 4 |
99 |
Chapter 2 |
GrafNav |
|
|
The methods of interpolation supported by GrafNav
Linear
This interpolation model is the simpler of the two and gives no RMS statistics. It fits a line between the two nearest epochs and places the camera mark on it. It is simple but effective.
Polynomial
This method uses a 2nd order polynomial and gives the best accuracies, but it can sometimes induce larger errors if epochs are missed or dynamics are very high. This can be detected by viewing the RMS value computed for each camera pulse. To do this follow these steps:
1.Click on the station or write the coordinates.
2.Select Features and use no geoid correction.
In such cases, the linear interpolation model deliver better results. You can also change the size of the window that the polynomial fits into. Ideally, this number should be kept at 4, but it can be increased for more averaging.
Only use this when very high data rates are available.
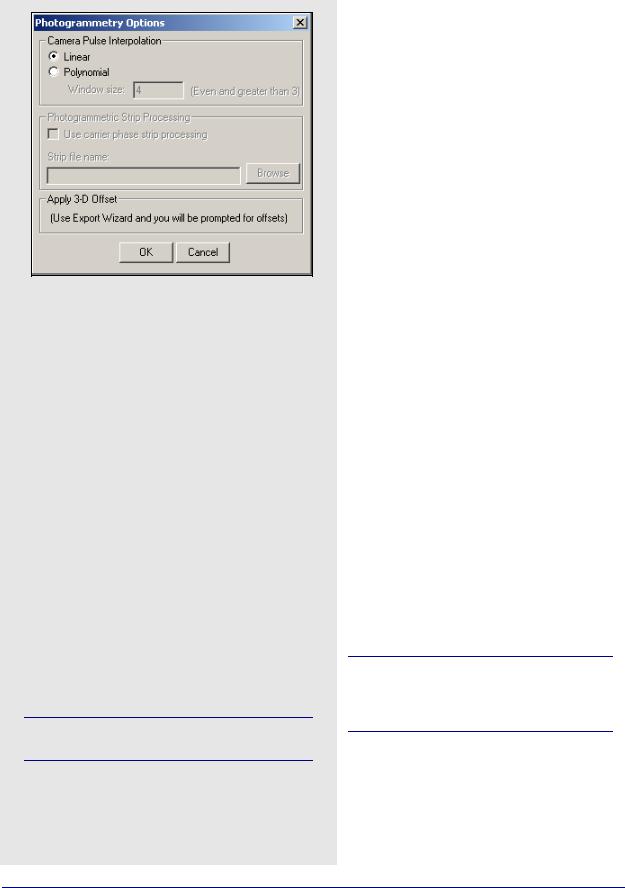
2.6.7Photogrammetry
These options are useful to GrafNav for GPSassisted aero-triangulation. This includes control over how interpolation is implemented.
Camera Pulse Interpolation
These options determine how the camera marks are interpolated. See Section 2.3.10, on Page 41 for help loading camera marks. Since each photograph is seldom taken on the even epoch, it must be interpolated to compute a proper position. Two methods of interpolation supported by GrafNav are listed in the shaded box.
Photogrammetric Strip Processing
This option is no longer supported by the software.
Apply 3-D Offset
Lets you apply a 3-dimensional offset from the antenna to the measurement device (entry nodal point on aerial camera). The offset is defined in the local body system of the aircraft, and not the camera. See Section 2.7.4, on Page 111 for more information.
Load Settings From
This feature loads configuration settings from one of the following:
•Factory Defaults: Built-in default settings (cannot be altered).
•GrafNav Defaults: Start-up settings that can be altered. Otherwise, same as Factory Defaults.
•Pre-loaded Profiles (for example, Airborne,
Low Cost, Tree Cover, and so on.): These are settings that come pre-loaded with the software.
•User-created Profiles: These are profiles that have been created by you.
When using a profile, all processing settings can potentially be edited, except those found in the Process tab. See Process on Page 61 for help with these settings.
100 |
GrafNav / GrafNet 8.10 User Guide Rev 4 |
GrafNav |
Chapter 2 |
|
|
|
|
2.6.8Manage Profiles
Project /Profile Tools
New from Project
Creates new CFG profile using the current project's settings.
Load into Project
Same as Load Settings From under Settings menu. This option loads the settings from the selected profile into the current project.
Update with Project
Updates the CFG profile with the current project settings.
CFG Profile Tools
Edit GNSS/PPP/IMU
Brings up the processing settings menu to allow the selected CFG profile to be modified.
Rename
Allows profile to be renamed.
Delete
Deletes the selected profile.
Copy
Creates a copy of the currently selected profile.
Modifications to pre-loaded settings are lost if software is re-installed.
2.6.9 Compare Configuration Files
This feature allows you to make a direct comparison between the settings in two different configuration files. This utility scans both of the specified CFG files and creates a report outlining all the differences found. For each setting found to be different between the two files, the report displays the values from both CFG files used for that particular setting. A total count of the number of differences appears at the bottom of the report.
GrafNav / GrafNet 8.10 User Guide Rev 4 |
101 |
Chapter 2 |
GrafNav |
|
|
Coordinates for Display
Geographic
Displays the latitude and longitude on the screen. The orientation is such that the positive y-axis is true north.
Local level
Shows the vector difference between the master and remote. It is most useful for GrafMov where you can see the relative separation rather than the absolute position, which tends to be less meaningful.
Grid
Displays the coordinates in the grid selected under
Settings | Grid.
The UTM zone has not been set. In such a case, the display may be severely rotated. Be sure to set the zone correctly. See Section 2.6.5, on Page 97 for help.
Map/distance units
Changes the units of the values being displayed for local level or grid coordinates in the Map Window. Changes the units displayed when using the Distance & Azimuth tool as well. See Section 2.8.2, on Page 129 for information.
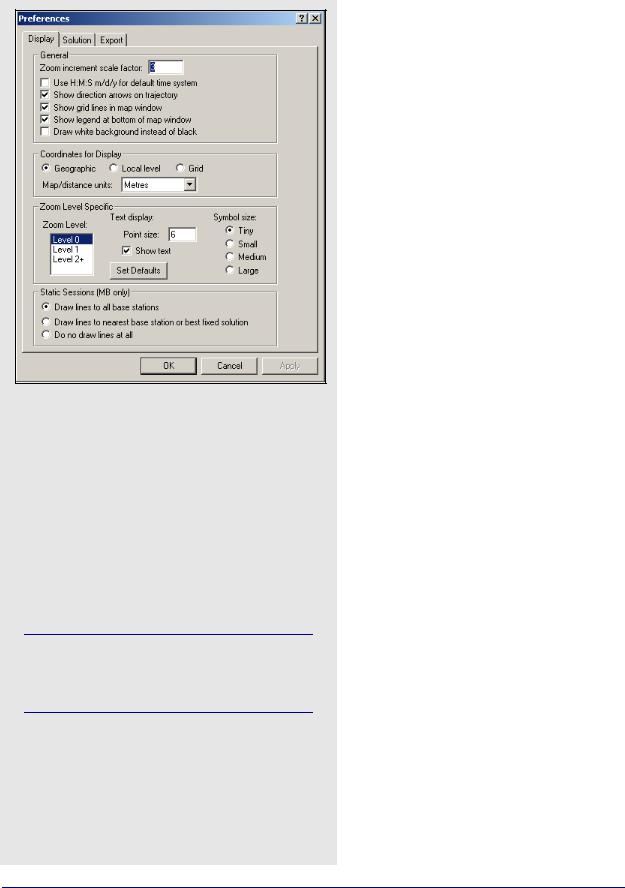
2.6.10Preferences
Display
This option allows you to edit the Map Window display and other preferences.
General
The following settings are available:
Zoom increment scale factor
The default is 3, although you can change this to any positive integer.
Use H:M:S m/d/y for default time system
Encourages GrafNav to display time in the described format instead of seconds of the GPS week.
Show direction arrows on trajectory
Shows arrows in the direction of travel on the map screen.
Show grid lines in map window
Displays grid lines.
Show legend at bottom of map window
Toggles the display of the color-coded quality numbers legend.
Draw White background instead of black
Changes the background colour of the Map Window from black to white.
Coordinates for Display
The settings are listed in the shaded box.
Zoom Level Specific
This set of options is based on the Zoom Level specified.
Zoom Level
Level 0 is the main screen without being zoomed. Each level has its own set of default display options that can be changed to your preferences.
Text Display
Controls the font size. The Show Text option allows text to be seen on the screen.
Symbol Size
Controls the symbol display.
Static Sessions (MB only)
You can choose whether to plot the static session lines to all base stations, to the nearest base station, or not to draw any lines at all.
102 |
GrafNav / GrafNet 8.10 User Guide Rev 4 |
GrafNav |
Chapter 2 |
|
|
|
|
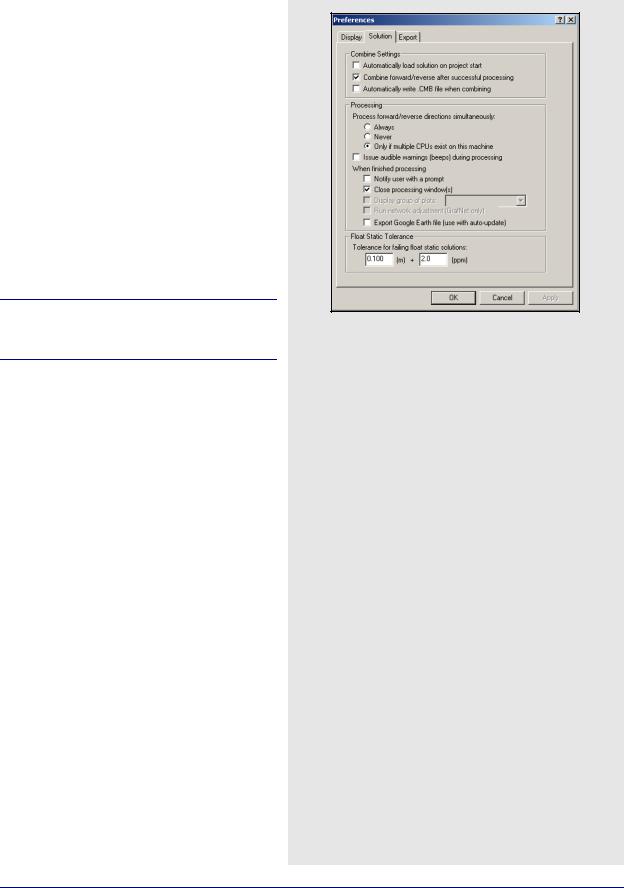
Solution
Combine Settings
The following settings are available:
Automatically load solution on project start
Loads the FWD and REV files into the project once a CFG file is opened.
Combine forward/reverse after successful processing
Automatically loads the combined solution into the project after processing forward or reverse direction. A combined solution is always loaded after processing both directions.
Automatically write.CMB file after processing
Writes a CMB file after processing.
This slows down the CPU response after processing if a large project has been processed.
Processing
Enhanced processing is available with dual processors. The options are listed in the shaded box.
Float Static Tolerance
Allows you to configure the equation used to determine whether a float static solution passes or fails. If you are a Seismic use, you might want to raise this tolerance to limit the number of failing sessions.
Processing Options
Process forward/reverse directions simultaneously
This feature cuts dual CPU processing time in half and improves dual core machine processing by roughly 2030% because the software processes the forward and reverse directions at the same time. With one processor, avoid using this option because it is faster to process each direction sequentially.
Issue audible warnings (beeps) during processing
Certain events result in a sound effect being played. This option allows you to turn these sounds effects on or off.
When finished processing
Notify user with a prompt: Displays a message at the center of the screen once processing is complete. When disabled, you will hear a beep after processing, unless an error occurs.
Close processing window(s): Closes all processing windows after completion.
Display group of plots: If you have defined a group of plots under Output | Plot Results, then you may select it here for automatic display. See Section 2.7.1, on Page 105 for help creating a group of plots.
Export Google Earth file: The software writes a KML/ KMZ file to the HTML folder, which is located in the project folder. If the Output | Export to Google Earth | Create Auto-Update Entry option has been used, then Google Earth updates the new trajectory.
GrafNav / GrafNet 8.10 User Guide Rev 4 |
103 |
Chapter 2 |
GrafNav |
|
|
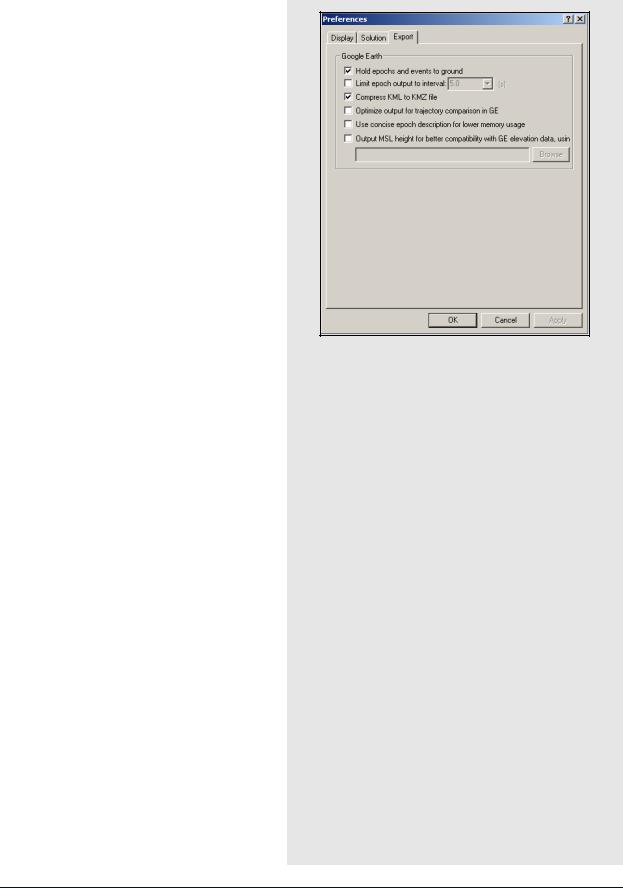
Export
Hold epochs and events to ground
This option plots the trajectory on the ground in Google Earth. This option is recommended for ground surveys.
Limit epoch output to interval
You can reduce the density of the output trajectory by specifying an interval here. This helps reduce file size and loading times in Google Earth.
Compress KML to KMZ file
Due to their ASCII nature, KML files can be quite large. The KMZ format allows for a much smaller file without losing any information.
Optimize output for trajectory comparison in GE
By default, the software overwrites the same project KML/KMZ file, while using the Quality Number to determine the color of the epochs used for display purposes. However, if you wish to compare multiple solutions for the same trajectory, enable this option to ensure that a new output file is written. To make it easier to distinguish between each solution in Google Earth, each new output file will be assigned its own specific colour. That is, the Quality Number is ignored. In addition, a new folder is created if the Run descriptor has changed.
Use concise epoch description for lower memory usage
The default output files written by the software contain a lot of additional information, which can really slow down Google Earth. If this information is not needed in the output file, a more concise output file can be written.
Output MSL height for better compatibility with GE elevation data, using
Google Earth is expecting orthometric (mean-sea- level, MSL) height values. As such, if Hold epochs and events to ground is disabled, the plotted height may be below ground level (if the geoid undulation is negative) and the object is at ground level. Use the Browse button to locate the Waypoint Geoid (WPG) file. Other geoid formats are not supported. The EGM96 geoid, which covers the entire world, has sufficient accuracy for this purpose.
104 |
GrafNav / GrafNet 8.10 User Guide Rev 4 |