


62 Drug–Receptor Interaction
Enantioselectivity of Drug Action
Many drugs are racemates, including β- blockers, nonsteroidal anti-inflammatory agents, as well as the anticholinergic benzetimide (A). A racemate consists of a molecule and its corresponding mirror image which, like the left and right hands, cannot be superimposed. Such chiral (“handed”) pairs of molecules are referred to as enantiomers. Typically, chirality is due to a single carbon
(C) atom bonded to four different substituents (asymmetric carbon atom). Enantiomerism is a special case of stereoisomerism. Nonchiral stereoisomers are called diastereomers (e.g., quinidine/quinine).
Bond lengths in enantiomers, but not necessarily diastereomers, are the same. Therefore, enantiomers possess similar physicochemical properties (e.g., solubility, melting point) and both forms are usually obtained in equal amounts by chemical synthesis. As a result of enzymatic activity, however, only one of the enantiomers is usually found in nature.
In solution, enantiomers rotate the plane of oscillation of linearly polarized light in opposite directions; hence theyare referred to as “dextro-rotatory” or “levo-rotatory,” designated by the prefixes d- or (+)- and l- or (–)-, respectively. The direction of rotation gives no clue concerning the spatial structure of enantiomers. The absolute configuration, as determined by certain rules, is described by the prefixes (S)- and (R)-. In some compounds, designation as the D- and L-forms is possible by reference to the structure of D- and L-glyceraldehyde.
For drugs to exert biological actions, contact with reaction partners in the body is required. When the reaction favors one of the enantiomers, enantioselectivity is observed.
Enantioselectivity of afnity. If a receptor has sites for three of the substituents (symbolized in B by a cone, sphere, and cube) on the asymmetric carbon to attach to, only one
of the enantiomers will have optimal fit. Its af nity will then be higher. Thus, dexetimide displays an af nity at the muscarinic ACh receptors almost 10 000 times (p.104) that of levetimide;andat β-adrenoceptors(S)-(–)- propranolol has an af nity 100 times that of the (R)-(+) form.
Enantioselectivity of intrinsic activity. The mode of attachment at the receptor also determines whether an effect is elicited; and whether or not a substance has intrinsic activity, i.e., acts as an agonist or antagonist. For instance, (–)-dobutamine is an agonist at β-adrenoceptors, whereas the (+)-enantio- mer is an antagonist.
Inverse enantioselectivity at another receptor. An enantiomer may possess an unfavorable configuration at one receptor that may, however, be optimal for interaction with another receptor. In the case of dobutamine, the (+)-enantiomer has af nity at β- adrenoceptors that is 10 times higher than that of the (–)-enantiomer, both having agonist activity. However, the α-adrenoceptor stimulant action is due to the (–)-form (see above).
As described for receptor interactions, enantioselectivity may also be manifested in drug interactions with enzymes and transport proteins. Enantiomers may display different af nities and reaction velocities.
Conclusion. The enantiomers of a racemate can differ suf ciently in their pharmacodynamic and pharmacokinetic properties to constitute two distinct drugs.
Luellmann, Color Atlas of Pharmacology © 2005 Thieme
All rights reserved. Usage subject to terms and conditions of license.

Enantioselectivity of Drug Action |
63 |
A.Example of an enantiomeric pair with different affinities for a stereoselective receptor
RACEMATE
Benzetimide
ENANTIOMER |
Ratio |
ENANTIOMER |
Dexetimide |
1 : 1 |
Levetimide |
H |
|
H |
O N O |
|
O N O |
N |
CH2 |
CH2 N |
|
Physicochemical properties: |
|
|
Equal |
|
+ 125° |
Defection of polarized light: |
– 125° |
(Dextrorotatory) |
[α ] 20D |
(Levorotatory) |
S = sinister |
Absolute configuration |
R = rectus |
ca. 10 000 |
Potency (rel. affinity at m-ACh-receptors) |
1 |
B. Reasons for different pharmacological properties of enantiomers |
|
|||
C |
|
C |
Enzyme |
Transport protein |
|
|
|
A |
|
|
|
|
f |
|
|
|
|
f |
|
|
|
|
i |
|
|
|
|
ni |
|
|
|
|
t |
|
|
|
|
y |
|
|
|
A f f i n i t y |
|
|
|
|
|
Receptor |
|
|
R e c e p to r |
Enzyme |
|
|
|
|
Transportprotein |
|
|
Pharmacodynamic |
Intrinsic |
Turnover |
Pharmacokinetic |
|
properties |
activity |
rate |
properties |
|
Luellmann, Color Atlas of Pharmacology © 2005 Thieme
All rights reserved. Usage subject to terms and conditions of license.

64 Drug–Receptor Interaction
Receptor Types
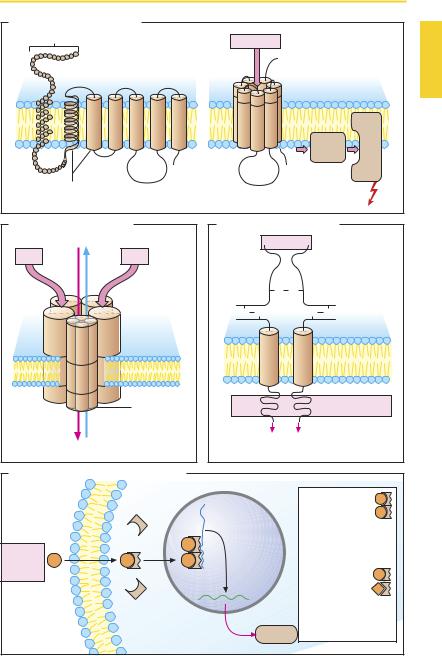
Receptors are macromolecules that operate to bind mediator substances and transduce this binding into an effect, i.e., a change in cell function. Receptors differ in terms of their structure and the manner in which they translate occupancy by a ligand into a cellular response (signal transduction).
G-Protein coupled receptors (A) consist of an amino acid chain that weaves in and out of the membrane in serpentine fashion. The extramembranal loop regions of the molecule may possess sugar residues at different N-glycosylation sites. The seven α- helical membrane-spanning domains probably form a circle around a central pocket that carries the attachment sites for the mediator substance. Binding of the mediator molecule or of a structurally related agonist molecule induces a change in the conformation of the receptor protein, enabling the latter to interact with a G-protein (= guanyl nucleotide-binding protein). G-proteins lie at the inner leaf of the plasmalemma and consist of three subunits designated α, β, and γ. There are various G-proteins that differ mainly with regard to their α-unit. Association with the receptor activates the G-protein, leading in turn to activation of another protein (enzyme, ion channel). A large number of mediator substances act via G-protein-coupled receptors (see p.66 for more details).
An example of a ligand-gated ion channel (B) is the nicotinic cholinoceptor of the motor end plate. The receptor complex consists of five subunits, each of which contains four transmembrane domains. Simultaneous binding of two acetylcholine (ACh) molecules to the two α-subunits results in opening of the ion channel with entry of Na+ (and exit of some K+), membrane depolarization, and triggering of an action potential (p.186). The neuronal N-cholinoceptors apparently consist only of α- and β-subunits. Some of the receptors for the transmitter γ-amino- butyric acid (GABA) belong to this receptor
family: the GABAA subtype is linked to a chloride channel (and also to a benzodiazepine binding site, see p.223). Glutamate and glycine both act via ligand-gated ion channels.
The insulin receptor protein represents a ligand-operated enzyme (C), a catalytic receptor. When insulin binds to the extracellular attachment site, a tyrosine kinase activity is “switched on” at the intracellular portion. Protein phosphorylation leads to altered cell function via the assembly of other signal proteins. Receptors for growth hormones also belong to the catalytic receptor class.
Protein synthesis regulating receptors
(D) for steroids and thyroid hormone are found in the cytosol and in the cell nucleus, respectively. The receptor proteins are located intracellularly; depending on the hormone, either in the cytosol (e.g., glucocorticoids, mineralocorticoids, androgens, and gestagens) or in the cell nucleus (e.g., estrogens, thyroid hormone). Binding of hormone exposes a normally hidden domain of the receptor protein, thereby permitting the latter to bind to a particular DNA nucleotide sequence on a gene and to regulate its transcription. The ligand–receptor complexes thus function as transcription regulating factors. Transcription is usually initiated or enhanced, rarely blocked.
The hormone–receptor complexes interact pairwise with DNA. These pairs (dimers) may consist of two identical hormone–re- ceptor complexes (homodimeric form, e.g., with adrenal or gonadal hormones). The thyroid hormone–receptor complex occurs in heterodimeric form and combines with a cis-retinoic acid-receptor complex.
Luellmann, Color Atlas of Pharmacology © 2005 Thieme
All rights reserved. Usage subject to terms and conditions of license.
|
|
|
|
|
|
|
|
Receptor Types |
65 |
||
A. G-Protein-coupled receptor |
|
|
|
|
|
|
|
|
|||
Amino acids |
|
|
|
|
|
Agonist |
|
|
|
||
|
-NH2 |
|
|
|
|
|
|
H2N |
|
|
|
|
|
|
|
|
|
|
|
|
|
|
|
|
3 |
4 |
5 |
6 |
7 |
3 4 |
5 |
6 7 |
|
protein |
|
|
|
|
G- |
|
|||||||
|
|
|
|
|
|||||||
|
|
|
|
|
|
|
|
|
|
||
|
|
|
|
|
|
|
|
|
Effector |
|
|
|
|
|
|
|
|
|
|
|
Protein |
|
|
|
|
|
|
|
COOH |
|
|
COOH |
|
|
|
|
|
|
|
|
|
|
|
|
|
|
|
α |
-Helices |
|
|
|
|
|
|
|
|
Effect |
|
Transmembrane domains |
|
|
|
|
|
||||||
B. Ligand-gated ion channel |
C. Ligand-regulated enzyme |
||||||
Na+ K+ |
|
|
Insulin |
|
|||
ACh |
|
ACh |
|
|
|
|
|
γ |
|
|
|
S |
S |
|
|
δ |
|
|
|
|
|
||
α |
α |
|
S |
S |
S |
S |
|
|
β |
Nicotinic |
|
|
|
|
|
|
|
|
|
|
|
||
|
|
acetylcholine |
|
|
|
|
|
|
|
receptor |
|
|
|
|
|
|
|
Subunit |
|
|
|
Tyrosine kinase |
|
|
|
consisting of |
|
|
|
|
|
|
|
four trans- |
|
|
|
|
|
Na+ K+ |
membrane |
Phosphorylation of |
|||||
domains |
|||||||
tyrosine residues in proteins |
|||||||
|
|
|
|||||
D. Protein synthesis-regulating receptor |
|
|
|
|
|||
|
|
Cytosol |
|
|
Homodimeric |
||
|
|
|
|
receptors: |
|||
|
|
|
|
|
|||
DNA |
|
glucocorticoids |
|
|
|
mineralocorticoids |
|
|
|
androgens |
|
|
Tran- |
gestagens |
|
Steroid |
scription |
estrogens |
|
Hormone |
|
Heterodimeric |
|
|
|
||
|
mRNA |
receptors with |
|
|
cis-retinoic acid: |
||
|
|
||
Receptor |
|
triiodothyronine |
|
Nucleus |
Trans- |
vitamin D |
|
all-trans-retinoic acid |
|||
|
lation |
||
|
eicosanoids |
||
|
Protein |
Luellmann, Color Atlas of Pharmacology © 2005 Thieme
All rights reserved. Usage subject to terms and conditions of license.

66 Drug–Receptor Interaction
Mode of Operation of G-Protein- coupled Receptors
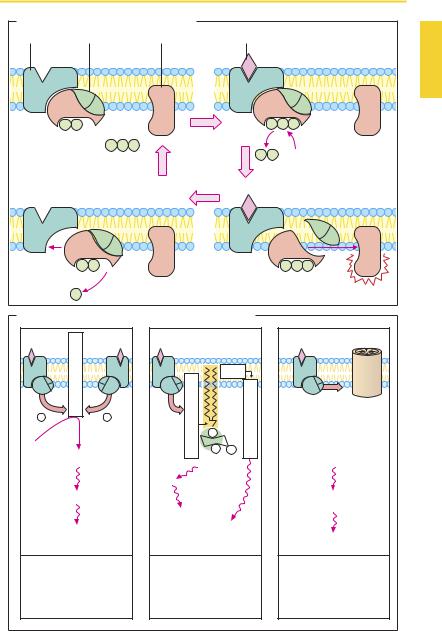
Signal transduction at G-protein coupled receptors uses essentially the same basic mechanism (A). Agonist binding to the receptor leads to a change in receptor protein conformation. This change propagates to the G-protein: the α-subunit exchanges GDP for GTP, then dissociates from the two other subunits, associates with an effector protein and alters its functional state. In principle, the β- and γ-subunits are also able to interact with effector proteins. The α-subunit slowly hydrolyses bound GTP to GDP. Gα-GDP has no af nity for the effector protein and reassociates with the β- and γ-subunits (A). G- proteins can undergo lateral diffusion in the membrane; they are not assigned to individual receptor proteins. However, a relation exists between receptor types and G-protein types (B). Furthermore, the α-subunits of individual G-proteins are distinct in terms of their af nity for different effector proteins, as well as the kind of influence exerted on the effector protein. Gα-GTP of the Gs-pro- tein stimulates adenylate cyclase, while Gα- GTP of the Gi-protein is inhibitory. The G-protein-coupled receptor family includes muscarinic cholinoceptors, adrenoceptors for norepinephrine and epinephrine, as well as receptors for dopamine, histamine, serotonin, glutamate, GABA, morphine, prostaglandins, leukotrienes, and many other mediators and hormones.
Major effector proteins for G-protein- coupled receptors include adenylate cyclase (ATP † intracellular messenger cAMP), phospholipase C (phosphatidylinositol † intracellular messengers inositol trisphosphate and diacylglycerol) as well as ion channel proteins (B). Numerous cell functions are regulated by cellular cAMP concentration, because cAMP enhances activity of protein kinase A, which catalyzes the transfer of phosphate groups onto functional proteins. Elevation of cAMP levels leads inter alia to relaxation of smooth muscle tonus,
enhanced contractility of cardiac muscle, as well as increased glycogenolysis and lipolysis (p.88). Phosphorylation of cardiac calcium channel proteins increases the probability of channel opening during membrane depolarization. It should be noted that cAMP is inactivated by phosphodiesterase. Inhibitors of this enzyme elevate intracellular cAMP concentration and elicit effects resembling those of epinephrine.
The receptor protein itself may undergo phosphorylation, with a resultant loss of its ability to activate the associated G-protein. This is one of the mechanisms that contribute to a decrease in sensitivity of a cell during prolonged receptor stimulation by an agonist (desensitization).
Activation of phospholipase C leads to cleavage of the membrane phospholipid phosphatidylinositol 4,5-bisphosphate into inositol trisphosphate (IP3) and diacylglycerol (DAG). IP3 promotes release of Ca2+ from storage organelles, whereby contraction of smooth muscle cells, breakdown of glycogen, or exocytosis may be initiated. DAG stimulates protein kinase C, which phosphorylates certain serineor threo- nine-containing enzymes.
Certain G-proteins can induce opening of channel proteins. In this way, potassium channelscanbeactivated(e.g.,acetylcholine effect on sinus node, p.104; opioid effect on neural impulse transmission, p.208).
Luellmann, Color Atlas of Pharmacology © 2005 Thieme
All rights reserved. Usage subject to terms and conditions of license.
|
|
|
|
G-Protein-coupled Receptors |
67 |
||||
A. G-Protein-mediated effect of an agonist |
|
|
|
|
|
||||
Receptor |
|
G-Protein |
Effector protein |
Agonist |
|
|
|
|
|
α |
β |
γ |
|
|
α |
β |
γ |
|
|
GDP |
|
|
|
|
|
|
|
|
|
|
|
|
GTP |
|
|
|
|
|
|
α |
|
β |
γ |
|
|
α |
β |
γ |
|
|
|
|
|
|
|
||||
B. G-Proteins, cellular messenger substances, and effects |
|
||||
|
cyclase |
|
DAG |
|
|
|
|
|
|
|
|
Gs + |
- Gi |
|
|
|
Facilitation |
|
Adenylate |
P |
|
ProteinkinaseC |
|
|
|
of ion |
|||
ATP |
PhospholipaseC |
P |
channel |
||
|
cAMP |
P |
|
opening |
|
|
|
|
|
||
|
IP3 |
|
|
|
|
|
|
|
|
|
|
|
|
Ca2+ |
|
|
|
|
Protein kinase A |
|
|
|
Transmembrane |
|
|
Activation |
|
|
ion movements |
|
|
|
|
|
|
Phosphorylation of |
Phosphorylation |
Effect on: |
|||
functional proteins |
of enzymes |
|
|
||
|
|
|
|
|
|
e.g., Relaxation |
e.g., Contraction |
|
|
e.g., Membrane |
|
|
of smooth muscle, |
of smooth muscle, |
action potential, |
||
|
glycogenolysis, |
glandular |
|
|
homeostasis of |
|
lipolysis, Ca-channel |
secretion |
|
|
cellular ions |
|
activation |
|
|
|
|
Luellmann, Color Atlas of Pharmacology © 2005 Thieme
All rights reserved. Usage subject to terms and conditions of license.

68 Drug–Receptor Interaction
Time Course of Plasma Concentration and Effect
After the administration of a drug, its concentration in plasma rises, reaches a peak, and then declines gradually to the starting level, owing to the processes of distribution and elimination (p.46). Plasma concentration at a given point in time depends on the dose administered. Many drugs exhibit a linear relationship between plasma concentration and dose within the therapeutic range (dose-linear kinetics [A]; note different scales on ordinate). However, the same does not apply to drugs whose elimination processes are already suf ciently activated at therapeutic plasma levels so as to preclude further proportional increases in the rate of elimination when the concentration is increased further. Under these conditions, a smaller proportion of the dose administered is eliminated per unit time.
A model example of this behavior is the elimination of ethanol (p.44). Because the metabolizing enzyme, alcohol dehydrogenase, is already saturated at low ethanol concentrations, only the same amount per unit time is broken down despite rising concentrations.
The time courses of the effect and of the concentration in plasma are not identical, because the concentration–effect relationship is complex (e.g., with a threshold phenomenon) and often obeys a hyperbolic function (B; cf. p.54). This means that the time course of the effect exhibits dose dependence also in the presence of dose-linear kinetics (C).
In the lower dose range (example 1), the plasma level passes through a concentration range (0–0.9) in which the change in concentration still correlates quasi-linearly with the change in effect. The time courses of the concentration in plasma and the effect (A and C, leftgraphs) are very similar. However, after a high dose (100), the plasma level will remain in a concentration range (between 90 and 20) where changes in concentration
do not evoke significant changes in effect. Accordingly, the time–effect curve displays a kind of plateau after high doses (100). The effect only begins to wane after the plasma level has fallen to a range (below 20) in which changes in plasma level are reflected in the intensity of the effect.
The dose-dependence of the time course of the drug effect is exploited when the duration of the effect is to be prolonged by administration of a dose in excess of that required for the effect. This is done in the case of penicillin G (p.270), when a dosing interval of 8 hours is recommended although the drug is eliminated with a halflife of 30 minutes. This procedure is, of course, feasible only if supramaximal dosing is not associated with toxic effects.
It follows that a nearly constant effect can be achieved, although the plasma level may fluctuategreatlyduringtheintervalbetween doses.
The hyperbolic relationship between plasma concentration and effect explains why the time course of the effect, unlike that of the plasma concentration, cannot be described in terms of a simple exponential function. A half-life can only be given for the processes of drug absorption and elimination, hence the change in plasma levels, but generally not for the onset or decline of the effect.
Luellmann, Color Atlas of Pharmacology © 2005 Thieme
All rights reserved. Usage subject to terms and conditions of license.
Plasma Concentration and Effect |
69 |
A. Dose-linear kinetics (note different ordinates)
Concentration |
|
10 |
Concentration |
|
100 |
Concentration |
|
|||
1,0 |
|
|
|
|
|
|
|
|
||
0,5 |
|
|
5 |
|
|
|
50 |
|
|
|
t1 2 |
|
|
|
t1 2 |
|
|
|
t1 2 |
|
|
0,1 |
|
|
1 |
|
|
|
10 |
|
|
|
|
|
Time |
|
|
|
Time |
|
|
|
Time |
Dose = 1 |
|
|
|
Dose = 10 |
|
|
|
Dose = 100 |
|
|
B. Concentration–effect relationship |
|
|
|
|
|
|
||||
Effect |
|
|
|
|
|
|
|
|
|
|
100 |
|
|
|
|
|
|
|
|
|
|
50 |
|
|
|
|
|
|
|
|
|
|
0 |
|
|
|
Concentration |
|
|
|
|
||
|
|
|
|
|
|
|
|
|||
1 |
10 |
20 |
30 |
40 |
50 |
60 |
70 |
80 |
90 |
100 |
C. Dose dependence of the time course of effect |
|
|
Effect |
Effect |
Effect |
100 |
100 |
100 |
50 |
50 |
50 |
10 |
10 |
10 |
Time |
Time |
Time |
Dose = 1 |
Dose = 10 |
Dose = 100 |
Luellmann, Color Atlas of Pharmacology © 2005 Thieme
All rights reserved. Usage subject to terms and conditions of license.