


50 Pharmacokinetics
Accumulation: Dose, Dose Interval, and Plasma Level Fluctuation (A)
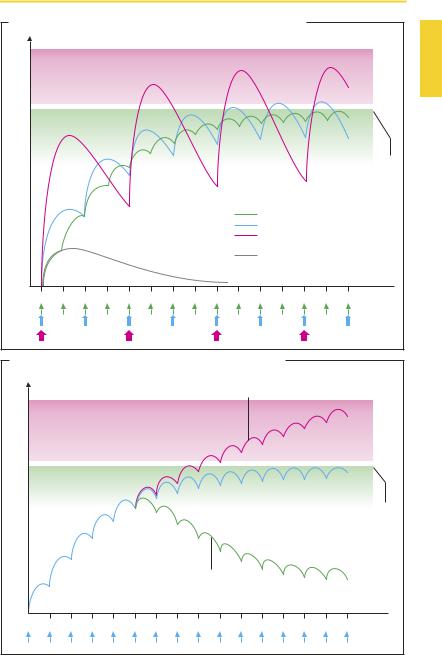
Successful drug therapy in many illnesses is accomplished only if the drug concentration is maintained at a steady high level. This requirement necessitates regular drug intake and a dosage schedule that ensures that the plasma concentration neither falls below the therapeutically effective range nor exceeds the minimal toxic concentration. A constant plasma level would, however, be undesirable if it accelerated a loss of effectiveness (development of tolerance), or if the drug were required to be present at specified times only.
A steady plasma level can be achieved by giving the drug in a constant intravenous infusion, the height of the steady state plasma level being determined by the infusion rate. This procedure is routinely used in hospital settings, but is generally impracticable. With oral administration, dividing the total daily dosage into several individual doses, e.g., four, three, or two, offers a practical compromise. When the daily dose is given in several divided doses, the mean plasma level shows little fluctuation.
In practice, it is found that a regimen of frequent regular drug ingestion is not well adhered to by patients (unreliability or lack of “compliance” by patients). The degree of fluctuation in plasma level over a given dosing interval can be reduced by a dosage form permitting slow (sustained) release (p.12).
The time required to reach steady-state accumulation during multiple constant dosing depends on the rate of elimination. As a rule of thumb, a plateau is reached after approximately three elimination half-lives (t½).
For slowly eliminated drugs, which tend to accumulate extensively (phenprocoumon, digitoxin, methadone), the optimal plasma level is attained only after a long period. Here, increasing the initial doses (loading dose) will speed up the attainment of equilibrium, which is subsequently maintained
with a lower dose (maintenance dose). For slowly eliminated substances, single daily dosing may suf ceto maintaina steady plasma level.
Change in Elimination Characteristics during Drug Therapy (B)
With any drug taken regularly and accumulating to the desired plasma level, it is important to consider that conditions for biotransformation and excretion do not necessarily remain constant. Elimination may be hastened due to enzyme induction (p.38) or to a change in urinary pH (p.40). Consequently, the steady-state plasma level declines to a new value corresponding to the new rate of elimination. The drug effect may diminish or disappear. Conversely, when elimination is impaired (e.g., in progressive renal insuf ciency), the mean plasma level of renally eliminated drugs rises and may enter a toxic concentration range.
Luellmann, Color Atlas of Pharmacology © 2005 Thieme
All rights reserved. Usage subject to terms and conditions of license.
Accumulation 51
A. Accumulation: dose, dose interval, and fluctuation of plasma level
concentration in blood |
|
|
|
|
|
|
|
|
|
|
|
|
|
|
plasma level |
Drug |
|
|
|
|
|
|
|
|
|
4 x daily |
|
50 mg |
|
Desired |
|
|
|
|
|
|
|
|
|
|
2 x daily |
|
100 mg |
|
|||
|
|
|
|
|
|
|
|
|
1 x daily |
|
200 mg |
|
|||
|
|
|
|
|
|
|
|
|
|
Single |
|
50 mg |
|
|
|
|
6 |
12 |
18 |
24 |
6 |
12 |
18 |
24 |
6 |
12 |
18 |
24 |
6 |
12 |
h |
B. Changes in elimination kinetics in the course of drug therapy |
|
|
|
|
|||||||||||
|
|
|
|
|
Inhibition of elimination |
|
|
|
|
|
|
||||
in blood |
|
|
|
|
|
|
|
|
|
|
|
|
|
|
|
Drug concentration |
|
|
|
|
|
Acceleration |
|
|
|
|
|
|
Desired plasma level |
||
|
|
|
|
|
of elimination |
|
|
|
|
|
|
||||
|
|
|
|
|
|
|
|
|
|
|
|
|
|||
6 |
12 |
18 |
24 |
6 |
12 |
18 |
24 |
6 |
12 |
18 |
24 |
6 |
12 |
18 |
h |
Luellmann, Color Atlas of Pharmacology © 2005 Thieme
All rights reserved. Usage subject to terms and conditions of license.

52 Quantification of Drug Action
Dose–Response Relationship
The effect of a substance depends on the amount administered, i.e., the dose. If the dose chosen is below the critical threshold (subliminal dosing), an effect will be absent. Depending on the nature of the effect to be measured, increasing doses may cause the effect to increase in intensity. Thus, the effect of an antipyretic or hypotensive drug can be quantified in a graded fashion, in that the extent of fall in body temperature or blood pressure is being measured. A dose–effect relationship is then encountered, as discussed on p.54.
The dose–effect relationship may vary depending on the sensitivity of the individual person receiving the drug: i.e., for the same effect, different doses may be required in different individuals. The interindividual variation in sensitivity is especially obvious with effects of the “all-or-none” kind.
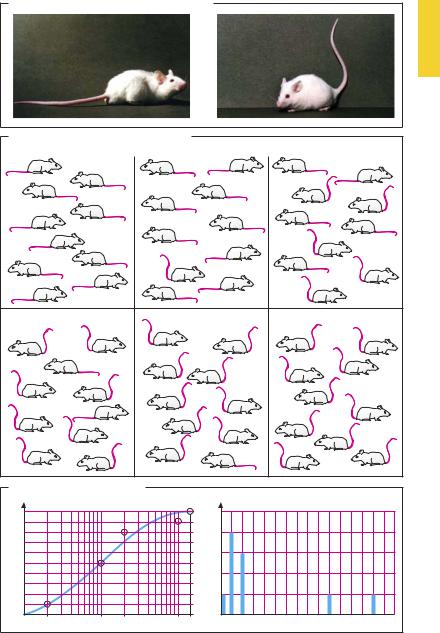
To illustrate this point, we consider an experiment in which the subjects individually respond in all-or-none fashion, as in the Straub tail phenomenon (A). Mice react to morphine with excitation, evident in the form of an abnormal posture of the tail and limbs. The dose dependence of this phenomenon is observed in groups of animals (e.g., 10 mice per group) injected with increasing doses of morphine. At the low dose only the most sensitive, at increasing doses a growing proportion, and at the highest dose all of the animals are affected (B). There is a relationship between the frequency of responding animals and the dose given. At 2 mg/kg, 1 out of 10 animals reacts; at 10 mg/kg, 5 out of 10 respond. The dose–frequency relationship results from the different sensitivity of individuals, which, as a rule, exhibits a log-normal distribution (C, graph at right, linear scale). If the cumulative frequency (total number of animals responding at a given dose) is plotted against the logarithm of the dose (abscissa), a sigmoidal curve results (C, graph at left, semi-logarithmic scale). The inflection point of the curve lies at the dose
at which one half of the group has responded. The dose range encompassing the dose–frequency relationship reflects the variation in individual sensitivity to the drug. Although similar in shape, a dose–frequency relationship has, thus, a meaning different from that of a dose–effect relationship. The latter can be evaluated in one individual and results from an intraindividual dependency of the effect on drug concentration.
The evaluation of a dose–effect-relation- ship within a group of human subjects is made more dif cult by interindividual differences in sensitivity. To account for the biological variation, measurements have to be carried out on a representative sample and the results averaged. Thus, recommended therapeutic doses will be appropriate for the majority of patients, but not necessarily for each individual.
The variation in sensitivity may be based on pharmacokinetic differences (same dose
† different plasma levels) or on differences in target organ sensitivity (same plasma level † different effects).
To enhance therapeutic safety, clinical pharmacology has led efforts to discover the causes responsible for interindividual drug responsiveness in patients. This field of research is called pharmacogenetics. Often the underlying reason is a difference in enzyme property or activity. Ethnic variations are additionally observed. Prudent physicians will attempt to determine the metabolic status of a patient before prescribing a particular drug.
Luellmann, Color Atlas of Pharmacology © 2005 Thieme
All rights reserved. Usage subject to terms and conditions of license.
Dose–Response Relationship |
53 |
A. Abnormal posture in mouse given morphine
B. Incidence of effect as a function of dose |
|
|
Dose = 0 |
= 2 mg/kg |
= 10 mg/kg |
= 20 mg/kg |
= 100 mg/kg |
= 140 mg/kg |
C. DoseÐfrequency relationship |
|
|
|
|
|
|
|||
% |
|
Cumulative frequency |
|
|
|
Frequency of dose needed |
|
||
100 |
|
|
|
|
|
|
|
|
|
80 |
|
|
|
|
|
4 |
|
|
|
60 |
|
|
|
|
|
3 |
|
|
|
40 |
|
|
|
|
|
2 |
|
|
|
20 |
|
|
|
|
|
1 |
|
|
|
mg/kg |
2 |
10 |
20 |
100 |
140 |
2 10 20 |
100 |
140 |
mg/kg |
Luellmann, Color Atlas of Pharmacology © 2005 Thieme
All rights reserved. Usage subject to terms and conditions of license.