

|
|
|
|
|
188 |
|
CONFIRMATION AND OVERCONFIDENCE |
grapple with conflicting information and choices between information sources. Our choice
affects the accuracy of our perceptions and the success of our decisions.
Rational Information Search
For the first-time student, models of information search can be difficult to understand. This is because information search involves two levels of uncertainty. The first level of uncertainty is regarding the economic phenomenon that the individual wants to learn about (e.g., future stock market prices). The second level of uncertainty is regarding what signal the resulting information will yield (e.g., whether the signal will indicate rising or falling prices, and whether this signal will accurately reflect future events). Information signals are most often modeled as random variables that have distributions that are conditional on the underlying uncertainty.
For a simple example, consider a farmer who is making a production decision. She must decide, before she knows what weather will come, how much seed to plant, x. If the weather is good, then planting x will result in αgx bushels of wheat being harvested. If the weather is bad, then planting x will result in αbx bushels of wheat, where αg > αb > 0. The cost of purchasing and planting seed is given by the cost function C x
x , and the resulting wheat can be sold for price p. Suppose the farmer initially believes (accurately) that there is a Pg probability of good weather. Then, without any further information, a risk-neutral farmer would solve
max Pgpαgx + 1 − Pg pαbx − C x . |
8 1 |
x |
|
We write the solution to this problem as x* Pg
Pg .
.
Now, suppose that two different weather forecasts are available that can further inform the farmer of the future weather. Each forecast predicts either GOOD or BAD weather. Let y represent the choice of weather forecast. When forecast y predicts GOOD, good weather results with probability P good
good GOOD, y
 . Similarly, we can write the probability that bad weather will occur when forecast y predicts BAD as P
 bad
bad BAD, y
 . Here let us suppose that both of these probabilities are a result of Bayesian updating. Suppose further that the farmer is aware of these conditional probabilities and is only allowed to choose one forecast. The farmer will be able to observe the forecast before making the input decision. Thus, the input decision is based upon the forecast she receives. Given that forecast y predicts STATE, where STATE can be either GOOD or BAD, the farmer will solve
max P state STATE, y pαgx + 1 − P state STATE, y pαbx − C x . |
8 2 |
x |
|
In general, we will write the solution to (8.2) as x* STATE, y
 .
.
Further, we can determine the probability of receiving a GOOD forecast versus a BAD forecast given the chosen forecast. Let P STATE, y
 be the unconditional probability of receiving a forecast of STATE given the chosen forecast. Then, to be consistent, it must be that
|
|
|
|
|
Rational Information Search |
|
189 |
|
|
P GOOD, y = PgP good GOOD, y + 1 − Pg P bad GOOD, y |
8 3 |
|
|
|
and |
|
|
|
|
P BAD, y = PgP good BAD, y + 1 − Pg P bad BAD, y . |
8 4 |
|
|
|
These equations must hold given that the unconditional probability of good weather is Pg. Table 8.1 summarizes the possible outcomes given forecast y and the resulting probabilities.
Let us suppose that Pg = 0.7. Suppose that of the two possible forecasts, one predicted the weather with absolute certainty, and the other tended to confirm the initial belief that good weather was on the way. Suppose that forecast y = 1 is perfectly accurate. Thus, P good
good GOOD, 1
 = 1 and P
 bad
bad BAD, 1
 = 1, so that after receiving the signal, the farmer had a perfect knowledge of what weather would come. Further, suppose that forecast y = 2 is such that P
 good
good GOOD, 1
 = 0.7 and P
 bad
bad BAD, 1
 = 0.3, so that no matter what the signal, the farmer continued to believe that there was a 0.70 probability of good weather. By choosing the second signal, the farmer receives no new information no matter what signal is realized. In this case, x*
 GOOD, 2
 = x*
= x* BAD, 2
 = x*
= x* Pg
Pg . Because the farmer chooses the same input no matter what the forecast, the farmer will receive the same profits when receiving forecast 2 as when no signal is received, as in equation 8.1. Thus, signal 2 is worth nothing to the farmer, and she will not be willing to pay anything for this forecast. Alternatively, with signal 1, the farmer can perfectly discern what weather will come and can choose the input level that maximizes the profit in each state. Thus, it is as if the farmer is solving
Pg max pαgxg − C x |
+ 1 − Pg |
max pαbxb − C x , |
8 5 |
xg |
|
xg |
|
where xg is the planned input when in a good-weather state and xb is the planned input when in a bad-weather state. In this case, the farmer can make input dependent on state and obtain the greatest possible profit in each state. Clearly the realized profit of equation 8.5 is larger than the realized profit in equation 8.1, where the farmer must choose one level of input for both possible states. Thus, this signal must be valuable to the farmer and be worth paying the difference in expected profits with and without the forecast.
In general, information increases in value as it increases in resolution or accuracy. In other words, if the probability of all possible states of the world near either 1 or 0
Table 8.1 Probabilities States and Forecasts
|
Weather |
Unconditional Probability |
|
Forecast |
Good |
Bad |
|
GOOD |
P good GOOD, y |
P bad GOOD, y |
P GOOD, y |
BAD |
P good BAD, y |
P bad BAD, y |
P BAD, y |
Unconditional Probability |
Pg |
1 − Pg |
|
|
|
|
|

|
|
|
|
|
190 |
|
CONFIRMATION AND OVERCONFIDENCE |
increases once a forecast signal is received, the signal will have high value. The more extreme the probability of various states, the greater the person’s ability to plan and avoid the reduced average profits that come with uncertainty. If a forecast signal almost always results in beliefs that are similar to the currently held beliefs, we call it a confirming forecast. A confirming forecast has little value for planning purposes. Because it does not change beliefs, it cannot change the planned choice. Thus, in this sense, con- firming information has no value.
Alternatively, we could think of information as confirming if it strengthens your current belief in a particular state, for example, a forecast that can lead to belief that the probability of good weather is greater than the initial belief of 0.7. This signal has value in that it leads to a better ability to discern between the possible states of the world and thus allows better decisions. However, such a forecast also necessarily allows you to more accurately predict a bad state. In other words, if P good
good GOOD, y
 > Pg, then P
 bad
bad BAD, y
 >
>  1 − Pg
 . Thus, this information can potentially disconfirm current beliefs also. A rational economic agent always weakly prefers a more accurate set of beliefs whether the more-accurate beliefs resemble their current beliefs or not.
EXAMPLE 8.1 On the Objectivity of Grades
Many students have had the experience of receiving a grade they feel is unfair. One often hears the claim from students who have been unpleasantly surprised by their grades that the teacher or professor is biased in some way against the student.
Here is some ammunition that may be helpful the next time you face such a dispute. John Darley and Paget Gross conducted a series of experiments where subjects watched a video tape of a fourth grade girl and were asked to assess her academic capability. A control group viewed only a tape of the girl answering questions from an achievement test. On average this group believed that she performed very near grade level in reading and liberal arts but just slightly below grade level in math. An additional group was shown a video of the girl playing and was not allowed to view the answers to the achievement test. Half of the participants in this group were shown the girl playing in an upper-class suburban neighborhood, and half of the participants viewed the girl in a lowincome urban setting. Those viewing the girl in the upper-class neighborhood rated her as being somewhat above grade level in reading and in arts and sciences and on grade level in math. Those viewing her in the urban setting rated her as being slightly below grade level in all three. Of course neither of these groups had any chance to really observe her ability in any of the subjects, and thus these ratings might simply represent their prior beliefs.
A third group was first shown the video of the girl playing and then her answers to the achievement test, and the group was asked to rate her performance. In this case, the viewers had the chance to form initial beliefs about the girl while watching her play, and then they used the test answers to update their beliefs. In this case, those watching her play in the upper-class neighborhood rated her well above grade level in reading and in arts and sciences and somewhat above grade level in math. Those who initially viewed her playing in a low-income neighborhood rated her well below grade level in all three.
|
|
|
|
Rational Information Search |
|
191 |
|
Thus, no matter what their initial beliefs were regarding the girl’s ability, all participants saw her performance on the achievement test as reinforcing their original view. If they initially believed she was above grade level, their views after seeing the test was that she was well above grade level. If they initially believed she was below grade level, after seeing the test they thought she was well below grade level. This is after seeing the exact same video of her performance on the test. Apparently, evidence is in the eye of the beholder.
EXAMPLE 8.2 Flipping Cards and the Contrapositive
Causal links between events can be very difficult to establish in practice. Often a decision maker is searching for information that will help to establish a decision-rule. For example, we might hypothesize that expected stock prices decline on days when it rains in New York City. One way to test such a hypothesis is to examine stock price data on the days when it rained in New York City and to test whether the average change in price on these days was negative. Alternatively, we could obtain weather data for only days when stock prices increased, and test if the average rainfall was greater than 0. This might seem like a less-obvious route to testing the hypothesis, but it is just as powerful. Obtaining data concerning the change in stock prices on sunny days, however, cannot be used to test or support this hypothesis. In fact the original hypothesis said nothing regarding sunny days. It could be that prices rise on average both on sunny and rainy days (for example if weather has nothing to do with stock returns). Nonetheless, if I were to state that stock prices increase on average on sunny days, many might increase their confidence in the original hypothesis regarding rainy days, believing that this somehow makes it more likely that prices decline on rainy days. This mistake is relatively common when dealing with contrapositive statements. Statements of the form “if P then Q” and “if not P then not Q” are contrapositive statements, and people often make the mistake of looking for evidence to support the contrapositive as a means of confirming their original hypothesis.
P. C. Wason conducted several experiments to examine how such confusion can influence the search for information. Participants in one experiment were shown four cards placed in random order. They were told that each card had a number on one side and a letter on the reverse side. For example, in one treatment they were shown four cards with the faces showing respectively “D”, “3”, “B”, “7,” as displayed in Figure 8.1. Then participants were asked which of the cards they would need to flip over to test the hypothesis that “If there is a D on one side of any card, then there is a 3 on its other side.” Clearly in order to test this hypothesis one would need to flip the “D” card, as every participant could identify. However, one would also need to flip over the “7.” If the letter on the opposite side of the “7” were “D,” then the hypothesis would be false. The need
D |
|
3 |
|
B |
|
7 |
|
|
|
|
|
|
|
FIGURE 8.1
Visible Cards in the Wason Experiment

|
|
|
|
|
192 |
|
CONFIRMATION AND OVERCONFIDENCE |
to flip over “7” was identified by only 20 percent of participants. Alternatively, 74 percent of participants thought it would be necessary to flip over the “3” to test the hypothesis. This is, of course, false. If we were to flip over the “3” and find a “K” written on the other side, we succeed only in finding that the rule could not be applied for the card because the rule only states what will appear opposite a “D.” Alternatively, if we find a “D” on the other side of the “3,” this does not confirm or rule out the hypothesis. Thus, no new information could possibly be obtained by flipping over the “3.”
Later studies by Wason and others have shown similar biases by scientists and students attempting to apply scientific principles. When one has a working hypothesis, the tendency is to run tests that display the hypothesized relationship but that have no ability to reject the hypothesis (e.g., flipping over the “3” card). We refer to such information as confirmatory, because it can display the hypothesized relationship, providing some confirmation, although it has no power to reject the relationship. Alternatively, we refer to information such as flipping over the “7” as disconfirmatory. Disconfirmatory evidence cannot potentially display the hypothesized relationship (by flipping the “7” we will never see a card with a “3” on one side and a “D” on the other) but can reject the hypothesis. Clifford Mynatt, Michael Doherty, and Ryan Tweney found that whether participants in experiments are instructed to find confirming evidence or to find disconfirming evidence, they tend to choose confirming evidence about 70 percent of the time. Thus, decision makers, even after having some instruction on the differences between confirming and disconfirming information, have a difficult time discerning between the two. Further, decision makers have an apparent tendency to seek confirmatory information rather than disconfirmatory information.
Confirmation Bias
People have a strong tendency to seek information that is likely to confirm their currently held beliefs rather than information that might cause them to reconsider. Further, people have a tendency to interpret new information as supporting their currently held beliefs. This pair of tendencies is called confirmation bias. By seeking information that can only confirm currently held beliefs, new information cannot change one’s mind; thus, the person flips over the “3” instead of the “7,” looking for confirming information. Further, people tend to discount, question, and scrutinize information that contradicts their own currently held beliefs, whereas information that is consistent with their current beliefs is generally taken at face value, thus strengthening currently held beliefs. Thus, one is much more likely to see vague information as confirming a currently held belief than disconfirming it. Given a random stream of information, one who displays a confir- mation bias thus interprets the information as largely supporting one’s already-held beliefs. As an illustration of this principle, Thaler, when originally introducing the field of behavioral economics in his series of articles in the Journal of Economic Perspectives, suggested that behavioral economics is largely designed to combat confirmation bias among economists. The overwhelming majority of economic studies look for evidence that can possibly confirm classical economic models, whereas behavioral studies look for evidence that classical models could fail.
|
|
|
|
Confirmation Bias |
|
193 |
|
We refer to seeking after confirmatory information or selectively scrutinizing disconfirming information as hypothesis-based filtering. Matthew Rabin and Joel Schrag point out that although it is reasonable and rational to use current hypotheses to inform one’s search and interpretation of information, it is unreasonable to then use this interpretation or resulting information as further evidence for the hypothesis. The example they use to drive home this result is of a teacher grading a test. When the teacher comes upon a vague or odd answer, she might use her knowledge of the student to interpret the meaning of the answer and decide on the student’s mastery of the subject and thus assign the grade on the question. This is all quite reasonable. However, once the answer is graded based on the working understanding the teacher has of how well the student understands the material, it is thereafter invalid to use the resulting grade as further proof of how well the student understands the material. The grade at that point contains no information beyond the initial hypothesis used to filter the information contained in the student’s test response.
Two other conditions commonly lead to confirmation bias. First, when information is ambiguous and requires interpretation, people often interpret the information according to their initially held beliefs, engaging in hypothesis-based filtering. This leads to a case where vague information is almost always viewed as confirming and strengthening the currently held belief. Thus, for example, an essay is likely to be graded in a way that displays a confirmation bias resulting from the level of judgment necessary in completing this task, whereas a multiple-choice question is not. Second, people have a difficult time detecting the correlation of random events. Thus, when their beliefs center around the correlation between some event that is potentially causal and the event that it potentially causes, people tend to see confirmation where none exists. For example, without employing rigorous statistical analysis, sports fans might watch several basketball games and feel they have seen confirmation of the hot hand if they initially believed in the phenomenon. Believing that shots are positively correlated often leads one to view a string of shots taken as being correlated, even if no correlation exists.
Rabin and Schrag propose a model of confirmation bias based on the possibility of two states of the world. Consider again our farmer who wishes to know whether there will be good weather or bad weather for the season. Suppose that each week before the planting season, the farmer receives a different forecast of the weather, predicting either GOOD or BAD. Each of these forecasts is considered independent from each of the other forecasts, with the probability of a GOOD forecast given good weather indicated by P GOOD
GOOD good
good > 0.5 and the probability of a BAD forecast given bad weather indicated by P
 BAD
BAD bad
bad > 0.5. Initially, suppose that the farmer believes there is a 0.5 probability of good weather. Suppose now that the forecast is communicated in some way that is ambiguous, leading to confirmation bias. Then, over the course of the preplanting season, the farmer receives a series of forecasts (e.g., GOOD, GOOD, BAD, . . . ), but the farmer perceives a potentially different series of forecasts. Let a perceived forecast of GOOD be denoted by GOOD and a perceived forecast of BAD be denoted by BAD. At any point in time, if the farmer believes that either good or bad weather is more probable, then she has a probability of q > 0 of misperceiving disconfirming information while correctly perceiving confirming information with probability 1. The farmer then updates her beliefs according to Bayes rule, as if her

|
|
|
|
|
194 |
|
CONFIRMATION AND OVERCONFIDENCE |
perception were reality. Thus, if she perceives the signals GOOD, GOOD, BAD, her perceived beliefs could then be written as
P good
good GOOD, GOOD, BAD
= |
|
0.5× P GOOD good 2 |
1−P GOOD good |
|
. |
|
× P GOOD good 2 1−P GOOD good |
+0.5× 1−P BAD bad 2 |
|
||
0.5 |
P BAD bad |
||||
 8
8 6
6
Here, the 0.5 in the numerator is the Bayesian prior belief that good weather will prevail, which is multiplied by the probability of a GOOD forecast given that good weather is actually on the way raised to the power of the number of good forecasts received (in this case 2), multiplied by the probability of a BAD forecast given that good weather is on the way raised again to the power equaling the number of bad forecasts (in this case 1). The denominator contains the term from the numerator, plus a similar term using the probabilities given that bad weather is on the way. Note that the perceived beliefs are independent of the order of the perceived forecasts. Thus, if the farmer had perceived the sequence BAD, GOOD, GOOD, she would have maintained the same beliefs. This should be the case if the perceived forecasts were independent of one another, as the true forecasts are. However, the order of perception actually does affect the true probability of the events in this case because the perceived signals depend on one another.
The prior belief was that there was a 0.5 probability of good weather. If one first perceives the signal GOOD, one’s initial beliefs do not favor either good or bad weather, so this perception must be accurate. However, once one perceives the first GOOD, one’s beliefs become
P good GOOD |
|
|
|
|
||
= |
|
|
0.5 × P GOOD good |
1 1 − P GOOD good 0 |
|
|
|
× P GOOD good 1 1 − P GOOD good |
0 + 0.5 × 1 − P BAD bad 1 |
P BAD bad 0 |
|||
0.5 |
||||||
= |
|
P GOOD good |
> 0.5. |
|
|
|
|
|
|
|
|
||
|
|
+ 1 − P BAD bad |
|
|
||
P GOOD good |
|
|
|
|||
|
|
|
|
|
|
8 7 |
Here |
the last |
inequality follows because P GOOD good > 0.5 |
and P BAD |
|||
bad > 0.5. At this point, if the next signal is GOOD, it will be accurately perceived as GOOD. However, if the next signal is BAD, there is a probability of q that GOOD will be perceived. Thus, the second perceived GOOD should not move beliefs as much given the possibility that this was a misperceived signal. In this case, the probability of perceiving the second GOOD is
P GOOD GOOD, good = P GOOD good + q 1 − P GOOD good , |
8 8 |
given that the weather will truly be good, and
|
|
|
|
Confirmation Bias |
|
195 |
|
P GOOD GOOD, bad = qP BAD bad + 1 − P BAD bad . |
8 9 |
In fact, this is the true probability of perceiving GOOD in any period in which the farmer believes that good weather is more probable. Thus, a true Bayesian who understands her tendency to misperceive signals would believe (compare to equation 8.6)
P good
good GOOD, GOOD, BAD
=  0.5 × P
 GOOD
GOOD good
good P
P GOOD
GOOD GOOD, good
 1 − P
1 − P GOOD
GOOD GOOD, good

 0.5 × P GOOD good P GOOD GOOD, good 1 − P GOOD GOOD, good
÷ |
. |
+ 0.5 × 1 − P BAD bad P GOOD GOOD, bad |
1 − P GOOD GOOD, bad |
|
8 10 |
As an example, suppose that P GOOD
GOOD good
good = 0.75 and P
 BAD
BAD bad
bad = 0.6, and q = 0.5. Then, the perceived probability of the sequence GOOD, GOOD, BAD is
P good GOOD, GOOD, BAD = |
|
|
0.5 |
× 0.75 2 × 1 − 0.75 |
|
× 0.75 |
2 × |
1 − 0.75 + 0.5 × 1 − 0.6 2 × 0.6 |
|
0.5 |
||||
0.59. |
|
|
||
|
|
|
|
8 11 |
However, the true probability that good weather is on the way is
P good
good GOOD, GOOD, BAD
= 0.5 × 0.75 ×
  0.75 + 0.5 ×
  1 − 0.75
 ×
×  1 − 0.75 − 0.5 ×
  1 − 0.75

÷0.5 × 0.75 ×  0.75 + 0.5 ×
  1 − 0.75
 ×
×  1 − 0.75 − 0.5 ×
  1 − 0.75
+0.5 ×  1 − 0.6
 ×
×  0.5 × 0.6 +
  1 − 0.6
 ×
×  1 − 0.5 × 0.6 −
  1 − 0.6
 0.49.
0.49.
 8
8 12
12
Thus, the farmer would objectively hold the wrong beliefs, believing that good weather is more likely, when in fact bad weather was more likely. In general, the perceived probability of the state that the farmer perceives to be more likely is greater than the objective probability of that state. This will continue to be true no matter how many forecasts are received.
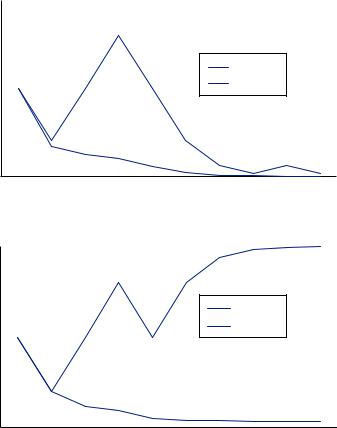
Figure 8.2 displays results from two runs of a simulation of the Rabin–Schrag model of hypothesis filtering. For both runs, the prior belief that good weather would prevail was set so P good
good = 0.5. The probability of receiving a signal of good weather given good weather was the true state was P
 GOOD
GOOD good
good = 0.8. The probability of receiving a signal of bad weather given bad weather was the true state was P
 BAD
BAD bad
bad = 0.8. Finally, the probability of misperceiving a signal if the signal was disconfirming was q = 0.25. A random-number generator was used to generate the weather and the weather

|
|
|
|
Confirmation Bias |
|
197 |
|
remaining flat while the Bayesian beliefs increase to 0.8. The next BAD signal locks in the belief that weather will be bad and leads to a point where additional GOOD signals will not noticeably sway perceptions.
When a person predicts that a state is the most probable and assesses the probability of that state as higher than objective measures of that probability would warrant, we call the person overconfident. Most studies of confirmation bias suggest that overconfidence is a natural result of hypothesis-based filtering.
Given confirmation bias, people fail to learn as much from new information as they really should. This is very closely related to the phenomenon of conservatism outlined in Chapter 7. Thus, the phenomenon of confirmation bias can be seen in some respects as an opposing force to representativeness.
EXAMPLE 8.3 Business Executives and Mergers
Firms often acquire or merge with other firms in the hope of reducing costs. If firms perform overlapping functions, the merged firm could ostensibly cut expenses on capital and labor in one of the redundant operations and perform the same function for both previous ventures at a lower cost, obtaining higher profits. Thus, if you were a business executive considering the acquisition of another firm, significant effort would be made to assess the cost of acquisition, the potential for cutting costs after merging, and the potential net benefit of the merger. If firms make these assessments in a reasonable way, it seems likely that mergers would on average increase firm profits.
In fact, the opposite is true. Fewer than half of all mergers add value to the acquiring company, and only 30 percent of mergers result in a profit increase that meets the stated objective of the merger. Regarding this poor rate of success, Ulrike Malmendier and Geoffrey Tate suggest that CEOs who engage in mergers overestimate their own ability to generate returns from the acquired company. Further, they link this to general overconfidence in the success of their own company. CEOs are often given stock options, the option to buy company stock at a fixed price any time before the expiration date of the option. In general, if the current price of the stock is above the price specified in the option, we say that the option is “in the money.” The CEO at this point could exercise the in-the-money options by buying the stock at the specified price and then could sell the stock for the much higher market price. In general, when one holds in-the-money options, one only continues to hold the options if one believes the stock price will go much higher. Holding, rather than exercising, in-the-money options is a high-risk bet that the company will increase in value. Malmendier and Tate use the holding of in-the- money options as a measure of how overconfident a CEO is regarding the future of their company. They find that those who are more overconfident are also substantially more likely to engage in merger behavior. Thus, it appears that overconfidence about the future of the merger explains some merger activity.
Vicki Bogan and David Just show that such overconfidence might develop as a result of confirmation bias when firms are gathering information about a potential merger. They ran an economics experiment in which participants were placed in the position of a CEO at a firm considering the acquisition of another firm. The participants used a Web browser to access Web pages containing information about the potential costs, benefits, legal issues, and marketing issues regarding the merger. The computer recorded the

|
|
|
|
Confirmation Bias |
|
199 |
|
questionnaire identifying themselves as either in favor of capital punishment (the death penalty) or against capital punishment. A few weeks later, 48 of the participants were called back and asked to participate in an exercise. Of the 48, half indicated that they believed capital punishment was an effective deterrent against crime and that they believed the research supported their position. The other half believed that capital punishment was an ineffective deterrent and that the research supported their position. The participants were asked to read two index cards that contained a short summary of a research paper. For example
Kroner and Phillips (1977) compared murder rates for the year before and the year after adoption of the capital punishment in 14 states. In 11 of the 14 states, murder rates were lower after adoption of the death penalty. This research supports the deterrent effect of the death penalty.
or,
Palmer and Crandall (1977) compared murder rates in 10 pairs of neighboring states with different capital punishment laws. In 8 of the 10 pairs, murder rates were higher in the state with capital punishment. This research opposes the deterrent effect of the death penalty.
After reading these short summaries, participants were then allowed to read some critiques of the particular study, then asked to rate how convincing the research result was. Proponents of capital punishment saw the pro-deterrence research as much more convincing than the anti-deterrence research. As well, opponents of capital punishment saw the anti-deterrence research as much more convincing. After viewing the same information, proponents of capital punishment reported they were more in favor of capital punishment, and opponents considered themselves more against capital punishment. Perhaps more information once a political view is formed only serves to polarize viewpoints via confirmation bias.
EXAMPLE 8.5 Harvard Students are Overconfident
Recall that an x percent confidence interval for an unknown parameter is an interval based on a sample of data such that if we could repeat the experiment that caused the sample of data an infinite number of times, x percent of the resulting intervals would contain the unknown parameter value. One intuitive way to think about it is that there is an x 2 probability that the parameter is above the upper bound of the confidence interval and an x
 2 probability that the parameter falls below the lower bound of the interval. If we have very little information upon which to base our decision about the endpoints, the confidence interval should be very wide. Alternatively, if we have a lot of information about the parameter value, our interval should be very narrow. Instead of producing a confidence interval based on statistical data, it should be possible to ask people to create

|
|
|
|
|
200 |
|
CONFIRMATION AND OVERCONFIDENCE |
confidence intervals intuitively based on their own understanding of the world. If the respondents are well calibrated, then it seems reasonable that they would be able to arrive at two values such that, for example, the number of foreign automobiles imported into the United States last year exceeds the upper value with probability 0.01 and is smaller than the lower value with probability 0.01. If we could then run this same experiment on various pieces of trivia, we could measure whether respondents were correctly calibrated. After asking hundreds of questions, if we knew the true values, we could determine the percentage that exceed or fall below the respondent’s interval estimates.
This is the experiment first performed by Marc Alpert and Howard Raiffa on more than 1,000 Harvard University students in the late 1960s. The original set of students were asked to form 50 percent and 98 percent confidence intervals (thus the values such that the true value will fall below them with probability 0.01, 0.25, 0.75, and 0.99), as well as determine the value such that the probability of a higher value is 0.50 and the probability of a lower value is 0.50. They were to determine these intervals for 10 unknown values. Several examples are
“1. The percentage of first-year students responding, excluding those who never drink, who prefer bourbon to scotch.”
“4. The percentage of respondents expressing an opinion to a July, 1968 Gallup Poll surveying a representative sample of adult Americans who felt that if a full-scale war were to start in the Middle East, the U.S. should send troops to help Israel.”
“6. The number of “Physicians and Surgeons” listed in the 1968 Yellow Pages of the phone directory for Boston and vicinity.”
“8. The total egg production in millions in the U.S. in 1965.”
“9. The number of foreign automobiles imported into the U.S. in 1967 in thousands.”
The initial set of 800 M.B.A. students responded with values for each of these and the remaining questions. Table 8.2 compares the true value to the confidence interval responses for the Harvard students. By way of example, consider the first question, which asks students about the percentage of other students who prefer bourbon to scotch. In reality, 42.5 percent of students prefer bourbon. None of the students knew that for certain, though they probably had some idea of what others drink at parties or other social gatherings. If asked for a number such that there was only a 0.01 probability that a smaller percentage preferred bourbon, one might start by guessing at the true
Table 8.2 Accuracy of Harvard Students’ Confidence Intervals
Percentage with the True Value Falling:
|
|
Below |
Below |
Below |
Above |
Above |
Above |
True |
Number |
Title |
0.01 |
0.25 |
0.50 |
0.50 |
0.75 |
0.99 |
Value |
|
|
|
|
|
|
|
|
|
1 |
Bourbon |
3 |
19 |
39 |
61 |
21 |
10 |
42.5 |
4 |
Israel |
51 |
92 |
98 |
2 |
1 |
0 |
10.4 |
6 |
Doctors |
24 |
38 |
50 |
50 |
37 |
27 |
2,600 |
8 |
Eggs |
9 |
11 |
24 |
76 |
66 |
58 |
64.588 |
9 |
Cars |
25 |
40 |
58 |
42 |
33 |
26 |
697 |
|
|
|
|
|
|
|
|
|
|
|
|
|
Confirmation Bias |
|
201 |
|
percentage, and then lowering the number until one felt there was only a very small probability (0.01 to be exact) the number could be below that point. Students who did not have much knowledge of what others drank (e.g., if they didn’t attend such gatherings), they should guess an extremely low number to reflect their lack of knowledge— perhaps a number like 2 percent. If they had a lot of knowledge regarding the actual percentage (perhaps they had conducted a survey previously) they should choose a number much closer to the truth—perhaps 40 percent. When each student conducts this exercise, if all are correctly calibrated, only one out of a hundred on average should choose a number above the true value. Table 8.2, however, shows that three out of 100 chose a number that was higher than the truth. This indicates that students were not successful in assessing how little knowledge they truly held regarding other students’ drinking preferences.
First examine the column labeled “Below 0.01.” If the students were correctly calibrated, the percentage falling below 0.01 should be 1 for each of the questions. In fact the closest to this number were the responses to question 1, with only 3 percent falling below, three times the amount that should have fallen below. In fact, of all 10 questions they were asked, the correct number fell below the 0.01 mark for only two of the questions. On average, 15.8 percent of the true values fell below the 0.01 values given by the students.
One may argue that the questions are esoteric, and thus the students might have had very little knowledge upon which to base their answers. If their knowledge is lacking, the correct response would be to lower their guess at the 0.01 value to reflect their lack of knowledge. For example, one could be certain there were more than 10 doctors in the phone book. Similarly, the column labeled “Above 0.99” contains values that exceed the 0.01 that should appear were the students well calibrated. Here, among all 10 questions, 26.8 percent of the 0.99 values fell below the true value, where only 1 percent should have fallen below. On average, the 75 percent confidence intervals contained the true value about 33 percent of the time. The 98 percent confidence intervals contained the truth about 57 percent of the time. Clearly these confidence intervals were too narrow, a form of overconfidence. Harvard students thought they knew more about the answers than they truly did, creating confidence intervals that did not contain the truth with as high a probability as they had thought.
Alpert and Raiffa thought it should be possible to train people to avoid overconfidence. Thus, following the first round of questions, students were given feedback as to how they and other students had performed on the task, emphasizing how narrow the confidence intervals had been relative to the proper size of the confidence interval. After this training, students were asked another 10 similar questions. After the training, the 50 percent confidence intervals contained the truth about 43 percent of the time. The 98 percent confidence intervals contained the truth only 77 percent of the time. This is an improvement. However, even after training and awareness of the overconfidence problem, students could not widen their confidence intervals enough to account for their lack of knowledge. This was a particular problem for the extreme values. In other similar experiments participants were asked to find 99.8 percent and 99.98 percent confidence intervals with results that only contained the true value about 45 percent of the time. Thus, overconfidence may be persistent even when we are aware of our overconfidence.

|
|
|
|
|
202 |
|
CONFIRMATION AND OVERCONFIDENCE |
EXAMPLE 8.6 Entrepreneurship and Risk
Starting a new business venture involves substantial risk. Four of 10 new businesses fail in their first year of operation, and nearly nine in 10 fail in the first several years of operation. On top of this, new business owners generally make substantially less money over the first few years of operation than they could have earned by sticking to more-conventional employment. Given the huge risks and the investment of time, money, and resources, what would drive someone to be an entrepreneur? One might think that entrepreneurs are simply less risk averse than the rest of the population and are more willing to tolerate the large risks they face.
Robert Brockhaus (among others) compared the responses of entrepreneurs and nonentrepreneurs to a series of questions intended to gauge their propensity to take on risk. Essentially, he asked them for their willingness to take on a series of simple lotteries. He found no particular difference between entrepreneurs and nonentrepreneurs in their willingness to take on financial risk. If one takes on greater risks, but does not prefer more risk, what would drive the behavior?
One possibility is that entrepreneurs do not perceive the risks they face as well as others. For example, Lowell Busenitz and Jay Barney administered a test of overconfidence to a set of entrepreneurs and a set of managers in large companies. This test asked participants a set of questions with two possible answers. Participants were required to state their guess as to which answer was right and their assessment of the probability that they were correct (they were allowed to choose 0.5, 0.6, 0.7, 0.8, 0.9 or 1). Aside from when specifying a probability of 0.5, entrepreneurs were right substantially less often than would be implied by perfect calibration. For example, when they specified that they were 90 percent certain that they had selected the right answer, they were right about 70 percent of the time. Moreover, aside from at the 0.8 probability of being correct (where managers and entrepreneurs were tied) entrepreneurs were more overconfident than managers at every level of confidence. Thus, entrepreneurs simply might not recognize the level of risk that they will face in their venture.
Colin Camerer and Dan Lovallo used economic experiments to test for a link between overconfidence and entrepreneurial activity. Participants were placed in groups and asked to decide whether to enter a market or not. All players had to make their decision without communicating with other participants. If a participant decided not to enter the market, they would receive K. If they decided to enter, they would be assigned a rank. For each round, a number of participants, c, was specified as the market capacity. The top c ranked players would receive K plus some reward based on rank (totaling to $50 across all c of those in this group). Those ranked below c would receive K minus $10. Some participants were assigned a rank based on their ability to answer a set of trivia questions (after all rounds of the experiment concluded), and others were simply randomly assigned a rank. However, participants were told whether skill or chance would determine rank prior to deciding on whether to enter. When rank is determined by skill, people enter based on their own belief regarding their ability relative to others. Alternatively, when rank is determined by a random device, individual ability does not play