

- •VOLUME 1
- •CONTRIBUTOR LIST
- •PREFACE
- •LIST OF ARTICLES
- •ABBREVIATIONS AND ACRONYMS
- •CONVERSION FACTORS AND UNIT SYMBOLS
- •ABLATION.
- •ABSORBABLE BIOMATERIALS.
- •ACRYLIC BONE CEMENT.
- •ACTINOTHERAPY.
- •ADOPTIVE IMMUNOTHERAPY.
- •AFFINITY CHROMATOGRAPHY.
- •ALLOYS, SHAPE MEMORY
- •AMBULATORY MONITORING
- •ANALYTICAL METHODS, AUTOMATED
- •ANALYZER, OXYGEN.
- •ANESTHESIA MACHINES
- •ANESTHESIA MONITORING.
- •ANESTHESIA, COMPUTERS IN
- •ANGER CAMERA
- •ANGIOPLASTY.
- •ANORECTAL MANOMETRY
- •ANTIBODIES, MONOCLONAL.
- •APNEA DETECTION.
- •ARRHYTHMIA, TREATMENT.
- •ARRHYTHMIA ANALYSIS, AUTOMATED
- •ARTERIAL TONOMETRY.
- •ARTIFICIAL BLOOD.
- •ARTIFICIAL HEART.
- •ARTIFICIAL HEART VALVE.
- •ARTIFICIAL HIP JOINTS.
- •ARTIFICIAL LARYNX.
- •ARTIFICIAL PANCREAS.
- •ARTERIES, ELASTIC PROPERTIES OF
- •ASSISTIVE DEVICES FOR THE DISABLED.
- •ATOMIC ABSORPTION SPECTROMETRY.
- •AUDIOMETRY
- •BACTERIAL DETECTION SYSTEMS.
- •BALLOON PUMP.
- •BANKED BLOOD.
- •BAROTRAUMA.
- •BARRIER CONTRACEPTIVE DEVICES.
- •BIOCERAMICS.
- •BIOCOMPATIBILITY OF MATERIALS
- •BIOELECTRODES
- •BIOFEEDBACK
- •BIOHEAT TRANSFER
- •BIOIMPEDANCE IN CARDIOVASCULAR MEDICINE
- •BIOINFORMATICS
- •BIOLOGIC THERAPY.
- •BIOMAGNETISM
- •BIOMATERIALS, ABSORBABLE
- •BIOMATERIALS: AN OVERVIEW
- •BIOMATERIALS: BIOCERAMICS
- •BIOMATERIALS: CARBON
- •BIOMATERIALS CORROSION AND WEAR OF
- •BIOMATERIALS FOR DENTISTRY
- •BIOMATERIALS, POLYMERS
- •BIOMATERIALS, SURFACE PROPERTIES OF
- •BIOMATERIALS, TESTING AND STRUCTURAL PROPERTIES OF
- •BIOMATERIALS: TISSUE-ENGINEERING AND SCAFFOLDS
- •BIOMECHANICS OF EXERCISE FITNESS
- •BIOMECHANICS OF JOINTS.
- •BIOMECHANICS OF SCOLIOSIS.
- •BIOMECHANICS OF SKIN.
- •BIOMECHANICS OF THE HUMAN SPINE.
- •BIOMECHANICS OF TOOTH AND JAW.
- •BIOMEDICAL ENGINEERING EDUCATION
- •BIOSURFACE ENGINEERING
- •BIOSENSORS.
- •BIOTELEMETRY
- •BIRTH CONTROL.
- •BLEEDING, GASTROINTESTINAL.
- •BLADDER DYSFUNCTION, NEUROSTIMULATION OF
- •BLIND AND VISUALLY IMPAIRED, ASSISTIVE TECHNOLOGY FOR
- •BLOOD BANKING.
- •BLOOD CELL COUNTERS.
- •BLOOD COLLECTION AND PROCESSING
- •BLOOD FLOW.
- •BLOOD GAS MEASUREMENTS
- •BLOOD PRESSURE MEASUREMENT
- •BLOOD PRESSURE, AUTOMATIC CONTROL OF
- •BLOOD RHEOLOGY
- •BLOOD, ARTIFICIAL
- •BONDING, ENAMEL.
- •BONE AND TEETH, PROPERTIES OF
- •BONE CEMENT, ACRYLIC
- •BONE DENSITY MEASUREMENT
- •BORON NEUTRON CAPTURE THERAPY
- •BRACHYTHERAPY, HIGH DOSAGE RATE
- •BRACHYTHERAPY, INTRAVASCULAR
- •BRAIN ELECTRICAL ACTIVITY.
- •BURN WOUND COVERINGS.
- •BYPASS, CORONARY.
- •BYPASS, CARDIOPULMONARY.

500BLOOD RHEOLOGY
31.Ying H, McEachern M, Eddleman DW, Sheppard LC. Fuzzy control of mean arterial pressure in postsurgical patients with sodium nitroprusside infusion. IEEE Trans Biomed Eng 1992;BME-39:1060–1070.
32.Hunt KJ, Sbarbaro D, Zbikowski R, Gawthrop PJ. Neural networks for control systems—a survey. Automatica 1992;28: 1083–1112.
33.Chen CT, Lin WL, Kuo TS, Wang CY. Adaptive control of arterial blood pressure with a learning controller based on multilayer neural networks. IEEE Trans Biomed Eng 1997;BME-44:601–609.
34.Kashihara K, et al. Adaptive predictive control of arterial blood pressure based on a neural network during acute hypotension. Ann Biomed Eng 2004;32:1368–1383.
See also BIOFEEDBACK; BLOOD PRESSURE MEASUREMENT; DRUG INFUSION SYSTEMS; HEMODYNAMICS; PHYSIOLOGICAL SYSTEMS MODELING.
BLOOD RHEOLOGY
ROGER TRAN-SON-TAY
University of Florida
Gainesville, Florida
WEI SHYY
University of Michigan
Ann Arbor, Michigan
INTRODUCTION
Blood rheology has had broad impact in our understanding of diseases and in the development of medical technology. Rheology is the science dealing with the flow and deformation of matter. Therefore, it encompasses work in mechanical, chemical, and biomedical engineering. It plays a vital role not only in the design, manufacture, and testing of materials, but also in the health of the human body. Biorheology is therefore concerned with the description of the flow and deformation of biological substances. More specifically, hemorheology, or blood rheology, deals with the rheological behavior of blood, including plasma and cellular constituents.
Blood flow is known to be responsible for the delivery of oxygen to tissue and the removal of carbon dioxide. However, it also plays a pivotal role in the transport of substances (nutrients, metabolites, hormones, cells, etc.) involved not only in the maintenance of the body and its immune response, but also in diseases. For example, cancer cells are transported through blood as they spread from one tissue to another in a process known as metastasis.
The rheology of blood is altered in a number of pathological conditions. Sickle cell disease is a genetic disease producing abnormal hemoglobin causing red blood cells (RBCs) to become crescent shaped when they unload oxygen molecules or when the oxygen content of the blood is lower than normal. Under these conditions, the sickle hemoglobin aggregates and the RBCs become rigid, and consequently obstruct and/or damage the capillaries. Sickle cell disease is also known as sickle cell anemia because of the abnormally low oxygen-carrying capacity of the blood due to an insufficient number of RBCs and an
abnormal hemoglobin. During a heart attack or stroke, there is a partial or complete occlusion of blood vessels due to the formation of a blood clot that alters blood flow. It is clear that many diseases and factors (artherosclerosis, hypertension, vasodilator agents, etc.) can compromise blood flow by occluding vessels or modifying their rheological properties. However, the study presented here will focus mainly on the rheology of blood.
It is important to recognize that the rheological properties of blood and its components, that is, blood cells, are important in the aptitude of blood to perform its functions correctly. The ability of a blood cell to flow into capillaries or migrate through tissues is governed, but its rheological properties. In addition, flow is expected to affects cells in two ways: (1) the fluid moving over or around the cell will exert mechanical stress on the cell, and (2) the motion of fluid will alter the concentration of chemical species in the immediate surrounding of the cell, leading to the mass transport of nutrients, waste products, drugs, hormones, and so an, to and from the cell. Finally, blood rheology can also have an indirect but critical role in our immune system and in diseases since a given applied stress, such as fluid shear, can generate a signal that can induce or modify cellular response.
Blood rheology is an extremely broad subject that cannot be covered in a single review. Therefore, the scope of the present article is to provide an understanding of blood rheology, and an appreciation of its contributions to the improvement of our understanding and assessment of diseases. The article also provides a review of the most common methods used to measure the rheological properties of blood and blood cells.
RHEOLOGICAL PROPERTIES OF BLOOD
Is blood a Newtonian fluid? A Newtonian fluid is a fluid that has a viscosity that is constant and independent of the properties of the flow. This simple question is not easily answered because blood is a complex fluid. It is a nonNewtonian fluid that behaves as a Newtonian fluid under certain conditions. For example, for a shear rate > 100 s 1 and a vessel/tube diameter > 500 mm, blood behaves as a Newtonian fluid. Blood is composed of formed elements (red cells, white cells, platelets, etc.) suspended in plasma. Blood cells are viscoelastic particles (possess both viscous and elastic properties), whereas plasma is Newtonian. Therefore, depending on the characteristics of the flow and size of the vessel (extent of deformation), the size and properties of the blood cells may not play a major role in the flow characteristics of blood. The behavior of blood needs to be described as a function of the size of the vessel and the rate of flow. Because of that behavior, the concept of apparent and relative viscosities is introduced. The viscosity value of a non-Newtonian fluid depends on the experimental conditions and instrument used to perform the measurement. Therefore, that measured viscosity is called the apparent viscosity, mapp. The relative apparent viscosity, mrel, is defined as
mapp |
ð1Þ |
mrel ¼ mp |
|
9 |
|
|
|
|
VISCOSITY |
8 |
|
|
|
|
7 |
|
|
|
Whole blood |
|
|
|
|
|
||
6 |
|
|
|
|
|
5 |
|
|
|
|
|
|
|
|
|
|
|
RELATIVE |
4 |
|
|
|
|
3 |
|
|
|
|
|
2 |
|
|
|
Plasma |
|
|
|
|
|
||
1 |
|
|
|
Water |
|
|
|
|
|
||
|
0 |
|
|
|
|
|
0 |
20 |
40 |
60 |
80 |
HEMATOCRIT (%)
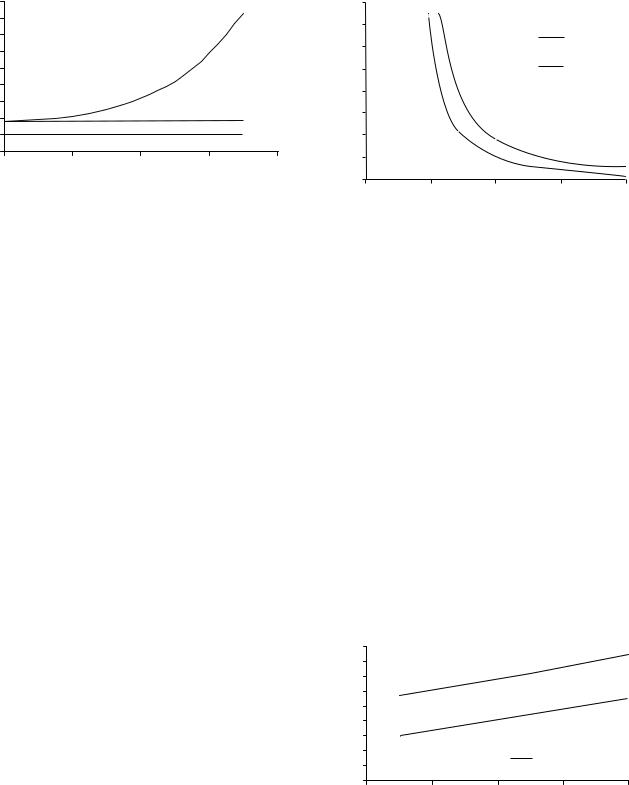
Figure 1. Effect of hematocrit on blood viscosity. Plasma has a relative viscosity of 1.8 at 37 8C, that is a viscosity of1.2 mPa s. Human blood at 40% hematocrit has a viscosity of3–4 mPa s. However, it is a function of both hematocrit and shear rate.
where mp is the viscosity of plasma or other suspending medium.
In general, the viscosity of plasma is 1.8 times the viscosity of water (termed relative viscosity) at 37 8C and is related to the protein composition of the plasma. Whole blood has a relative viscosity of 4 depending on hematocrit (RBC concentration), temperature, and flow rate. The average hematocrit for a man and a woman is 42 and 38%, respectively. Hematocrit is an important determinant of the viscosity of blood. As hematocrit increases, there is a disproportionate (exponential) increase in viscosity (Fig. 1). For example, at a hematocrit of 40%, the relative viscosity is 4. At a hematocrit of 60%, the relative viscosity is 8. Therefore, a 50% increase in hematocrit from a normal value increases blood viscosity by 100%. Such changes in hematocrit and blood viscosity occur in patients with polycythemia.
Because blood is non-Newtonian, the effect of shear rate is important. Figure 2 illustrates the shear thinning characteristic (decrease in viscosity as the shear rate increases) of blood at two different temperatures. On the other hand, it is clearly seen that plasma is Newtonian. It has a viscosity of 1.2 cP or 1.2 mPa s at 37 8C. The poise, P, is a unit of viscosity. The different viscosity units are related as follows: 1 P ¼ 1 dyn s cm 2 ¼ 0.1 N s m 2 ¼ 0.1 Pa s; therefore, 1 cP ¼ 1 mPa s. The fact that blood viscosity increases at low shear is one of the key factors for the initiation of atherosclerosis at specific sites in the arterial system. Increases in the viscosity of blood and plasma reflect clinical manifestations of atherothrombotic (formation of fibrinous clot) vascular disease. High blood viscosity invariably accompanies degenerative diseases. It is therefore not surprising that many treatments involve lowering blood viscosity to treat or prevent heart attacks, strokes, atherosclerosis, and so on.
Temperature also has a significant effect on viscosity. This can be seen in Figs. 3 and 4 where the effect of temperature on the viscosity of plasma and human blood is shown. Temperature has a similar effect on plasma and water. As temperature decreases, viscosity increases. Viscosity increases 2% for each degree celcius decrease
BLOOD RHEOLOGY |
501 |
160
140
|
120 |
|
|
|
|
|
10ºC |
|
|
(cp) |
|
|
|
|
|
37ºC |
|
|
|
100 |
|
|
|
|
|
|
|
||
|
|
|
|
|
Plasma 37ºC |
|
|||
VISCOSITY |
|
|
|
|
|
|
|||
80 |
|
|
|
|
|
|
|
|
|
|
|
|
|
|
|
|
|
|
|
|
60 |
|
|
|
|
|
|
|
|
|
40 |
|
|
|
|
|
|
|
|
|
20 |
|
|
|
|
|
|
|
|
|
0 |
|
|
|
|
|
|
|
|
|
0.01 |
0.1 |
1 |
|
|
10 |
100 |
||
|
|
|
SHEAR RATE (1/sec) |
|
|
|
|
||
Figure 2. Effect of shear rate on blood viscosity. The Newtonian behavior of plasma and non Newtonian behavior of blood are clearly demonstrated. Plasma has a constant viscosity of1.2 mPa s at 37 8C. The effect of temperature on blood viscosity is also shown.
in temperature. This effect has several implications. For example, when whole-body hypothermia is used during certain surgical procedures, it increases blood viscosity and therefore augments resistance to blood flow.
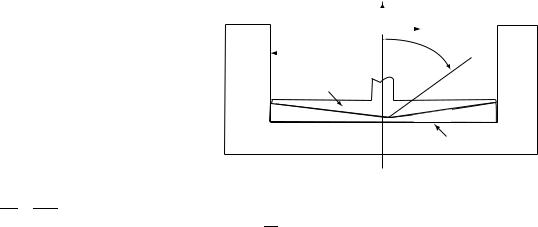
The viscoelastic profile of normal human blood can be divided into three regions depending on the shear rate levels. In the low shear rate region (g 20 s 1), red cells are in large aggregates and as the shear rate increases, the size of the aggregates diminishes. Blood viscoelasticity is dominated by the aggregation properties of the red blood cells. In this region, human blood behaves like a Casson fluid with a small but finite yield stress (i.e., blood will not flow or deform unless the applied stress exceeds that critical stress),
p |
t |
¼ |
a |
þ |
bq |
2 |
Þ |
|
|
g˙ |
ð |
||||
|
|
|
|
|
|
where a and b are constant (Fig. 5). The magnitude of the rheological parameters like yield stress and viscosity depends on various factors such as plasma protein concentration,
|
1.8 |
|
|
|
|
|
|
(cP) |
1.6 |
|
|
|
|
|
|
1.4 |
|
|
|
|
|
|
|
|
|
|
|
|
|
|
|
VISCOSITY |
1.2 |
|
|
|
|
|
|
1 |
|
|
|
|
|
|
|
|
|
|
|
|
|
|
|
|
0.8 |
|
|
|
|
|
|
|
0.6 |
|
|
|
|
|
|
|
|
|
|
|
Plasma |
|
|
|
0.4 |
|
|
|
|
|
|
|
|
|
|
|
Water |
|
|
|
0.2 |
|
|
|
|
|
|
|
|
|
|
|
|
|
|
|
0 |
|
|
|
|
|
|
|
40 |
35 |
30 |
25 |
20 |
||
TEMPERATURE (°C)
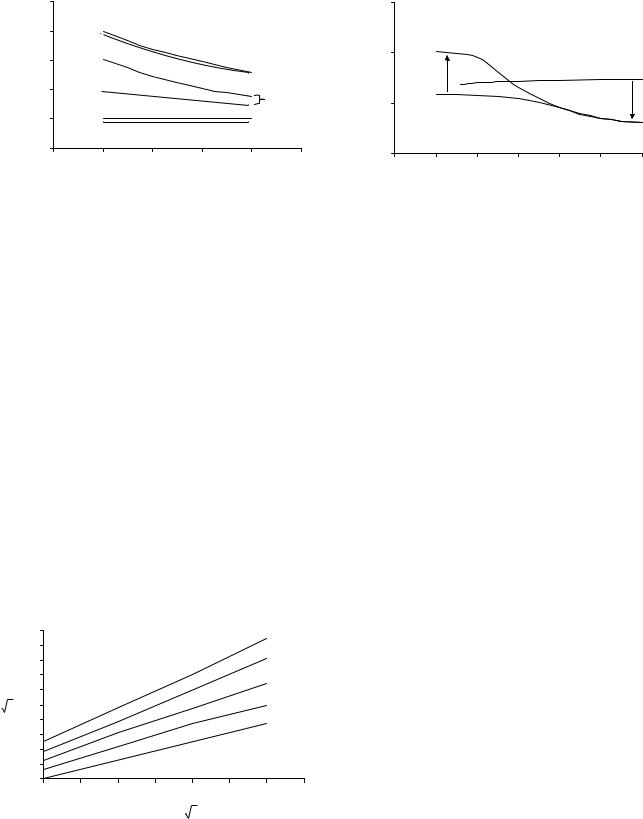
Figure 3. Effect of temperature on plasma viscosity. Temperature has similar effects on the viscosity of plasma and water. Viscosity increases 2% for each degree celcius decrease in temperature.
502 |
BLOOD RHEOLOGY |
|
|
|
|
|
|
10000 |
|
|
|
|
|
(cP) |
1000 |
|
|
|
|
|
|
|
|
|
|
|
|
VISCOSITY |
100 |
|
|
|
|
|
|
|
|
|
|
|
|
|
|
|
|
|
H=90% |
|
|
10 |
|
|
|
|
H=45% |
|
|
|
|
|
|
|
|
1 |
|
|
|
H=0% |
|
|
0.1 |
|
|
|
|
|
|
0.01 |
0.1 |
1 |
10 |
100 |
1000 |
SHEAR RATE (1/sec)
Figure 4. Effects of shear rate and hematocrit on blood viscosity. The shear thinning characteristics of blood is well illustrated in this figure. The solid and dashed lines represent, respectively, whole blood and washed red blood cells in a saline solution at 45 and 90% red cell volume concentrations. (Adapted from Ref. 1.)
hematocrit, and properties of the blood cells. At low flow rates, there are increased cell-to-cell and protein-to-cell adhesive interactions that can cause erythrocytes (RBC) to adhere to one another and increase the blood viscosity. However, at shear rates > 100 s 1, cell aggregation and rouleaux formation break up and blood behaves as a Newtonian fluid with a viscosity of 3–4 mPa s depending on the hematocrit and other factors (Fig. 6). In the midshear rate range (20 g 100 s 1), the cells are progressively disaggregated with increasing shear rate. Increasing shear rate causes the cells to deform and orient in the direction of flow, and the viscoelasticity of the blood is dominated by the deformability of the RBC. Figure 6 also demonstrates the effect of cell deformabilty on blood viscosity. It is seen that deformable cells lower the blood viscosity as compared to rigid ones.
However, when the dimensions of the cells are not negligible in comparison with the diameter of the vessel
|
1 |
|
|
|
|
Hematocrit |
|
|
|
|
|
|
|
|
46% |
|
|
|
0.9 |
|
|
|
|
|
|
|
|
|
|
|
|
|
39% |
|
|
|
0.8 |
|
|
|
|
|
|
|
|
|
|
|
|
|
|
|
|
|
0.7 |
|
|
|
|
|
27% |
|
|
0.6 |
|
|
|
|
|
|
|
|
|
|
|
|
|
19.2% |
|
|
t |
0.5 |
|
|
|
|
|
|
|
|
|
|
|
|
|
|
||
|
0.4 |
|
|
|
|
|
0% |
|
|
0.3 |
|
|
|
|
|
|
|
|
0.2 |
|
|
|
|
|
|
|
|
0.1 |
|
|
|
|
|
|
|
|
0 |
|
|
|
|
|
|
|
|
0 |
0.5 |
1 |
1.5 |
2 |
2.5 |
3 |
3.5 |
|
|
|
|
|
- |
|
|
|
|
|
|
|
|
g |
|
|
|
Figure 5. Blood behavior at low shear—casson behavior. These plots were generated from blood data obtained at 25 8C. They show that blood has a yield stress that depends on hematocrit. (Adapted from Ref. 2.)
1000
(cP) |
100 |
|
NP |
|
|
Deformation |
|
VISCOSITY |
|
|
NA |
|
|
||
|
|
Aggregation |
|
|
|
HA |
|
|
|
|
|
|
|
||
|
10 |
|
|
|
|
|
|
|
1 |
|
|
|
|
|
|
|
0.001 |
0.01 |
0.1 |
1 |
10 |
100 |
1000 |
SHEAR RATE (1/sec)
Figure 6. Effects of cell aggregation and deformability on blood viscosity. The logarithmic relation between the apparent viscosity and shear rate in three types of suspensions, each containing 45% human RBCs by volume is shown. Suspending plasma viscosity ¼ 1.2 mPa.s; NP ¼ normal RBCs in plasma; NA ¼ normal RBCs in 11% albumin; HA ¼ hardened RBCs in 11% albumin solution. (Adapted from Ref. 3.)
through which flow is occurring, the two phase nature of blood has to be recognized. Thus blood flow through vessels narrower than 500 mm in diameter is accompanied by several anomalous effects which can be directly traced to the two phase nature of blood. The important artifacts are the Fahraeus (a decrease in the hematocrit of the vessel– tube as compared to the larger feeding vessel–reservoir hematocrit) and Fahraeus–Lindqvist (a decrease in the vessel–tube apparent viscosity as compared to the larger feeding vessel–reservoir viscosity) effects. The effects are more pronounced as the vessel–tube diameter decreases. For vessel diameters < 10 mm (capillaries), blood cells must travel in single file and the flow must be analyzed as creeping (low Reynold number) flow of a Newtonian fluid with particles embedded in it. The transition from a single file to suspension flow occurs in the diameter range of 10– 25 mm and this domain is difficult to analyze.
To add to the complexity of blood behavior, vessels also affect blood flow characteristics. For example, the most noticeable feature of blood flow in the arteries is the pulsatile nature of the flow. However, this feature is lost in the microcirculation because its effect has been dampened by the viscoelastic blood vessels. The flow in the microcirculation occurs at very low Reynolds number (i.e., inertial forces due to transient and convective accelerations are negligible) and is determined by a balance of viscous stress and pressure gradient. Individual cells must be recognized. In the capillaries, 3–10 mm diameter vessels, cells flow in single line and their flow–deformation must be analyzed. Finally, in the veins, where 80% of the total volume of blood is located, the most noticeable feature is that vessels can collapse and that their mechanical properties cannot be neglected.
The above descriptions represent just some of the rheological characteristics of blood, but many more factors can affect its behavior. However, they prove the point that blood is an extremely complex fluid with many facets and that only a few have been unveiled so far.
CORRELATION BETWEEN BLOOD RHEOLOGICAL PROPERTIES AND CLINICAL CONDITIONS
Blood is a complex fluid whose flow (rheological) properties are significantly affected by the arrangement, orientation, and deformability of red blood cells. Variations in blood rheology among healthy individuals are very small. Thus, changes due to disease or surgical intervention can be readily identified, making blood rheology a useful clinical marker. Variations in blood rheology are observed in such conditions as cardiovascular disease, peripheral vascular disease, sickle cell anemia, diabetes, and stroke.
Although studies of blood rheology date from at least the early studies of Poiseuille (4), the discipline of clinical hemorheology is relatively new. It underwent a rapid growth in 1970–1980, in large part due to support by pharmaceutical companies and equipment manufacturers. Various instruments and devices were developed specifically for studying blood rheology.
Some of the early clinical tests dealing with blood rheology were on blood coagulation and the formation of blood clots. Most people think of blood in its liquid state, but its ability to thicken into a blood clot is a vital part of the body’s natural defense. This process of forming a clot is referred to as coagulation. Blood coagulation, or blood clotting, is a complex process involving platelets, coagulation factors present in the blood and blood vessels. If blood becomes too thin, it loses the ability to form the blood clots that stop bleeding. When blood becomes too thick, the risk of blood clots developing within the blood vessels rises creating a potentially life-threatening condition. Blood disorders occur when hemostasis falls out of balance. Hemostasis is achieved when blood chemicals, hormones and proteins are correctly balanced. Hemostasis refers to the complicated chemical interplay that maintains blood fluidity (e.g., viscosity, elasticity, and other rheological properties).
Coagulation, or the lack thereof, is a key factor in various diseases. Sometimes thrombi (large clots) can completely occlude vessels. This can lead to ischemia, and ultimately death in any part of the body. Myocardial infarction and stroke are among the major life-threatening conditions caused by vessel occlusion due to clots. Conversely, there are various coagulatory disorders in which thrombus formation does not occur when it should. These bleeding disorders include various forms of hemophilia [e.g., (5,6)].
A great deal of research has focused on the effects of rheology on thrombus formation. Various ex vivo and in vitro systems have been designed to mimic in vivo blood flow in order to study thrombus formation within the circulatory system (7), and on various devices. For example, these systems have been used to model blood flow in order to study thrombus formation on stents (8) and mechanical heart valve prostheses (9). In addition, some research has focused on the effect of shear on thrombus dissolution. These studies suggest that thrombi lysis is accelerated with increasing shear rates (10,11).
It is impossible to cite all the contributions of blood rheology to our understanding of diseases in this review, but it is clear that viscosity was and still is clinically the
BLOOD RHEOLOGY |
503 |
most commonly used rheological property. The principal factors determining blood viscosity are hematocrit, plasma viscosity, cell aggregation, and cell deformability. Earlier rheological work was mainly performed on whole blood and on RBCs because the latter are by far the most numerous cells in our body (99% of the blood cells are RBCs). However, in the last two decades, the focus has shifted toward understanding the rheology of leukocytes or white blood cells (WBC) because they have been found to be bigger and more rigid that RBC. The major motivation behind all these blood cell studies is that the ability of a cell to deform and flow through the capillaries and/or to migrate in the tissue is determined by its rheological properties, and this ability is vital in its response to disease/infection. These properties, in turn, are a manifestation of the underlying structure of the cell and the organization of the structural components (microfilaments (F-actin), microtubules, intermediate filaments, lipid bilayer) in the cellular cytoplasm and cortex.
Because blood rheology is a very broad subject, this article focuses on the role of RBC deformability in clinical studies. The role of other blood cell types, cytoskeleton, proteins, adhesion molecules, and so on., although important and of interest, is beyond the scope of this article and will not be addressed.
RBC Deformability
Deformability is a term used to describe the ability of a body (cell in the present context) to change its shape in response to an applied force. A very important characteristics of a normal RBC is that it has a surface area 30%– 40% greater than that of a sphere of equal volume. Other major determinants of RBC deformability include rheological properties of the cell membrane, and intracellular fluid.
Cell deformability can be determined by direct microscopic measurement (micropipette) or indirect estimation (filtration). By using micropipettes with diameters 3 mm, the entire RBC can be aspirated. The deformability of the cell can be estimated from the pressure required for its total aspiration.
The importance of cell deformability is well established in the studies of the rheological behavior of RBCs in the capillary network. It was clearly demonstrated that reductions in RBC deformability may adversely affect capillary perfusion (12) and that many diseases manifest reductions in RBC deformability (13–15). Of the many determinants of capillary perfusion, the size of the undeformed RBC relative to the capillary diameter may play the greatest role in affecting capillary perfusion. For example, studies of the passage of RBCs through capillary-sized pores of polycarbonate sieves (16) reveal that the flow resistance may increase 30–40 times as the ratio of pore to cell diameter is reduced from 1 to 0.1. Furthermore, after entry into a capillary, the ability of RBCs to deform may play an equally important role as RBCs negotiate irregularities in the capillary lumen, as manifested by encroachment of endothelial cell nuclei on the capillary lumen (17). It was also demonstrated that the microvascular network may passively compensate for increased RBC stiffness by
504 BLOOD RHEOLOGY
shunting RBCs within the capillary network through pathways of lesser resistance (18).
There are many methods for assessing the erythrocyte deformability but only two (filtration of RBCs through pores of 3–5 mm diameter and the measurement of RBC elongation using laser diffractometry) have been widely applied clinically. A brief description of these two methods is provided below.
Erythrocyte Filtration. Filtration method has been commonly used to study the deformability of RBC. The basic idea is to force the RBC suspension to flow through 3–5 mm pores (by using a negative or positive pressure or gravity), and obtain the relationship between pressure and flow rate to estimate the deformability of the cells. Either the flow rate is measured under a constant pressure or the pressure is measured under a constant flow rate. Contaminants, such as WBC, which is poorly deformable affect the experiment by plugging the pores.
The techniques for whole-blood filtration are almost all derived from that described by Reid et al. in 1976 (19). The results of these methods are expressed as volume of blood cells (VBCs) in the time unit. However, this technique is susceptible to aggregation of RBCs and contamination with leukocytes. A modified version of the apparatus was developed to reduce these problems (20). Nevertheless, WBC contamination remains an issue with whole-blood filtration techniques.
A common draw back among all these filtrometry-based instruments is the lack of any measure of individual cell volume, thereby making it difficult to distinguish changes in RBC filtration due to the volume distribution (or aggregates) within the RBC sample from those due to intrinsically less deformable cells.
Another filtration technique that is commonly used is the Bowden assay (21,22). However, this assay involves the migration of cells (WBCs) through a filter membrane with pores of defined diameter and is beyond the scope of this article.
Erythrocyte Elongation. The Ektacytometer (23) combines viscosity with laser diffractometry. It consists of a transparent cylindrical Couette or a cone-plate viscometer, which allows a helium–neon laser beam to pass through the erythrocyte test suspension during rotational shear. The laser diffracted image becomes elliptical as the RBCs are sheared, and the ratio of the major over minor axes of the image is called the elongation index. This dynamic measurement of RBC elongation has been used for the rheological studies of congenital defects of RBC membrane protein (24), and many blood disorders (25–27).
It is important to remember that the two methods described above provide information on the bulk deformability of the RBC only, and are not suited for characterizing the deformability of subpopulations. Alternative methods need to be used for these studies. Some of the methods that have been developed for specifically characterizing the rheological properties of individual cells are provided in the next section.
RHEOLOGICAL PROPERTIES MEASUREMENTS
The goal of this section is to provide an overview of the most commonly used techniques for characterizing the rheological properties of blood. Therefore, devices will be divided into two groups: one for characterizing fluids, the other for individual cells.
Techniques for Measuring the Rheological Properties of a Fluid
Cylindrical Tube. The first studies of blood rheology have been done in cylindrical tubes. In his quest toward developing a better method for measuring blood pressure, French physician and physiologist Jean Louis (or sometimes called Leonard) Marie Poiseuille (1799–1869) studied the flow of liquid through tubes. (There is some confusion about Poiseuille’s precise name and year of birth, sometimes quoted as 1797.) In 1838, he established a series of meticulously executed experiments: At a given temperature the rate of water flow through tubes of very fine bore is inversely proportional to the length of the tube and directly proportional to the pressure gradient and to the fourth power of the tube diameter. In 1840 and 1846, he formulated and published an equation known as Poiseuille’s law (or Hagen-Poiseuille law, named also after the German hydraulic engineer Gotthilf Heinrich Ludwig Hagen who independently carried out friction experiments in low speed pipe flow in 1840) based on his experimental pipe flow observation. Little is known of the life of Jean Leonard Marie Poiseuille. However, he made important contributions to the experimental study of circulatory dynamics. His law can be successfully applied to blood flow in capillaries and veins, and to air flow in lung alveoli, as well as for the flow through hypodermic needle or tubes, in general (28,29).
The derivation of Poiseuille’s law for a Newtonian fluid, that is, the viscosity of the fluid is constant and independent of the properties of the flow. (Viscosity is a property of fluid related to the internal friction of adjacent fluid layers sliding past one another, as well as the friction generated between the fluid and the wall of the vessel. This internal friction contributes to the resistance to flow.) For example, water and plasma are Newtonian fluids. For a Newtonian, laminar (nonturbulent) case, the flow through a cylindrical tube is one-dimensional (1D) (Fig. 7) reaching the fully
r
Vx |
γ |
R |
x |
|
Le
Figure 7. Flow in a cylindrical tube. Fully developed, laminar, viscous flow in tubes produces a parabolic velocity profile. The shear stress varies linearly with the radial distance r. Parameters are as follows: velocity field, Vx ¼ Vx(r), Vr ¼ 0, Vu ¼ 0; shear rate, g¼ (@Vz/@r); lines of shear, straight lines parallel to the tube axis; shearing surfaces, concentric cylinders.
developed state, that is, exhibiting no variation in velocity profiles in the streamwise, X direction, and the streamwise velocity, Vx, has the following distribution on any crosssection
Vx |
|
R2DP |
1 |
|
r |
|
2 |
3 |
|
¼ |
|
R |
Þ |
||||||
|
4 mL |
|
ð |
||||||
where DP is the pressure drop between two points located at a distance L apart, R is the tube radius, r is the radial distance from the tube axis, and m is the fluid viscosity.
For 1D laminar flows in pipe, the pressure gradient, DP, necessary to produce a given flow rate, Q, is proportional to the viscosity and, as shown from the above equation, inversely proportional to the fourth power of the tube radius,
DP 8mQ |
ð4Þ |
L ¼ pR4 |
This equation has important clinical implications. It tells us that for a given pressure drop, a 10% change in vessel radius will cause 50% change in blood flow. Conversely, for a fixed flow, a 10% decrease in vessel radius will cause 50% increase in the required pressure difference. Poiseuille law tells us the consequences of having a reduced vessel lumen like in arteriosclerosis.
Thus, the average fluid velocity can be expressed in
terms of the volumetric flow rate Q or pressure DP |
|
||||||
|
|
|
Q |
|
R2DP |
|
|
|
V ¼ |
¼ |
ð5Þ |
||||
|
pR2 |
8 mL |
|||||
For a Newtonian fluid, the shear stress distribution in
the tube is linear with r, |
|
|
|
|
|
˙ |
dVz |
|
rDP |
ð6Þ |
|
t ¼ mg ¼ m |
|
¼ |
|
|
|
dr |
|
2L |
|||
The shear stress is the frictional force per unit area as one layer of fluid slides past an adjacent layer. Therefore, the maximum shear stress occurs along the tube wall and is
equal to |
|
|
|
|
|
|
|
|
|
|
|
|
|
|
|
|
|
||
tz ¼ |
RDP |
¼ |
4 mQ |
¼ |
4mV |
ð7Þ |
|||
|
|
|
|
|
|
||||
2L |
|
pR3 |
R |
||||||
The viscosity of blood and other fluids have been characterized with cylindrical tube devices. For example, Can- non–Fenske viscometers are cylindrical tubes used to measure the viscosity of fluids. However, they are not commonly used for measuring non–Newtonian fluids because the shear rate generated in these devices is not constant so its effect on viscosity cannot be easily characterized.
Viscometers. Viscometers are designed to measure the viscosity of fluids. They come in many forms (e.g., concentric cylinders, parallel disks) (30), but the review will focus only on instruments that have been used to characterize biological fluids (31,32). The most common is the cone-plate arrangement (Fig. 8) because it produces a linear velocity profile and, consequently, a constant shear rate throughout the gap for small cone angles.
For a cone-plate viscometer of radius R and cone angle ao, the relevant parameters, such as viscosity and shear rate, can be found by setting the angular speed of rotation
BLOOD RHEOLOGY |
505 |
z
|
|
r |
R |
|
θ |
|
||
|
|
 ω
ω
Cone
αo
Plate
Figure 8. Cone-plate viscometer. For small cone angles, the
flow between the cone and the plate is linear. Parameters are as follows: velocity field, Vf ¼ Vfðr; uÞ; Vu ¼0; Vr ¼ 0; shear rate, g ¼ ð1rÞð@@uVfÞ; lines of shear, circles of constant r and z; shearing surfaces, cones of constant u.
of the cone, v, and observing the resultant torque, T. These relationships are provided through the expressions of the shear stress, t, and shear rate, g.
|
|
|
|
|
t ¼ |
3T |
¼ |
mv |
|
|
|
|
|
|
|
ð8Þ |
|||||
|
|
|
|
|
2pR3 |
ao |
|
|
|
|
|
|
|||||||||
g |
|
sin u d |
|
Vf |
|
|
1 dVf |
|
rv |
¼ |
v |
9 |
|
||||||||
|
¼ |
|
|
|
|
|
|
|
|
|
¼ |
|
|
|
|
ð |
Þ |
||||
|
r du |
|
sin u |
r |
du |
|
d |
ao |
|||||||||||||
In Eq. 9, d represents the gap width at a radial distance, r. In order to measure the elastic properties, dynamic testing needs to be performed. These viscometers have to be run in an oscillatory mode so that elastic effects can be detected. In general, the rheological properties of the fluid can be described in terms of the complex viscosity h , or complex modulus G . These complex parameters are composed of a viscous and an elastic components, and are related to each other by the angular frequency of the oscillation v (G ¼ vh ). It is common to mix the notation and use the viscous component, h’, of h , and the elastic component or storage modulus, G’, of G , to characterize the viscoelastic properties of the fluid. The viscous and elastic components represent, respectively, energy lost irreversibly and stored
reversibly by the sample during an oscillatory cycle.
Microrheometers. As opposed to viscometers, rheometers are devices that measure not only viscosity, but also other rheological properties, like elasticity and yield stress. However, that characterization is very casual since many viscometers have been modified, as described above, to measure the viscoelastic properties of fluids.
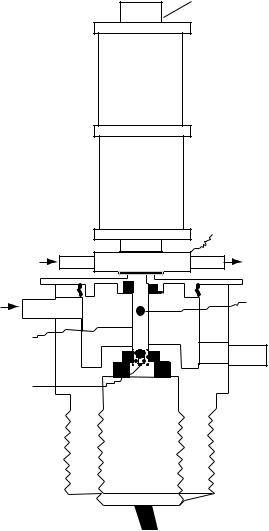
As their names indicate, microrheometers have been developed to measure the rheological properties of small volume biological fluids. Typically, these machines require one drop of fluid or less. The design of the magneto-acoustic ball microrheometer for measuring the rheological properties of a liquid is shown in Fig. 2 (33). This instrument requires a much smaller sample size (20 mL, i.e., about a drop) than traditional rheometers, and opaque suspensions
506 BLOOD RHEOLOGY
can be studied with it. The small-volume rheometer permits accurate temperature control and rapid temperature changes for kinetics studies, if needed (34).
The instrument itself consists of a magnetically driven 0.8 or 1.3 mm stainless steel ball that is tracked by ultrasonic echo location as it moves within the sample fluid. Using a system consisting of a time-to-voltage Converter (TVC), a pulse generator, a differential amplifier, and an oscilloscope (150 MHz), ball displacements as small as 3 mm are measured. The improved microrheometer (34) is capable of accurately measuring the viscosity of water in the very short chamber. Two measurements can be made (1) a falling-ball viscosity and (2) an oscillating-ball frequency dependent viscoelastic measurement. Parameters measured are h, the falling ball or steady-state viscosity; h’, the viscous or loss modulus; and G’, the elastic or storage modulus.
An experiment with the falling ball consists of dropping the ball along the centerline of a 10 mm long tube with a radius of 1.6 mm. The tube is surrounded by a large flowthrough chamber for accurate temperature control (Fig. 9). The terminal velocity of the ball, V, is inversely proportional to the viscosity, h. In rheology, it is common to denote the viscosity as h for a viscoelastic fluid. This velocity– viscosity relationship is readily derived from the Stokes drag equation:
h ¼ 2½ðrs rÞR2g&=9 VK |
ð10Þ |
where rs and r are the ball and fluid density, respectively, R is the ball radius, g is the acceleration due to gravity, and K is the wall correction factor to account for the tube wall effect.
Oscillating ball experiments are operated over a frequency range of 1–20 Hz, whereby the sinusoidal driving force and the resulting sinusoidal sphere displacement are recorded. The magnitude of the displacement sinusoid and its phase shift relative to the driving force provide a measure for h0 and G0. The system is calibrated with a series of Newtonian silicone oils from 0.1 to 100 P (1 P ¼ 0.1 Pa s). For a ball oscillating in a viscoelastic medium, the viscous and elastic moduli, when inertia is negligible, are defined as
h0 |
¼ |
|
|
Fosinf |
ð11Þ |
||
6p K R v Xo |
|||||||
and |
|
|
|
|
|
|
|
G0 |
¼ |
|
Focosf |
|
ð12Þ |
||
6p K R Xo |
|||||||
where Fo is the magnitude of the oscillating magnetic force, v is the angular frequency of oscillation (v ¼ 2pf), and Xo is the amplitude of the ball displacement.
The viscoelastic properties of blood have been characterized using the instruments described above in an oscillatory mode. However, these viscoelastic data, although useful as a tool for comparing different blood types and diseases, are not widely used because they are difficult to relate to the mechanical properties of the blood cells. For a non Newtonian fluid, the apparent viscosity (i.e., the slope of the curve of shear stress vs. shear rate at a particular
f
DC
|
AC |
|
g |
i |
h |
i |
b |
|
|
|
a |
 h
h
c
e
d
Figure 9. The magneto-acoustic ball microrheometer. (a) sample chamber, (b) stainless steel ball, (c) ultrasound crystal, (d) ultrasound transducer, (e) water jacket, (f) electromagnet, (g) electromagnet bath cap, (h) water flow outlet, (i) water flow inlet.
value of shear rate) is used instead of viscosity since the latter is no longer a constant value and will depend on the rate and extent of deformation.
Techniques for Measuring the Rheological Properties of Blood Cells
Micropipette. The most popular technique for measuring the mechanical properties of blood cells is the micropipette technique (35). The micropipette manipulation technique has been used for studying liquid drops, cells, and aggregates. It has been used to investigate the effects of diseases (36,37) as well as treatments (38,39).
Micropipettes are made from 1mm capillary-glass tubing pulled to a fine point by quick fracture to give an orifice of desired diameter with a square end. The micropipette technique has been extensively used to characterize the mechanical properties of the RBC, but its use is limited in
A
Lp
B
L
Li
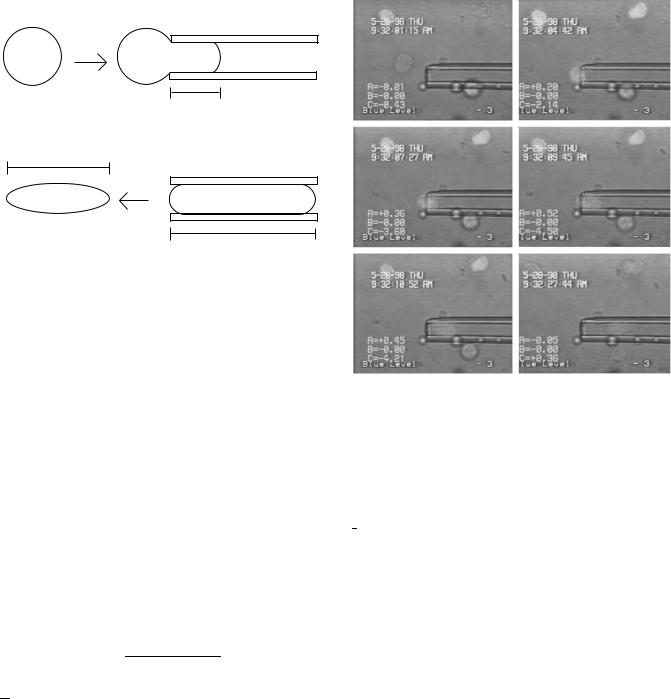
Figure 10. Schematic of the micropipette technique. Two micropipette experiments for determining cell viscosity and surface tension are depicted. (a) Aspiration experiment; for a given aspiration pressure, the length of the aspirated cell, Lp, is tracked as a function of time. (b) Recovery experiment; a cell fully aspirated inside a pipette is expelled from it. The length of the cell, L, is recorded as a function of time.
practice by the complexity of the theory associated with the biconcave shape of the cell. As an example of the micropipette technique, work on the characterization of WBCs will be presented below. The theoretical work is simplified because the shape of a WBC can be treated as a sphere. An equivalent simulation for a RBC will require extensive numerical work. Two typical types of experiment, aspiration and recovery (Fig. 10), are usually performed to determine the mechanical properties of individual WBCs (40–43).
Aspiration. Passive leukocytes (WBCs) are aspirated at a constant pressure into a micropipette. The length of the aspirated cell, Lp, is measured over time to generate an aspiration curve (Fig. 10a). Viscosity values, m, can be derived from the slope, dLp/dt, of the aspiration curves (42):
m |
¼ |
ðDPÞRp |
ð |
13 |
Þ |
|||
ðdLp=dtÞmð1 |
1 |
Þ |
||||||
|
|
|||||||
|
|
|
||||||
|
R |
|
||||||
where DP is the aspiration pressure, Rp is the pipet radius, R ¼ R/Rp, R is the radius of the cell outside the pipette, and m ¼ 6. Figure 11 shows the aspiration of a white blood cell (lymphocyte) into a 4 mm diameter pipette. Fluorescence is used to better see the deformation of the cell nucleus.
Recovery. White blood cells are drawn by a small suction pressure into a micropipette, held there for 15 s, and quickly expelled out. The changing length of the cell, L, as it recovers its spherical shape (Fig. 10b), is recorded as a function of time, t, and is described by a polynomial (43):
L |
|
Li |
|
|
|
|
|
2 |
|
|
|
3 |
|
|
¼ |
þ At þ BðtÞ |
þ CðtÞ |
ð14Þ |
|||||||||||
Do |
Do |
|
|
|||||||||||
BLOOD RHEOLOGY |
507 |
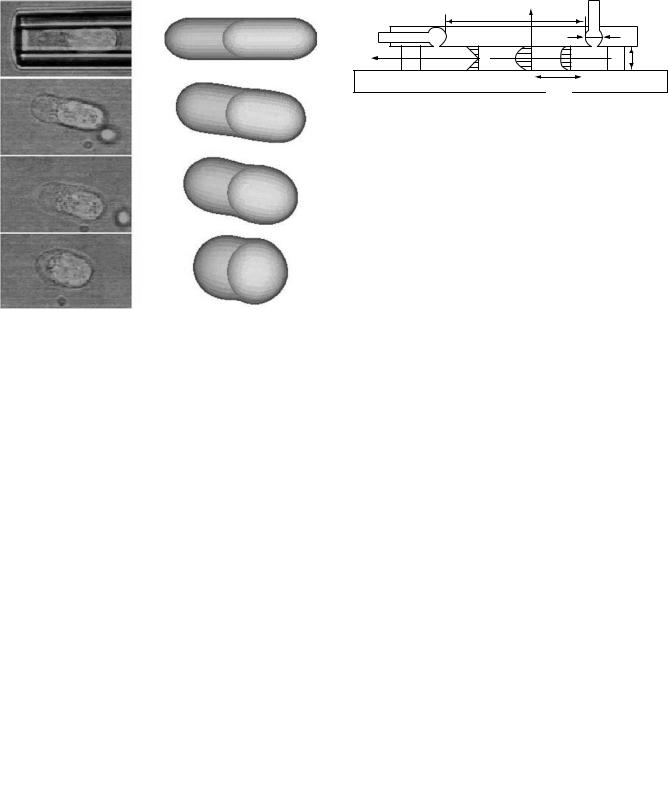
Figure 11. Flow of a lymphocyte inside a 4 mm pipette. The
flow of an 8 mm lymphocyte (a WBC) inside a 4 mm diameter micropipette as a function of time is shown. Fluorescent technique was used to track the cell nucleus as well as the cellular membrane.
where A, B, C are known functions of (Li/Do). The parameters Li and Do are the initial deformed length and resting diameter of the cell, respectively. The variable t ¼ 2t/[(m/To)Do] represents a dimensionless time, where m is the cell viscosity, and To is the surface tension of the membrane.
Figure 12 shows a lymphocyte (about 8 mm in diameter) aspirated inside a 4 mm diameter pipette (top picture). The cell is then expelled from the pipette and recovers its initial shape (bottom, left-hand side pictures). Pictures generated on the right hand side are from numerical simulation (44). In addition to the experimental techniques, significant progress has been made in the computational capabilities to simulate the dynamic behavior of blood at both large vessel and cellular scales (45).
Rheoscope
To allow direct observation of suspended cells during shear stress application, a modified cone-plate viscometer, called a rheoscope (Fig. 13), has been developed (46). In which the cone and plate counterrotate. This gives the advantage that a particle midway between the cone and plate is subjected to a well-defined shear stress field and remains nearly stationary in the laboratory frame of reference so that it can be studied without the help of high speed cinematography. It is important to note that, for an identical speed of rotation, that the shear rate generated in the rheoscope is twice that in the
508 BLOOD RHEOLOGY
Figure 12. Pictures of a lymphocyte inside a pipette and its recovery. The top left frame is a picture of a lymphocyte (a type of leukocyte) aspirated inside a micropipette, the frames below it show the cell recovering its initial shape. Pictures on the right hand side are those generated by a theoretical compound drop model (44).
Figure 13. The Rheoscope. The main feature of this instrument is the counterrotation of the cone and plate. This gives the advantage that a particle midway between the cone and plate, subjected to a well-defined shear stress can be studied without the help of high speed cinematography. At a distance r from the axis of rotation, the shear rate is equal to g ¼ 2rv=d, where d is the local gap width and v is the angular velocity of the cone and plate
Y
L
2R
X |
γ |
V |
|
|
h |
Le
Figure 14. Parallel-Plate Flow Channel. The velocity profile is parabolic, and the shear rate is linear with y. Parameters are as follows: velocity field, Vx ¼ Vx (y), Vy ¼ 0, Vz ¼ 0; shear rate, g ¼ ð@Vx=@yÞ; lines of shear, straight lines parallel to the channel axis; shearing surfaces, plane surfaces parallel to the channel axis.
conventional cone-plate viscometer because of the counter rotation of the cone and plate. Effects of shear and mechanical properties of individual cells and anchorage dependent cells have been determined with the rheoscope (e.g., 1,36,47–49). The rheoscope is popular for studying RBC under shear because the analysis of the behavior of RBC is simplified since its shape is an ellipsoid.
Parallel Plate Flow Channel. Another popular technique for characterizing the rheological properties of blood cells under flow or for studying the effects of shear stress on anchorage dependent cells is the parallel plate flow system (Fig. 14).
The flow between infinite parallel plates is often referred to as plane Poiseuille flow. The velocity field reduces to one component in the direction of flow, Vx,
Vx ¼ |
h2DP |
" |
2y |
|
2# |
|
8 mL |
1 |
|
h |
ð15Þ |
||
where h is the distance between the plates, m is the fluid viscosity, DP is the pressure drop between the inlet and outlet located at a distance L apart, and y is the vertical distance from the origin taken at the centerline of the channel.
The relationship between the pressure drop and volu-
metric flow rate Q is |
|
|
DP ¼ |
12 mQL |
ð16Þ |
|
||
wh3 |
where w is the channel width.
From the velocity field, Eq. 5, the shear rate across the
channel gap is readily derived: |
|
||||
˙ |
dVx |
|
12 Q |
|
|
g ¼ |
|
¼ |
|
y |
ð17Þ |
dy |
wh3 |
||||
For a Newtonian fluid, the relationship between shear rate and shear stress, t, is linear, and the shear stress
across the flow channel gap is |
|
|
|
˙ |
12 mQ |
y |
ð18Þ |
t ¼ mg ¼ |
|
||
wh3 |
|||
From the above equation, the shear stress is zero along the channel centerline, and the maximum shear stress, ts,
is at the surface of the plate |
|
|
|
|
||
ts ¼ |
hDP |
¼ |
6 mQ |
ð19Þ |
||
|
|
|
|
|||
2L |
|
wh2 |
||||
Vote stressed that, although they allow direct observation of individual particles, these devices do not provide a direct measurement of the particle viscosity. It is necessary to know the material constitutive properties of the particles, that is, expressions that relate stresses to strains, or to develop a mathematical model in order to determine the mechanical properties of the particles. Existing models can describe fairly accurately the rheological behavior of blood cells, but the exact rheological property values of these cells, with the exemption of red blood cells, are not known. That topic will not be covered here. For a review on the mechanical properties of blood cells, the reader is referred to Waugh and Hochmuth (35), and for a discussion on the discrepancy between the rheological data on white blood cells reported in the literature to Kan et al. (44).
CONCLUSION
Some of the major advances in blood rheology are now being linked to the development and application of microfabrication to medicine. As reviewed by Voldman et al. (50) and Shyy et al. (51), these new tools will be used to better characterize the rheological properties of blood and blood cells, as well as to detect and diagnose cardiovascular and blood related diseases. Microfabrication is a process used to construct objects with dimensions in the micrometer to millimeter range. These objects are composed of miniature structures that can include moving parts such as cantilevers.
Soft lithography is a tool for micro/nanofabrication. It provides a convenient and effective method for the formation and manufacturing of microand nanostructures. Soft
BLOOD RHEOLOGY |
509 |
lithography is the collective name for a set of techniques that include replica molding, microcontact printing, microtransfer molding (52). The major advantages of soft lithography are that it is very fast as compared to conventional methods, relatively inexpensive, and applicable to almost all polymers. It is possible to go from design to production of replicated structures in < 24 h. In soft lithography, a master mold is first made by a lithographic technique, and an elastomeric stamp is then cast using the master mold. The elastomeric stamp with patterned relief structures on its surface is used to generate patterns and structures with feature sizes as small as 30 nm (53). Polydimethylsiloxane (PDMS) is the polymer of choice for many biological applications because it is optically transparent, isotropic, homogeneous, durable, and has interfacial properties that are easy to modify (53,54). As opposed to photolithography, soft lithography provides a mean for producing nonplanar surfaces.
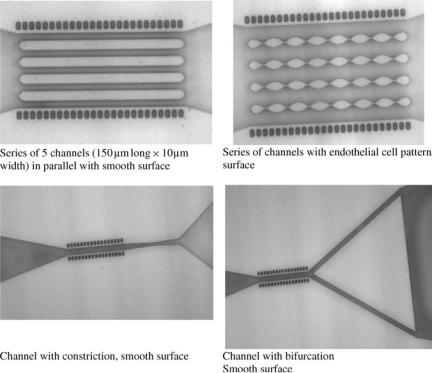
Microfabricated devices, also known as microelectromechanical systems (MEMS), are ideal tools for studying specific biological phenomena, for example, cell adhesion, as well as biological systems such as the microcirculation. For example, the fabrication of in vitro blood vessels can help to (1) determine blood cell distributions during blood flows through both arterial and venous type bifurcations, with successive bifurcations arranged as in microcirculation; (2) validate computer simulations and experimental methods used for in vivo measurements of parameters such as blood average velocity and hematocrits; and (3) to separate vessel or wall effects from hemodynamics effects. Figure 15 shows channels that were created using soft lithography. The different configurations shown are a series of 10 mm diameter channel in parallel, a series of
Figure 15. Photographs of microfabricated channels. The dashed lines on the top and bottom of the channels are length scales and each line represents 100 mm. Channels were created with inner diameters ranging from 5 to 100 mm.
510 BLOOD RHEOLOGY
channels with an endothelial cell like pattern surface, a channel with a constriction, and a channel with a bifurcation.
The application of MEMS in the area of microfluidics is a new and emerging field. It includes the development of miniature devices in fluid control, fluid measurement, and medical testing. Because of our need and interest in understanding, preventing, and treating diseases, most of the emerging MEMS applications are expected to be in biomicrofluidics. One of these applications is the development of gene chips and related deoxyribonucleic acid (DNA) tools. Others applications include microscale chemical analysis, known as microelectrophoresis, blood chemistry measurements using micromachined thin-film sensor, micropumps, drug delivery systems, glucose sensors, and chip-based microflow cytometry devices.
The major advantages of MEMS-based devices are that they are smaller and have the potential to be less expensive, more durable, and more reliable than conventional techniques. In addition, they can perform chemical tests much faster.
Finally, another area that will benefit from the advancement of technology is the development of blood substitutes. This is a needed area since the demand for blood continues to outpace the supply, especially in developing countries. With new technologies, the life span of blood substitutes based on cell-free hemoglobin, which is presently too short, could be lengthened. New methods could also be developed in order to produce human red cells, and other cell types, in culture.
Needless to say that, in order to be successful, all these new technical advances will need to be combined with an improved understanding of cell biology and rheology. This advancement will also depend on the successful incorporation of more sophisticated mathematical and computational techniques. In general, the field of biorheology is moving towards better understanding phenomena at the molecular level. For example, the knowledge of the signal transduction pathways associated with the responses of cells to deformation is essential in the field of tissue engineering, where mechanical environment during growth can affect cell response and the material properties of the tissue construct or living implant.
It is clear that blood rheology plays a major role in the maintenance of the human body and in the development of artificial organs and other medical devices, but our understanding, of that role and of the clinical implications of having an altered blood rheology, is far from being complete.
BIBLIOGRAPHY
Cited References
1.Chien S. Red Cell Deformability and its Relevance to Blood Flow. Ann Rev Physiol 1987;49:177–192.
2.Cokelet GR, et al. The rheology of human human blood measurement near and at zero shear rate. Trans Soc Rheol 1963;7:303–317.
3.Chien S, Usami S, Dellenbeck RJ, Gregersen M. Shear dependent deformation of erythrocytes in rheology of human blood. Am J Physiol 1970; 219:136–142.
4.Sutera SP. The history of Poiseuille’s law. Ann Rev Fluid Mech 1993;25:1–19.
5.White GC, Montgomery RR. Clinical aspects of and therapy for von Willebrand disease. In: Hoffman R, et al., editors. Hematology: Basic principles and practice. 3rd ed. New York: Churchill Livingstone Inc.; 2000. 1946–1958.
6.Curry H. Bleeding Disorder Basics. Ped Nursing 2004;30(5): 402–404 and 428–429.
7.Hafezi-Moghadam A, Thomas KL, Cornelssen C. A novel mouse-driven ex vivo flow chamber for the study of leukocyte and platelet function. Am J Phys Cell Physiol 2004;286: C876–C892.
8.Sakakibara M, et al. Applicaion of ex vivo flow chamber system for assessment of stent thrombosis. Arterioscler Thromb Vasc Biol 2002;22(8):1360–1364.
9.Zimmer R, Steegers A, Paul R, Affeld K, Reul H. Velocities, shear stresses and blood damage potential of the leakage jets of the Medtronic Parallel bileaflet valve. Int J Artif Organs 2000;23(1):41–48.
10.Komorowicz E, Kolev K, Lerant I, Machovich R. Flow ratemodulated dissolution of fibrin with clot-embedded and circulating proteases. Circ Res 1998;82:1102–1108.
11.Blinc A, et al. Flow through clots determine rate and pattern of fibrinolysis. Thromb Haemost 1994;71:230–235.
12.Driessen GK, et al. Effect of reduced red cell ‘‘deformability’’ on flow velocity in capillaries of rat mesentery. Pflu¨ gers Arch 1980;388:75–78.
13.Schmalzer EM, Manning RS, Chien S. Filtration of sickle cells: recruitment into a rigid fraction as a function of density and oxygen tension. J Lab Clin Med 1989. 113:727–734.
14.Schmid-Schonbein H, Volger E. Red-cell aggregation and red-cell deformability in diabetes. Diabetes 1976;25(Suppl. 2): 897–902.
15.Schrier SL, Rachmilewitz E, Mohandas N. Cellular and membrane properties of alpha and beta thalassemic erythrocytes are different: implications for differences in clinical manifestations. Blood 1989;74:2194–2202.
16.Reinhart WH, Chien S. Roles of cell geometry and cellular viscosity in red cell passage through narrow pores. Am J Physiol 1985;248(Cell Physiol. 17):C473–C479.
17.Secomb TW, Hsu R. Motion of red blood cells in capillaries with variable cross-sections. J Biomech Eng 1996;118:538–544.
18.Lipowsky HH, Cram LE, Justice W, Eppihimer M. Effect of erythrocyte deformability on in vivo red cell transit time and hematocrit and their correlation with in vitro filterability. Microvasc Res 1993;46:43–64.
19.Reid HL, Barnes AJ, Lock PJ, Dormandy JA, Dormandy TL. A simple method for measuring erythrocyte deformability. J Clin Pathol 1976;29(9):855–858.
20.Dodds AJ. et al. Haemorheological response to plasma exchange in Raynaud’s syndrome. Br Med J 1979. 1186–1187,
21.Boyden S. The chemotactic effect of mixtures of antibody and antigen on polymorphonuclear leucocytes. J Exp Med 1962; 115:453–466.
22.Zigmond SH, Hirsch JG. Leukocyte locomotion and chemotaxis. New methods for evaluation, and demonstration of a cellderived chemotactic factor. J Exp Med 1973;137:387–410.
23.Bessis M, Mohandas N, A diffractometric method for the measurement of cellular deformability. Blood Cells 1975;1: 307–313.
24.Bull B, Feo C, Bessis M, Behavior of elliptocytes under shear stress in the rheoscope and the ektacytometer. Cytometry 1983;3:300–304.
25.Bareford D, et al. Erythrocyte deformability in peripheral occlusive arterial disease. J Clin Pathol 1985;38:135–139.
26.Erythrocyte deformability in peripheral occlusive arterial disease. J Clin Pathol 1985;38:135–139.
27.Yip R, et al. Red cell membrane stiffness in iron deficiency. Blood 1983;62:99–106.