

individual patients’ conditions and surgical procedures, relieving anesthesiologists from stressful and strenuous routine tasks to concentrate on higher level decisions in patient care.
Patient physiological conditions can be more accurately and objectively measured by computer-processed sensor and imaging information.
Computer-added imaging processing will make it possible to consolidate information from CT-Scan (Computed Tomography), TEE (Transesophageal Echocardiography), MRI (Magnetic Resonance Imaging), and fMRI (Functional Magnetic Resonance Imaging) into regular anesthesia monitoring.
Anesthesia decisions will be assisted by computer database systems and diagnosis functions.
Anesthesia monitoring devices will become wireless, eliminating the typical spaghetti conditions of monitoring cables in operating rooms.
Anesthesia information systems will become highly connected and standard in anesthesia services, automating and streamlining the total patient care system: From patient admission to patient discharge, as well as follow-up services.
BIBLIOGRAPHY
Cited References
1.Penelope M, et al. Advanced patient monitoring displays: tools for continuous informing. Anesthes Analges 2005;101: 161–168.
2.Bonhomme V, et al. Auditory steady-state response and bispectral index for assessing level of consciousness during propofol sedation and hypnosis. Intravenous Anesthes 2000; 91:1398–1403.
3.Drummond JC. Monitoring depth of anesthesia. Anesthesiology 2000;93(3):876–882.
4.Blike GT. Human factors engineering: It’s all about ‘usability’. ASA Newslett Oct. 2004;68.
5.Peteani LA. Enhancing clinical practice and education with high-fidelity human patient simulators. Nurse Educ 2004; 29(1):25–30.
6.Stephen W, et al. Case report of remote anesthetic monitoring using telemedicine. Anesthes Analges 2004;98:386–388.
7.Wong DT, et al. Preadmission anesthesia consultation using telemedicine technology: A pilot study. Anesthesiology June 2004;100(6):1605–1607.
8.Wang LY, Yin G, Wang H. Identification of Wiener models with anesthesia applications. Int J Pure Appl Math Sci 2004; 35–61.
9.Shafer A, Doze VA, Shafer SL, White PF. Pharmacokinetics and pharmacodynamics of propofol infusions during general anesthesia. Anesthesiology 1988;69:348–356.
10.Eisenach JC. Reports of scientific meetings-workshop on safe feedback control of anesthetic drug delivery. Anesthesiology August 1999;91:600–601.
11.Linkens DA, Hacisalihzade SS. Computer control systems and pharmacological drug administration: A survey. J Med Eng Technol 1990;14(2):41–54.
12.Mortier EM, et al. Closed-loop controlled administration of Propofol using bispectral analysis. Anaesthesia 1998;53: 749–754.
ANGER CAMERA |
51 |
13.Rao RR, et al. Automaded regulation of hemodynamic variables. IEEE Eng Med Biol Mag 2001;20:24–38.
14.Tackley RM, et al. Computer controlled infusion of propofol. Br J Anesthes 1989;62:46–53.
15.Beatty PT, et al. User attitudes to computer-based decision support In anesthesia and critical care: A preliminary survey. Internet J Anesthesiol 1999;3(1).
See also ANESTHESIA MACHINES; CARDIAC OUTPUT, THERMODILUTION MEASUREMENT OF; ELECTROCARDIOGRAPHY, COMPUTERS IN; ELECTROENCEPHALOGRAPHY; MEDICAL RECORDS, COMPUTERS IN; MONITORING IN ANESTHESIA.
ANGER CAMERA
MARK T. MADSEN
University of Iowa
INTRODUCTION
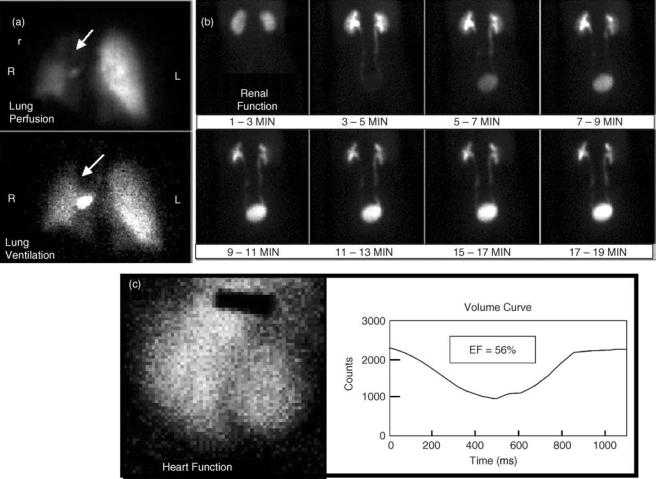
In nuclear medicine, radioactive tracers are used to provide diagnostic information for a wide range of medical indications. Gamma-ray emitting radionuclides are nearly ideal tracers, because they can be administered in small quantities and yet can still be externally detected. When the radionuclides are attached to diagnostically useful compounds (1), the internal distribution of these compounds provides crucial information about organ function and physiology that is not available from other imaging modalities. The Anger camera provides the means for generating images of the radiopharmaceuticals within the body. Example images of some common studies are shown in Figs. 1 and 2.
Initially, nonimaging detectors were used to monitor the presence or absence of the radiotracer. However, it was clear that mapping the internal distribution of the radiotracers would provide additional diagnostic information. In 1950, Benedict Cassen introduced the rectilinear scanner. The rectilinear scanner generated images of radionuclide distributions by moving a collimated sodium iodide detector over the patient in a rectilinear fashion. The detected count rate modulated the intensity of a masked light bulb that scanned a film in an associated rectilinear pattern. While this device did produce images, it was very slow and had no capability for imaging rapidly changing distributions. The rectilinear scanner was used into the 1970s, but was finally supplanted by the Anger camera (2–5).
The Anger camera, also referred to as the scintillation camera (or gamma camera), is a radionuclide imaging device that was invented by Hal O. Anger. It is the predominant imaging system in nuclear medicine and is responsible for the growth and wide applicability of nuclear medicine. Anger was born in 1920. He received his BS degree in electric engineering from the University of California at Berkeley in 1943 and in 1946 he began working at the Donner Laboratories, where he developed a large number of innovative detectors and imaging devices including the scintillation well counter and a whole body rectilinear scanner using 10 individual sodium iodide probes. In 1957, he completed his first gamma
52 ANGER CAMERA
Figure 1. Anger camera clinical images. A. Lung ventilation and perfusion images are used to diagnose pulmonary emboli. B. Renal function images are used to diagnose a variety of problems including renal hypertension and obstruction. C. Gated blood pool studies permit evaluation of heart wall motion and ejection fraction.
imaging camera that he called a scintillation camera and is often referred to as the Anger camera (6). Anger’s scintillation camera established the basic design that is still in use today. The first Anger camera had a 10 cm circular field of view, seven photomultiplier tubes, pinhole collimation, and could only be oriented in one direction. A picture of this initial scintillation camera is shown in Fig. 3 and a schematic drawing of the electronics is shown in Fig. 4. In 1959, Anger adapted the scintillation camera for imaging positron emitting radionuclides without collimation using coincidence between the camera and a sodium iodide detector. He also continued improving the scintillation camera for conventional gamma emitting radionuclides. By 1963, he had a system with a 28 cm field of view and 19 photomultiplier tubes (7). This device became commercialized as the nuclear Chicago scintillation camera. Throughout the 1960s, 1970s, and 1980s Anger remained active at Donner labs developing numerous other radionuclide imaging devices. He has received many prestigious awards including the John Scott Award (1964), a Guggenheim fellowship (1966), an honorary Doctor of Science degree from Ohio State University (1972), the Society of Nuclear
Medicine Nuclear Pioneer Citation (1974), and the Society of Nuclear Medicine Benedict Cassen Award (1994) (8–10).
About the same time that the Anger camera was introduced, the molybdenum-99/technetium-99m radionuclide generator became available. This finding is mentioned
because the advantages offered by this convenient source of 99mTc had a large influence on the development of the
Anger camera. Technetium-99m emits a single gamma ray at 140 keV, has a 6 h half-life and can be attached to a large number of diagnostically useful compounds. Because it is
available from a generator, it also has a long shelf life. The 99mTc is used in > 80% of nuclear medicine imaging stu-
dies. As a result, both the collimation and detector design of the Anger camera has been optimized to perform well at 140 keV (1).
SYSTEM DESCRIPTION
The Anger camera is a position sensitive gamma-ray imaging device with a large field of view. It uses one
ANGER CAMERA |
53 |
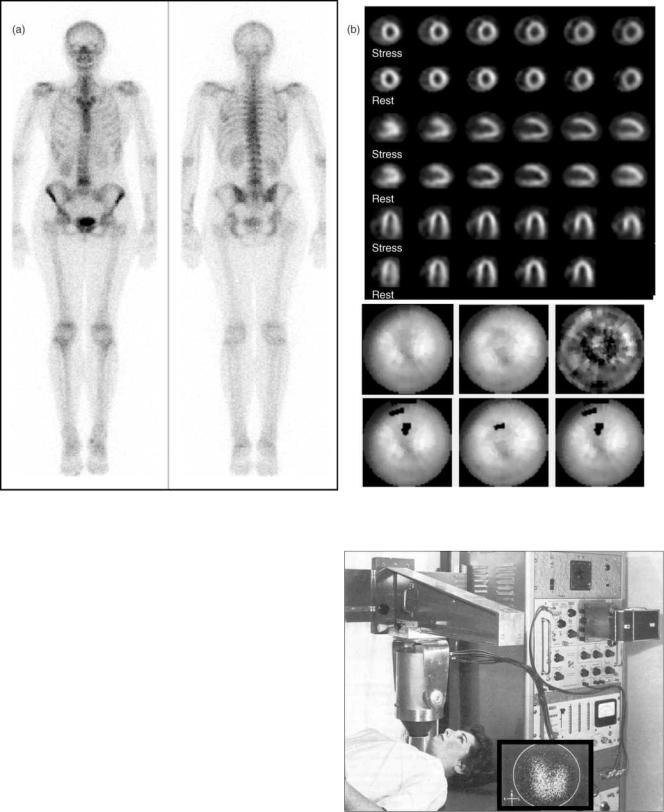
Figure 2. Anger camera clinical images. A. Bone scans are used to evaluate trauma and metastatic spread of cancer. B. Myocardial perfusion studies are used to evaluate coronary artery disease.
large, thin sodium iodide crystal for absorbing gamma-ray energy and converting that into visible light. The light signal is sampled by an array of photomultilier tubes that convert the light signal into an electronic pulse. The pulses from individual PMTs are combined in two ways. An energy pulse is derived from the simple summation of the PMT signals. The X and Y locations of the event are calculated from the sum of the PMT signals after positiondependent weighting factors have been applied. When a signal from a detected event falls within a preselected energy range, the X and Y locations are recorded in either list or frame modes. The components that make up the Anger camera are shown in Fig. 5 and are described in detail in the following section (11,12).
Sodium Iodide Crystal
Sodium iodide activated with thallium, NaI(Tl), is the detecting material used throughout nuclear medicine. Sodium iodide is a scintillator giving off visible light when it absorbs X- or gamma-ray energy. At room temperature, pure NaI has very low light emission, however, when small amounts (parts per million, ppm) of thallium are added, the
Figure 3. Initial Anger camera used to image a patient’s thyroid with I-131. The field of view of this device was 10 cm. (Reprinted from Seminars in Nuclear Medicine, Vol 9, Powell MR, H.O. Anger and his work at Donner Laboratory, 164–168., 1979, with permission from Elsevier.)
54 ANGER CAMERA
|
|
|
Y + |
|
|
|
|
|
Multiplier phototubes |
20 |
40 |
20 |
40 |
20 |
|
|
|
|
|
|
|
|||||
|
10 |
|
|
|
|
10 |
|
|
|
|
|
|
|
|
|
|
|
Sodium iodide |
30 |
|
6 |
|
1 |
30 |
|
|
crystal |
|
|
|
|
|
20 |
|
|
X – |
|
|
|
|
|
X |
+ |
|
|
5 |
|
7 |
|
2 |
|||
|
40 |
|
|
|
|
|||
|
|
|
|
40 |
|
|
||
Y direction |
20 |
|
4 |
|
3 |
|
|
|
|
|
|
|
|
|
|||
|
30 |
|
|
|
|
30 |
|
|
X direction |
|
|
|
|
|
|
|
|
|
10 |
|
|
|
|
10 |
|
|
|
|
|
|
|
|
|
|
|
|
|
20 |
40 |
20 |
40 |
20 |
|
|
|
|
|
Y – |
|
Capacitances in pF |
|
|
|
X – |
X + |
Y – |
Y + |
|
|
X – X + |
Y – Y + |
|
Difference |
Difference |
|
|
Addition |
|
|||
circuit |
|
circuit |
|
|
circuit |
|
||
X |
|
Y |
|
|
|
Z |
|
|
Pulse-height
selector
|
Z input |
|
X input |
Image-readout |
|
oscilloscope |
||
Y input |
||
|
Figure 4. Electronic schematic for Anger’s first scintillation camera. The photomultiplier tube position weighting was accomplished with a capacitor network. (From Instrumentation in Nuclear Medicine, Hine and Sorenson, Elsevier, 1967.)
efficiency for light emission is greatly enhanced. This is an especially important aspect for its application in the Anger camera since the light signal is used to determine both the energy and location of the gamma-ray interaction with the detector. In addition to its high light ouput, NaI(Tl) has several other desirable properties. It has a relatively high effective atomic number (Zeff ¼ 50) and the density is 3.67 g cm 3. This results in a high detection efficiency for gamma rays under 200 keV with relatively thin crystals (8,12–15).
Sodium iodide is grown as a crystal in large ingots at high temperatures (> 650 8C). The crystals are cut, polished, and trimmed to the required size. For Anger cameras, the crystals are typically 40 55 cm and 9.5 mm thick. Because NaI(Tl) absorbs moisture from the air (hygroscopic), it must be hermetically sealed. Any compromise of this seal often results in the yellowing of the crystal and its irreversible destruction.
In addition to the need to keep the crystal hermetically sealed, the temperature of the detector must be kept relatively constant. Temperature changes > 2 8C h 1 will often shatter the detector.
Figure 5. Anger camera components.
Light Pipe
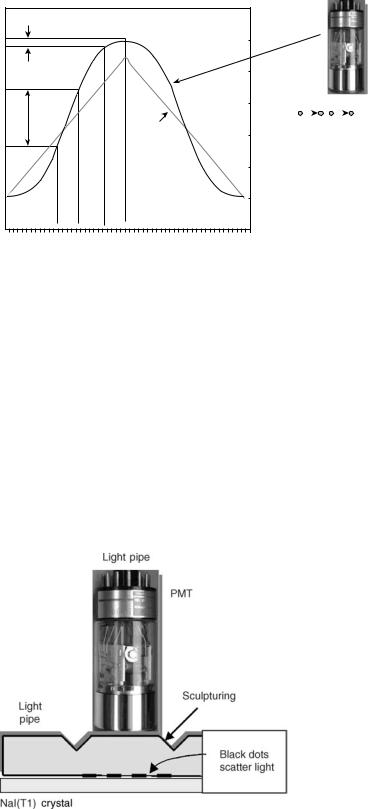
The scintillation light generated in the crystal is turned into electronic signals by an array of photomultiplier tubes (PMTs). These signals provide both event energy and localization information. It is desirable that the magnitude of the signal from the photomultiplier tube be linearly related to the event location as shown in Fig. 6. However, when the PMTs are in close proximity to the crystal, the relationship between the signal magnitude and the event location is very nonlinear. In early designs of the Anger camera, a thick transparent material referred to as a light pipe was coupled to the crystals to improve spatial linearity and uniformity. Glass, lucite, and quartz have been used for this purpose. Design enhancement of the light pipe included sculptured contouring to improve light collection and scattering patterns at the PMT interface to reduce positional nonlinearities (Fig. 7). In the past decade, many of the spatial nonlinearities have been corrected algorithmically operating on digitized PMT signals. This has allowed manufacturers to either reduce the thickness of the light pipe or completely eliminate it (2,16,17).
PMT Array
The visible light generated by the absorption of a gamma ray in the NaI(Tl) crystal carries location and energy information. The intensity of the scintillation is directly proportional to the energy absorbed in the event. To use this information, the scintillation must be converted into an electronic signal. This is accomplished by photomultiplier tubes. In a PMT, the scintillation light liberates electrons at the photocathode and these electrons are amplified through a series of dynodes. The overall gain available from a photomultiplier tube is on the order 106.
Photomultiplier tubes are manufactured in a wide variety of shapes and sizes. Those with circular, hexagonal, and square photocathodes have all been used in Anger cameras. Hexagonal and square PMTs offer some advantages for
Source location with a PMT
|
|
|
Actual |
|
|
|
response |
output |
|
|
|
PMT |
|
|
Ideal |
|
|
response |
|
|
|
|
|
A |
B |
C |
D |
Source location
|
|
|
|
|
ANGER CAMERA |
55 |
|
|
|
|
|
|
|
|
|
|
|
|
|
|
|
|
|
|
|
|
|
A B C D
Figure 6. Photomultiplier tube response with source position. The ideal response can be approximated by interposing a light pipe between the crystal and photomultiplier tube.
close packing the PMTs over the surface of the detector. However, the sensitivity of all PMTs falls off near the edge of the field, so that ‘‘dead’’ space between the PMTs is unavoidable.
It is important to determine the energy of the detected event. Gamma rays that are totally absorbed produce a scintillation signal that is directly proportional to the gamma-ray energy. Thus, the signal resulting from the unweighted sum of the PMTs represents gamma-ray energy. This signal is sent to a pulse height analyzer. Scattered radiation from within the patient can be rejected by setting an energy window to select events that have resulted from the total absorption of the primary gamma ray. Gamma rays that have been scattered in the patient necessarily lose energy and are (largely) not included.
The position of the gamma-ray event on the detector is determined by summing weighted signals from the PMTs (2,6,7,12,16,18,19). Each PMT contributes to four signals:
Figure 7. The light pipe is a transparent light conductor between the crystal and the photomultiplier tubes. The sculpturing grooves and black dot pattern spread the light to improve the positioning response of the photomultiplier tube.
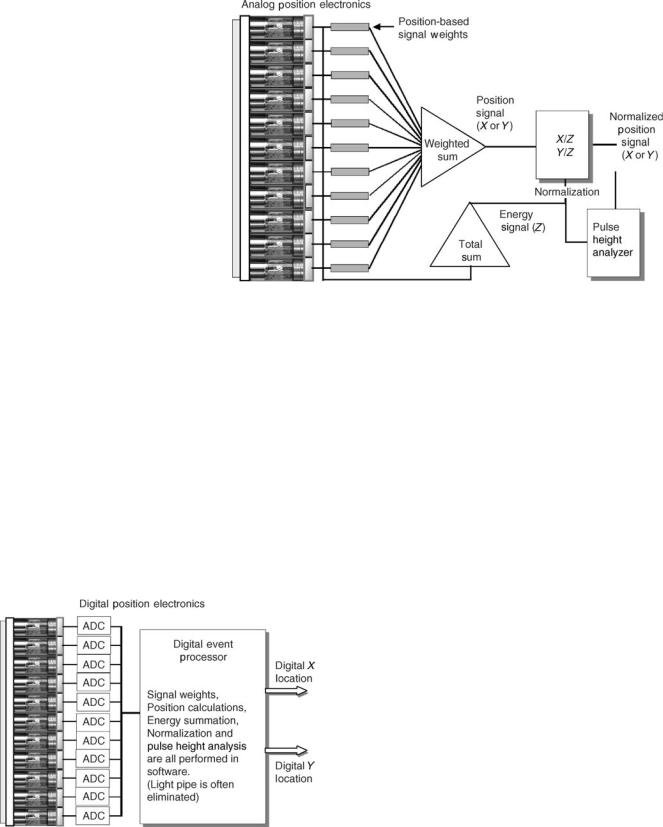
Xþ, X , Yþ, Y . The magnitude of the contribution is determined both by the amount of light collected by the PMT and its weighting factor. For the tube located exactly at the center of the detector, the four weighting factors are equal. A tube located along the x axis on the left side (e.g., tube 5 in Fig. 4) contributes equally to Yþ and Y , has a large contribution to X , and a smallcontribution toXþ. In Anger’s originaldesign, the weighting factors were provided by capacitors with different levels of capacitance (Fig. 4). In commercial units, the capacitor network was replaced by resistors (Fig. 8). In the past decades, the resistor weighting matrix has been largely supplanted by digital processing where nonlinear weighting factors can be assigned in software (Fig. 9).
It is clear that PMTs located near the event collect most of the scintillation light while those far away get relatively little. Because each PMT has an unavoidable noise component, the PMTs that receive the least light increase the error associated with the event localization. Initially, all the PMTs were included. Later, in order to eliminate PMTs that have little real signal, diodes were used to set current thresholds. In digital Anger cameras, the PMT thresholds are set in software (20–22).
The weighted signals from the PMTs are summed together to generate four position signals: Xþ, X , Yþ, and Y . The X and Y locations are determined from: (Xþ X )/Z and (Yþ Y )/Z, where Z is the energy signal found from the unweighted sum of the PMT signals discussed above. This energy normalization is necessary to remove the size dependence associated with the intensity of the scintillation. This is not only important for imaging radionuclides with different gamma-ray energies, but it also improves the spatial resolution with a single gamma ray energy because of the finite energy resolution of the system. The energy signal is also sent to a pulse height analyzer where an energy window can be selected to include only those events associated with total absorption of the primary gamma.
Image Generation
Anger camera images are generated in the following way (see Fig. 10). A gamma ray is absorbed in the NaI(Tl)
56 ANGER CAMERA
Figure 8. The Anger camera of the 1980s used resistors to provide position weighting factors. The energy signal was used both for normalization and scatter discrimination.
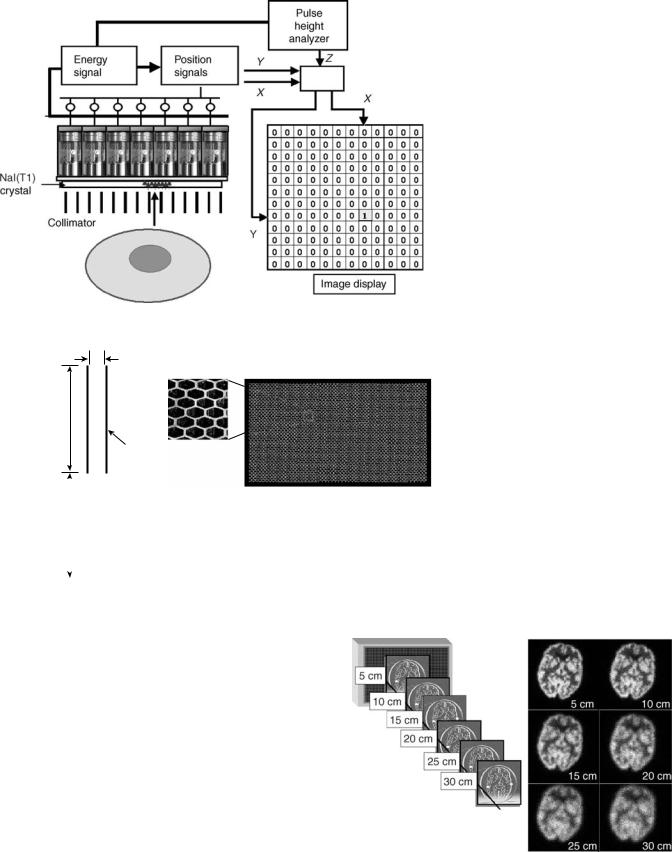
crystal and the resulting scintillation light is sampled by the PMT array to determine the event energy and location. The energy signal is sent to a pulse height analyzer and if the signal falls within the selected energy window, a logic pulse is generated. At the same time, the X and Y coordinates of the event are determined and the logic pulse from the PHA enables the processing of this information. For many years, Anger camera images were generated photographically with the enabled X and Y signals intensifying a dot on a cathode ray tube (CRT) viewed by a camera. In modern Anger cameras, the CRT has been replaced with computer memory and the location information is digital. The X and Y coordinate values, still enabled by the PHA, point to a memory element in a computer matrix. The contents of that memory element are incremented by 1. Information continues to accrue in the computer matrix until the count or time stopping criteria are met.
Figure 9. Digital Anger camera electronics. The photomultiplier tube signals are digitized so that signal weighting, energy and position determination are performed in software rather than with digital electronics.
The image generation described in the previous paragraph is referred to as frame or matrix mode. The information can also be stored in list mode where the X and Y coordinate of each event is stored sequentially along with a time marker. The list mode data can then be reconstructed at a later time to any desired time or spatial resolution.
Collimation
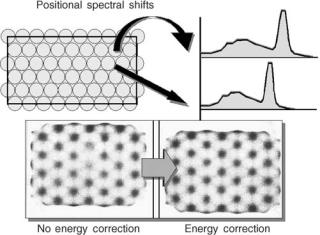
In order to produce an image of a radionuclide distribution, it has to be projected onto the detector. In a conventional camera, image projection is accomplished by the camera lens. However, gamma rays are too energetic to be focused with optics or other materials. The first solution to projecting gamma-ray images was the pinhole collimator. The pinhole collimator on an Anger camera is conceptually identical to a conventional pinhole camera. There is an inversion of the object and the image is magnified or minified depending on the ratio of the pinhole to detector distance and the object to pinhole distance. Pinhole collimators are typically constructed out of tungsten and require lead shielding around the ‘‘cone’’. Because the amount of magnification depends on the source to pinhole distance, pinhole images of large, three-dimensional (3D) distributions are often distorted. In addition, the count sensitivity falls off rapidly for off-axis activity. A better solution for most imaging situations is a multiholed parallel collimator (Fig. 11). As the name implies, the parallel collimator consists of a large number of holes with (typically) lead septae. Most parallel collimators have hexagonal holes that are 1.5 mm across and are 20–30 mm long. The septal walls are typically 0.2 mm thick. The parallel hole collimator produces projections with no magnification by brute force. Gamma rays whose trajectories go through the holes reach the detector while those with trajectories that intersect the septae are absorbed. Less than 1 out of 5000 gamma rays that hit the front surface of the collimator are transmitted through to the detector to form the image (2,7,11,12,20,23,24).
ANGER CAMERA |
57 |
Figure 10. Schematic of Anger camera showing how image information is acquired.
d = 1.5 mm
(hole width)
Parallel hole collimator
L = 25 mm
(hole length)
t = 0.2 mm (septal thickness)
|
|
|
|
Spatial resolution |
|
D |
|
|
RCol = d(D + L)/L |
||
(source to |
|
|
|
|
|
collimator |
|
|
Count efficiency |
|
|
distance) |
|
|
|
||
|
|
e = K2(d/L)2 |
(d/d + t)2 |
||
|
|
|
|
||
|
|
* |
|||
|
|
|
|
||
Figure 11. Collimation. Collimators are the image forming aperture of the Anger Camera, but are also the limiting component in spatial resolution and count sensitivity.
The spatial resolution of the collimator, Rcol, is determined by the hole size (d), hole length (L), and the source to
collimator distance (D): Rcol ¼ d( L þ D)/L. The efficiency of a parallel hole collimator is expressed as K2(d/L)2 (d/d þ t)2,
where K is a shape factor constant equal to 0.26 and t is the septal wall thickness. Collimation design is an optimization problem since alterations in d and L to improve resolution will decrease count sensitivity. Collimator spatial resolution has a strong dependence on the source to collimator distance. As shown in Fig. 12, the spatial resolution rapidly falls with distance. However, the count sensitivity of a parallel hole collimator is not affected by the source distance because the parallel hole geometry removes the divergent rays that are associated with the inverse square loss. Another factor that influences collimator design is the energy of the gamma ray being imaged. Higher energy gamma rays require thicker septae and
Figure 12. Spatial resolution dependence on source to collimator distance.
58 ANGER CAMERA
larger holes resulting in poorer resolution and count sensitivity (2,7,25).
CORRECTIONS
The analog Anger camera had a number of limitations because of nonlinearities in the position signals and because of the uneven light collection over the NaI(Tl) crystal. As digital approaches became viable over the last two decades, a number of corrections to improve energy, spatial, and temporal resolution have evolved. All of these corrections, and particular those involving spatial and energy resolution, require system stability. This challenge was significant because of the variation in PMT output associated with environmental conditions and aging. In order for corrections to be valid over an extended period of time, a method to insure PMT stability has to be implemented. Several different approaches have evolved. In one method, PMT gains are dynamically adjusted to maintain consistent output signals in response to stabilized light emitting diodes (LEDs). An LED is located beneath each PMT where its light is sampled 10–100 times s 1. Gains and offsets on the PMTs are adjusted so that the resulting signal is held close to its reference value. Another approach
uses the ratio of photopeak/Compton plateau counts from a 99mTc or 57Co source as the reference.
Flood Field Image
When the Anger camera is exposed to a uniform flux of gamma rays, the resulting image is called a flood field image. Flood field images are useful for identifying nonuniform count densities and may be acquired in two different ways. An intrinsic flood field is obtained by removing the collimation and placing a point source of activity 1.5–2 m from the detector. An extrinsic flood field is obtained with the collimator in place and with a large, distributed source (often called a flood source) placed directly on the collimator. Flood field sources using 57Co are commercially available. Alternatively, water-filled flood phantoms are available into which 99mTc or other radionuclide can be injected and mixed.
Energy Correction
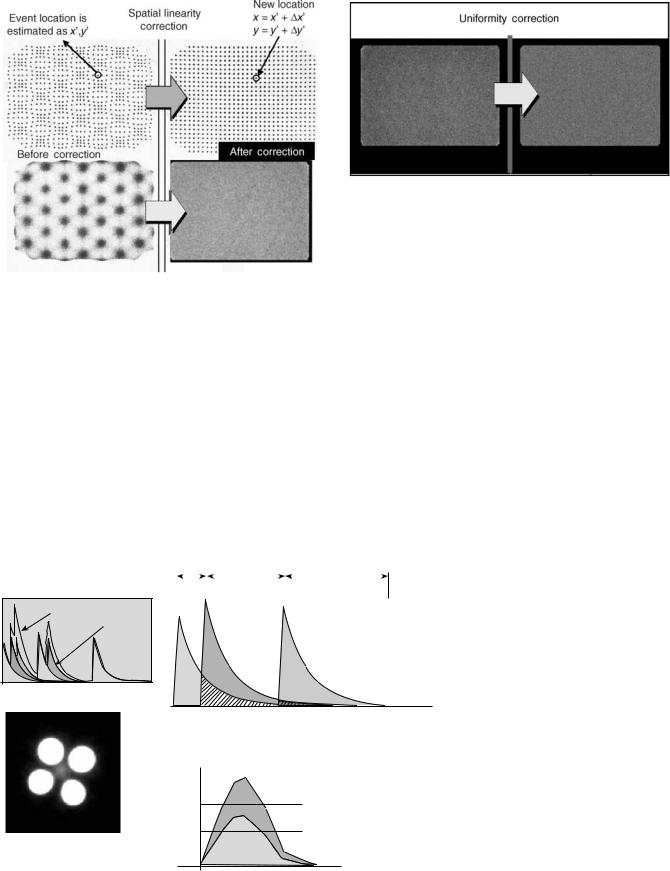
The energy signal represents the total energy absorbed in a gamma-ray interaction with the detector. This signal is determined by the intensity of the scintillation and by how much of the scintillation light is captured by the PMTs. Because the efficiency for sampling the scintillation is position dependent, there are fluctuations in the energy signals across the detector as shown in Fig. 13. These variations degrade energy resolution and have a significant effect on the performance of the scintillation camera that limit corrections for nonuniformity. The idea of using a reference flood field image to correct nonuniformities has been around for a long time. However, if the reference flood field image is acquired with little or no scattered radiation (as it often is), the correction factors are not appropriate during patient imaging. The reason is that scattered radiation and the amount of scatter entering the selected energy
Figure 13. Energy correction. Local spectral gain shifts are evident across the crystal because of the variable sampling imposed by the photomultiplier tube array.
window will be position dependent. Energy correction electronics was introduced in the late 1970s that essentially generated an array of energy windows that are adjusted for the local energy spectra. Typically, the detector field of view is sampled in a 64 64 matrix and a unique energy window is determined for each matrix element. With the energy windows adjusted on the local photopeaks, the variations in the scatter component are greatly reduced. As shown in Fig. 13, energy correction does not significantly improve intrinsic field uniformity. Its role is to reduce the influence of source scatter on the other correction factors (11,20,26–28).
Spatial Linearity Correction
The nonlinearities in the PMT output with respect to source location causes a miss-positioning of events when Anger logic is used. This finding can be demonstrated by acquiring an image of a straight line distribution or a grid pattern. The line image will have a ‘‘wavy’’ appearance (Fig. 14). In the early 1980s, a method to improve the spatial linearity was developed. An imaging phantom array of precisely located holes in a sheet of lead is placed
on the uncollimated detector and is exposed to a point source of 99mTc located 1–2 m away. The image of the hole
pattern is used to calculate corrective x and y offsets for each point in the field of view. These correction factors are stored in a ROM. When an event is detected and the Anger logic produces x and y coordinates, the offsets associated with these coordinates are automatically added generating the new, accurate event location. Improving the spatial linearity has a profound affect on field uniformity as can be seen in Fig. 14 (17,28–31).
Uniformity Correction
After the energy and spatial linearity corrections have been made, there are still residual nonuniformities that are present in a flood field image. Typically, these will vary < 10% from the mean count value for the entire field. A high count reference flood field image can be acquired and
ANGER CAMERA |
59 |
Figure 14. Spatial linearity correction. Accurate correction for inaccurate event localization has a profound effect on field uniformity.
this image is then used to generate regional flood correction factors that are then applied to subsequent acquisitions (Fig. 15) (17,29,32).
Pulse Pileup Correction
An Anger camera processes each detected event sequentially. Because the scintillation persists with a decay time of 230 ns, pulses from events occurring closely in time are distorted from summation of the light. This distortion is referred to as pulse pileup. As the count rate to the detector increases, the amount of pulse pileup also increases and becomes significant at count rates > 30,000 cps. For much of conventional nuclear medicine imaging, this is not a
Figure 15. Uniformity correction. Residual non-uniformities can be reduced by skimming counts based on a reference flood field image.
problem since the count rate is typically well below that level. There are certain applications such as coincidence positron emission tomography (PET) imaging where the detectors are exposed to event rates that can exceed 1,000,000 cps. Because the Anger logic used to establish the event location is essentially a centroid method, pulse pileup causes errors. An example of this is shown in Fig. 16, which shows an Anger camera image of four high-count rate sources. In addition to the actual sources, false images of source activity between the sources are also observed (33,34). The effects of pulse pileup can be minimized by electronic pulse clipping, where the pulse is forced to the baseline before all the light has been emitted and processed. While this increases the count rate capability, it compromises both spatial and energy resolution, which are optimal when the whole pulse can be sampled and integrated. One approach to reduce losses in spatial and energy resolution is to alter the integration time event-by-event, based on count rate demands. In addition, algorithms have been developed that can extrapolate the pulse to correct for
Pulse pileup |
|
|
|
|
|
|
|
|
|
tint |
|
tint |
|
tint |
|||
Observed |
Individual |
|
signal |
||
events |
||
|
Time( s)
Extrapolate pulse to estimate true size
Pulse amplitude
Inseparable pileup
Valid event
Figure 16. Pulse pileup correction. Pulse pileup correction improves the count rate capability and reduces the spurious place-
ment of events.
Time
60 ANGER CAMERA
its contribution to a second pileup pulse. This process can be repeated if a third pileup is also encountered. When this correction is performed at the PMT level, it reduces the ‘‘false’’ source images discussed above (35).
PERFORMANCE
Uniformity
When the Anger camera is exposed to a uniform flux of gamma rays, the image from that exposure should have a uniform count density. Anger cameras with energy, spatial linearity, and uniformity correction are uniform to within 2.5% of the mean counts.
Intrinsic Spatial Resolution
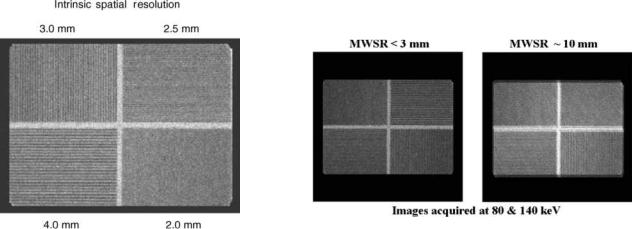
The intrinsic spatial resolution refers to the amount of blurring associated with the Anger camera independent of the collimation. It is quantified by measuring the full width at half-maximum (fwhm) of the line spread response function. The intrinsic spatial resolution for Anger cameras varies from 3 to 4.5 mm depending on the crystal thickness and the size of the PMTs. Another way of evaluating intrinsic spatial resolution for gamma-ray energies < 200 keV is with a quadrant bar phantom consisting of increasingly finer lead bar patterns where the bar width is equal to the bar spacing (Fig. 17). Typically an Anger camera can resolve a 2 mm bar pattern.
Extrinsic Spatial Resolution
The extrinsic spatial resolution, also referred to as the system spatial resolution, refers to the amount of blurring associated with Anger camera imaging. It depends on the collimation, gamma-ray energy, and the source to collimator distance. The standard method for determining the extrinsic resolution is from the fwhm of the line spread response function generated from the image of a line source positioned 10 cm from the collimator. Typical values for the extrinsic spatial resolution range from 8 to 12 mm.
Energy Resolution
The energy signal generated from gamma-ray absorption in the detector has statistical fluctuations that broaden the apparent energy peaks of the gamma rays. Energy resolution is determined from 100% fwhm/Eg, where fwhm is of energy peak and Eg is the gamma-ray energy. At 140 keV the energy resolution of an Anger camera is 10%. Good energy resolution is important because it permits the discrimination of scattered radiation from the patient. Gamma rays that are scattered in the patient necessarily loose energy and these scattered photons degrade image quality.
Spatial Linearity
Spatial linearity refers to the accurate positioning of detected events. On an Anger camera with spatial linearity correction, the misplacement of events is < 0.5 mm.
Multiwindow Spatial Registration
Because the Anger camera has energy resolution, it can acquire images from radionuclides that emit more than one gamma ray or from two radionuclides. However, the images from different energy gamma rays may have slightly different magnifications or have offsets because of imperfections in the energy normalization. The multiwindow spatial registration parameters quantifies the misalignment between different energy gamma rays (Fig. 18). For Anger cameras, the multiwindow spatial registration is < 2 mm, which is well below the system spatial resolution and therefore is not perceptible.
Count Rate Performance
The count rate capability of Anger camera ranges from 100,000 to 2,000,000 cps depending on the sophistication of the pulse handling technology as discussed above. Anger cameras that are used for conventional nuclear medicine imaging are designed to operate with maximum count rates of 200,000–400,000 cps range, whereas Anger cameras that are used for coincidence imaging require count rate capabilities that exceed 1,000,000 cps (25,28,30,32,36–41).
Figure 17. Intrinsic spatial resolution is routinely assessed with bar pattern images. An Anger camera can typically resolve the 2 mm bar pattern.
Figure 18. Multi-window spatial registration refers to ability to accurately image different gamma ray energies simultaneously. The figure on the right is an example of poor multi-window spatial registration.
SUMMARY
The Anger camera has been the primary imaging device in nuclear medicine for > 30 years and is likely to remain in that role for at least the next decade. Although it has evolved with the development of digital electronics, the basic design is essentially that promulgated by H.O. Anger. Special purpose imaging instruments based on semiconductor cadmium zinc telluride detectors are actively being pursued as imaging devices for 99mTc and other low energy gamma emitters. Their pixilated design removes the need for Anger logic position determination and the direct conversion of the absorbed energy into an electronic signal removes the need for photomultiplier tubes allowing compact packaging. However, over the range of gamma-ray energies encountered in nuclear medicine, NaI(Tl) still provides the best efficiency at a reasonable cost.
BIBLIOGRAPHY
Cited References
1.Banerjee S, Pillai MR, Ramamoorthy N. Evolution of Tc-99m in diagnostic radiopharmaceuticals. Semin Nucl Med 2001;31: 260–277.
2.Hine GJ, editor. Instrumentation in Nuclear Medicine. Volume 1, New York: Academic Press; 1967.
3.Pollycove M, Fish MB, Khentigan A. Clinical radioisotope organ imaging–diagnostic sensitivity and practical factors. Rectilinear scanner versus the anger-type scintillation camera. J Nucl Med 1967;8:321–322.
4.Blahd WH. Ben Cassen and the development of the rectilinear scanner. Semin Nucl Med 1996;26:165–170.
5.McCready VR. Milestones in nuclear medicine. Eur J Nucl Med 2000;27:S49–S79.
6.Anger H. A new instrument for mapping gamma ray emitters. Bio Med Quart Rep 1957; UCRL-3653 38.
7.Anger H. Scintillation camera with multichannel collimators. J Nucl Med 1964;5:515–531.
8.Hine GJ. The inception of photoelectric scintillation detection commemorated after three decades. J Nucl Med 1977;18:867–871.
9.Powell MR. H.O. Anger and his work at the Donner Laboratory. Semin Nucl Med 1979;9:164–168.
10.Tapscott E. Nuclear medicine pioneer: Hal O. Anger. First scintillation camera is foundation for modern imaging systems. J Nucl Med 1998;39:15N, 19N, 26N–27N.
11.Murphy PH, Burdine JA. Large-field-of-view (LFOV) scintillation cameras. Semin Nucl Med 1977;7:305–313.
12.Cherry S, Sorenson J, Phelps M. Physics in Nuclear Medicine. Philadelphia: W. B. Saunders; 2003.
13.Muehllehner G. Effect of crystal thickness on scintillation camera performance. J Nucl Med 1979;20:992–993.
14.Royal HD, Brown PH, Claunch BC. Effects of a reduction in crystal thickness on Anger-camera performance. J Nucl Med 1979;20:977–980.
15.Keszthelyi-Landori S. NaI(Tl) camera crystals: imaging capabilities of hydrated regions on the crystal surface. Radiology 1986;158:823–826.
16.Anger H. Scintillation Camera. Rev Sci Instrum 1958;29: 27–33.
17.Genna S, Pang SC, Smith A. Digital scintigraphy: principles, design, and performance. J Nucl Med 1981;22:365–371.
18.Anger H. Scintllation camera with 11 inch crystal. UCRL11184 (1963).
ANGER CAMERA |
61 |
19.Scrimger JW, Baker RG. Investigation of light distribution from scintillations in a gamma camera crystal. Phys Med Biol 1967;12:101–103.
20.White W. Resolution, sensitivity, and contrast in gammacamera design: a critical review. Radiology 1979;132:179–187.
21.Zimmerman RE. Gamma cameras—state of the art. Med Instrum 1979;13:161–164.
22.Goodwin PN. Recent developments in instrumentation for emission computed tomography. Semin Nucl Med 1980;10:322–334.
23.Strand SE, Lamm IL. Theoretical studies of image artifacts and counting losses for different photon fluence rates and pulse-height distributions in single-crystal NaI(T1) scintillation cameras. J Nucl Med 1980;21:264–275.
24.Kereiakes JG. The history and development of medical physics instrumentation: nuclear medicine. Med Phys 1987;14:146–155.
25.Chang W, Li SQ, Williams JJ, Bruch PM, Wesolowski CA, Ehrhardt JC, Kirchner PT. New methods of examining gamma camera collimators. J Nucl Med 1988;29:676–683.
26.Budinger TF. Instrumentation trends in nuclear medicine. Semin Nucl Med 1977;7:285–297.
27.Myers WG. The Anger scintillation camera becomes of age. J Nucl Med 1979;20:565–567.
28.Heller SL, Goodwin PN. SPECT instrumentation: performance, lesion detection, and recent innovations. Semin Nucl Med 1987;17:184–199.
29.Muehllehner G, Colsher JG, Stoub EW. Correction for field nonuniformity in scintillation cameras through removal of spatial distortion. J Nucl Med 1980;21:771–776.
30.Muehllehner G, Wake RH, Sano R. Standards for performance measurements in scintillation cameras. J Nucl Med 1981;22: 72–77.
31.Johnson TK, Nelson C, Kirch DL. A new method for the correction of gamma camera nonuniformity due to spatial distortion. Phys Med Biol 1996;41:2179–2188.
32.Murphy PH. Acceptance testing and quality control of gamma cameras, including SPECT. J Nucl Med 1987;28:1221–1227.
33.Strand SE, Larsson I. Image artifacts at high photon fluence rates in single-crystal NaI(T1) scintillation cameras. J Nucl Med 1978;19:407–413.
34.Patton JA. Instrumentation for coincidence imaging with multihead scintillation cameras. Semin Nucl Med 2000;30: 239–254.
35.Wong WH, Li H, Uribe J, Baghaei H, Wang Y, Yokoyama S. Feasibility of a high-speed gamma-camera design using the high-yield-pileup-event-recovery method. J Nucl Med 2001;42: 624–632.
36.O’Connor MK, Oswald WM. The line resolution pattern: a new intrinsic resolution test pattern for nuclear medicine [see comments]. J Nucl Med 1988;29:1856–1859.
37.De Agostini A, Moretti R. Gamma-camera quality control procedures: anon-line routine. J Nucl Med Allied Sci1989;33:389–395.
38.Lewellen TK, Bice AN, Pollard KR, Zhu JB, Plunkett ME. Evaluation of a clinical scintillation camera with pulse tail extrapolation electronics. J Nucl Med 1989;30:1554–1558.
39.Links JM. Toward a useful measure of flood-field uniformity: can the beauty in the eye of the beholder be quantified? [editorial] [see comments]. Eur J Nucl Med 1992;19:757–758.
40.Hander TA, Lancaster JL, Kopp DT, Lasher JC, Blumhardt R, Fox PT. Rapid objective measurement of gamma camera resolution using statistical moments. Med Phys 1997;24:327–334.
41.Smith EM. Scintillation camera quality control, Part I: Establishing the quality control program. J Nucl Med Technol 1998;26:9–13.
See also COMPUTED TOMOGRAPHY, SINGLE PHOTON EMISSION; IMAGING DEVICES; MICROPOWER FOR MEDICAL APPLICATIONS; NUCLEAR MEDICINE INSTRUMENTATION.