

- •VOLUME 1
- •CONTRIBUTOR LIST
- •PREFACE
- •LIST OF ARTICLES
- •ABBREVIATIONS AND ACRONYMS
- •CONVERSION FACTORS AND UNIT SYMBOLS
- •ABLATION.
- •ABSORBABLE BIOMATERIALS.
- •ACRYLIC BONE CEMENT.
- •ACTINOTHERAPY.
- •ADOPTIVE IMMUNOTHERAPY.
- •AFFINITY CHROMATOGRAPHY.
- •ALLOYS, SHAPE MEMORY
- •AMBULATORY MONITORING
- •ANALYTICAL METHODS, AUTOMATED
- •ANALYZER, OXYGEN.
- •ANESTHESIA MACHINES
- •ANESTHESIA MONITORING.
- •ANESTHESIA, COMPUTERS IN
- •ANGER CAMERA
- •ANGIOPLASTY.
- •ANORECTAL MANOMETRY
- •ANTIBODIES, MONOCLONAL.
- •APNEA DETECTION.
- •ARRHYTHMIA, TREATMENT.
- •ARRHYTHMIA ANALYSIS, AUTOMATED
- •ARTERIAL TONOMETRY.
- •ARTIFICIAL BLOOD.
- •ARTIFICIAL HEART.
- •ARTIFICIAL HEART VALVE.
- •ARTIFICIAL HIP JOINTS.
- •ARTIFICIAL LARYNX.
- •ARTIFICIAL PANCREAS.
- •ARTERIES, ELASTIC PROPERTIES OF
- •ASSISTIVE DEVICES FOR THE DISABLED.
- •ATOMIC ABSORPTION SPECTROMETRY.
- •AUDIOMETRY
- •BACTERIAL DETECTION SYSTEMS.
- •BALLOON PUMP.
- •BANKED BLOOD.
- •BAROTRAUMA.
- •BARRIER CONTRACEPTIVE DEVICES.
- •BIOCERAMICS.
- •BIOCOMPATIBILITY OF MATERIALS
- •BIOELECTRODES
- •BIOFEEDBACK
- •BIOHEAT TRANSFER
- •BIOIMPEDANCE IN CARDIOVASCULAR MEDICINE
- •BIOINFORMATICS
- •BIOLOGIC THERAPY.
- •BIOMAGNETISM
- •BIOMATERIALS, ABSORBABLE
- •BIOMATERIALS: AN OVERVIEW
- •BIOMATERIALS: BIOCERAMICS
- •BIOMATERIALS: CARBON
- •BIOMATERIALS CORROSION AND WEAR OF
- •BIOMATERIALS FOR DENTISTRY
- •BIOMATERIALS, POLYMERS
- •BIOMATERIALS, SURFACE PROPERTIES OF
- •BIOMATERIALS, TESTING AND STRUCTURAL PROPERTIES OF
- •BIOMATERIALS: TISSUE-ENGINEERING AND SCAFFOLDS
- •BIOMECHANICS OF EXERCISE FITNESS
- •BIOMECHANICS OF JOINTS.
- •BIOMECHANICS OF SCOLIOSIS.
- •BIOMECHANICS OF SKIN.
- •BIOMECHANICS OF THE HUMAN SPINE.
- •BIOMECHANICS OF TOOTH AND JAW.
- •BIOMEDICAL ENGINEERING EDUCATION
- •BIOSURFACE ENGINEERING
- •BIOSENSORS.
- •BIOTELEMETRY
- •BIRTH CONTROL.
- •BLEEDING, GASTROINTESTINAL.
- •BLADDER DYSFUNCTION, NEUROSTIMULATION OF
- •BLIND AND VISUALLY IMPAIRED, ASSISTIVE TECHNOLOGY FOR
- •BLOOD BANKING.
- •BLOOD CELL COUNTERS.
- •BLOOD COLLECTION AND PROCESSING
- •BLOOD FLOW.
- •BLOOD GAS MEASUREMENTS
- •BLOOD PRESSURE MEASUREMENT
- •BLOOD PRESSURE, AUTOMATIC CONTROL OF
- •BLOOD RHEOLOGY
- •BLOOD, ARTIFICIAL
- •BONDING, ENAMEL.
- •BONE AND TEETH, PROPERTIES OF
- •BONE CEMENT, ACRYLIC
- •BONE DENSITY MEASUREMENT
- •BORON NEUTRON CAPTURE THERAPY
- •BRACHYTHERAPY, HIGH DOSAGE RATE
- •BRACHYTHERAPY, INTRAVASCULAR
- •BRAIN ELECTRICAL ACTIVITY.
- •BURN WOUND COVERINGS.
- •BYPASS, CORONARY.
- •BYPASS, CARDIOPULMONARY.
354BIOMATERIALS, TESTING AND STRUCTURAL PROPERTIES OF
35.Hanawa T. In vivo metallic biomaterials and surface modification. Mat Sci Eng A-Struct 1999;267(2):260–266.
36.Guzman L, Celva R, Miotello A, Voltolini E, Ferrari F, Adami M. Polymer surface modification by ion implantation and reactive deposition of transparent films. Surf Coat Tech 1998;104:375–379.
37.Cui FZ, Luo QL, Feng J. Highly adhesive hydroxyapatite coatings on titanium alloy formed by ion beam assisted deposition. J Mater Sci Mater M 1997;8:403–405.
38.Howlett CR, Zreiqat H, Wu Y, McFall DW, McKenzie DR. Effect of ion modification of commonly used orthopedic materials on the attachment of human bone-derived cells. J Biomed Mater Res 1999;45(4):345–354.
39.Sioshansi P, Tobin EJ. Surface treatment of biomaterials by ion beam processes. Surf Coat Tech 1996;83(1–3):175–182.
40.Davenas J, Thevenard P, Philippe F, Arnaud MN. Surface implantation treatments to prevent infection complications in short term devices. Biomol Eng 2002;19(2–6):263–268.
41.Leng YX, Chen JY, Zeng ZM, Tian XB, Yang P, Huang N, Zhou ZR, Chu PK. Properties of titanium oxide biomaterials synthesized by titanium plasma immersion ion implantation and reactive ion oxidation. Thin Solid Films 2000;377:573– 577.
42.Ostuni E, Chapman RG, Holmlin RE, Takayama S, Whitesides GM. A survey of structure-property relationships of surfaces that resist the adsorption of protein. Langmuir 2001;17:5605–5620.
43.Textor M, Ruiz L, Hofer R, Rossi A, Feldman K, Hahner G, Spencer ND. Structural chemistry of self-assembled monolayers of octadecylphosphoric acid on tantalum oxide surfaces. Langmuir 2000;16(7):3257–3271.
44.Chandy T, Das GS, Wilson RF, Rao GHR. Use of plasma glow for surface-engineering biomolecules to enhance bloodcompatibility of Dacron and PTFE vascular prosthesis. Biomaterials 2000;21(7):699–712.
45.Peluso P, Wilson DS, Do D, Tran H, Venkatasubbaiah M, Quincy D, Heidecker B, Poindexter K, Tolani N, Phelan M, Witte K, Jung LS, Wagner P, Nock S. Optimising antibody Immobilization strategies for the construction of protein microarrays. Anal Biochem 2003;312:113–124.
46.Sackmann E, Tanaka M. Supported membranes on soft polymer cushions: fabrication, characterization and applications. Trends Biotechnol 2000;18:58–64.
47.Plant AL. Supported hybrid bilayer membranes as rugged cell membrane mimics. Langmuir 1999;15(15):5128–5135.
48.Krishna G, Schulte J, Cornell BA, Pace RJ, Osman PD. Tethered bilayer membranes containing ionic reservoirs: Selectivity and conductance. Langmuir 2003;19(6):2294–2305.
49.Winograd N. Prospects or imaging TOF-SIMS: from fundamentals to biotechnology. Appl Surf Sci 2003;203:13–19.
50.Castner DG, Ratner BD. Biomedical surface science: Foundations to frontiers. Surface Sci 2002;500(1–3):28–60.
51.Watts JF, Wolstenholme J. An Introduction to Surface Analysis by XPS and AES. Chichester: John Wiley & Sons; 2003.
52.Chittur K. FTIR/ATR for protein adsorption to biomaterials surfaces. Biomaterials 1998;19:357–369.
53.Adamson AP, Gast AW. Physical Chemistry of Surfaces. New York: John Wiley & Sons; 1997.
54.Vickerman JC, editor. Surface analysis: The Principal Techniques. Chichester: John Wiley & Sons; 1997, p. 457.
55.Elwing H. Protein adsorption and ellipsometry in biomaterials research. Biomaterials 1998;19:397–406.
56.Arwin H. Ellipsometry on thin organic layers of biological interest: characterization and applications. Thin Solid Films 2000;377:48–56.
57.Hunter RJ. Zeta Potential in Colloid Science. London: Academic Press; 1988. p 67.
58.Green RJ, Frazier RA, Shakesheff KM, Davies MC, Roberts CJ, Tendler SJB. Surface plasmon resonance analysis of dynamic biological interactions with biomaterials. Biomaterials 2000;21(18):1823–1835.
59.Lewis KB, Ratner BD. Observation of surface restructuring of polymers using ESCA. J Colloid Interface Sci 1993;159:77– 85.
60.Wagner MS, Castner DG. Characterization of adsorbed protein films by time of flight secondary ion mass spectrometry (ToF-SIMS) in conjunction with prinicpal component analysis (PCA). Langmuir 2001;17:4649–4660.
61.Boonaert C, Rouxhet P, Dufrene Y. Surface propaerties of microbial cells probed at the nanometre scale with atomic force microscopy. Surf Interface Anal 2000;30:32–35.
62.Fritz M, Radmacher M, Cleveland JP, Allersma MW, Stewart RJ, Gieselmann R, Janmey P, Schmidt CF, Hansma PK. Imaging globular and filamentous proteins in physiological buffer solutions with tapping mode atomic force microscopy. Langmuir 1995;11:3529–3535.
63.Hartley PG. Farinato R, Dubin P, editors. Measurement of Colloidal Interactions Using the Atomic Force Microscope, in Colloid-Polymer Interactions: From Fundamentals to Practice. New York: John Wiley & Sons; 1999.
64.Hartle PG, McArthur SL, McLean KM, Griesser HJ. Physicochemical properties of polysaccharide coatings based on grafted multilayer assemblies. Langmuir 2002;18(7):2483–2494.
65.Leckband D, Sheth S, Halperin A. Grafted poly(ethylene oxide) brushes as nonfouling surface coatings. J Biomater Sci Polym Ed 1999;10(10):1125–47.
66.Halperin A. Polymer brushes that resist adsorption of model proteins: Design parameters. Langmuir 1999;15:2525–2533.
67.Evans E. Energy landscapes of biomolecular adhesion and receptor anchoring at interfaces explored with dynamic force microscopy. Faraday Discuss 1998;111:1–16.
68.Sun S, Chong KS, Leggett GJ. Nanoscale molecular patterns fabricated by using scanning near-field optical lithography. J Am Chem Soc 2002;124(11):2414–2415.
Reading List
Andrade JD, editor. Surfaces and Interfacial Aspects of Biomedical Polymers. New York: Plenum Press; 1985.
Malmsten M, editor. Biopolymers at Interfaces. New York: Marcel Dekker; 1998/2004.
Castner DG, Ratner BD. Biomedical surface science: Foundations to frontiers. Surface Sci 2002;500(1–3):28–60.
Adamson AW, Gast AP. Physical Chemistry of Surfaces. New York: John Wiley & Sons; 1997.
See also BIOCOMPATIBILITY OF MATERIALS; BIOSURFACE ENGINEERING;
MICROSCOPY, SCANNING TUNNELING.
BIOMATERIALS, TESTING AND STRUCTURAL PROPERTIES OF
DONGLU SHI
University of Cincinnati
XUEJUN WEN
Clemson University
Clemson, South Carolina
INTRODUCTION
Tissue transplantation and synthetic devices have been utilized in order to substitute the function of lost
or damaged hard tissue, such as bone and tooth. Tissue transplants can be autologous, allogeneic, or xenogeneic. However, the use of autologous tissue involves additional surgery and donor site morbidity while the use of allogeneic or xenogeneic tissue involves the risks of immune rejection and disease transmission. Therefore, synthetic hard tissue implants are very necessary. Metals, ceramics, composites, and even polymers are investigated as candidates for the hard tissue replacements. For heavy loaded applications, such as hip prostheses, metals (e.g., Ti–alloys, Co–Cr), and strong inert ceramics (e.g., alumina, zirconia) are extensively studied. Unfortunately, various problems related to both the metallic materials and the bioinert ceramics, for example, corrosion, elastic modulus mismatch (stress concentration and shielding), and bioinertness (only physical connection with host) with metals, and brittle, elastic modulus mismatch, and bioinertness with bioinert ceramics. For these reasons, bioceramics are showing very promising results in the high bioactivity and the formation of interfacial chemical bond with host tissue, which was called osseointegration (1). So far, several bioactive ceramics have been proposed for hard tissue replacements, hydroxyapatide (HA) and bioactive glasses are the most acceptable materials for hard tissue applications (2). The advantages of bioceramics over inert ceramics and metals allow for developing better hard tissue replacements with the characteristics of bioactive and elastic modulus more close to that of bone (2). On the other hand, the mechanical properties of bioceramics are fairly poor when compared with their replaced natural hard tissues. The poor mechanical properties, especially inside the body aqueous environments, limit their applications to only small, unloaded, and low loaded implants, powders, coatings, composites, porous scaffolds for tissue engineering, and so on. Bioceramic coatings and porous scaffold are showing the most promising results for the future hard tissue replacements (3–5). There are various methods developed to produce HA coatings (3–5). Among these techniques, plasma spraying has widely been used. However, this method is not applicable for deposition HA films onto a porous substrate.
In order to obtain a bone substitute possessing both desirable mechanical properties and bioactivity, two major deposition routes in coating the bioactive HA on a highly porous alumina substrate with the similar range of tensile and compressive strength as natural bone were developed. Coated reticulated bioactive substrates can provide the needed mechanical strength for the replacement of the bear-loading functions. The first one is a suspension method in which the ceramic substrates are first coated with a suspension containing the HA powder followed by a sintering with an appropriate time–temperature cycle to densify the HA coating. The second one is a synthesis route or called thermal deposition.
The techniques of coating uniformly thin layers of bioactive HA onto highly porous alumina substrate, the structural properties, especially the interfaces between the coating and the substrate, and the bioactive behavior of the coated substrate in the simulated body fluid (SBF) will be presented in this article.
BIOMATERIALS, TESTING AND STRUCTURAL PROPERTIES OF |
355 |
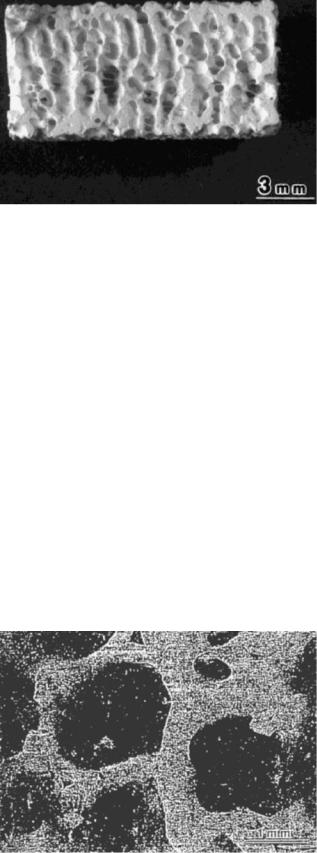
Figure 1. Cross-section of reticulated alumina substrate, showing the interconnected porosity.
MATERIALS AND METHODS
Reticulated alumina Al2O3 was used as the substrate materials. Figure 1 is the gross morphology of the substrate; and Fig. 2 is the cross-section showing the interconnected pores. The average size of the pores is 500 mm, which are large enough to allow the ingrowth of bone tissue. Substrates were cleaned using ultrasonic cleaner in acetone and dried at 100 8C before applying the coating.
Suspension Method
The coating suspension was made up of finely milled ceramic powders, an organic solvent, and a binder. The binder was used to prevent the precipitation of particles and to provide bonding strength to the coating after drying. One important property of the suspension is its viscosity. Specifically, when the porous substrate was immersed in the coating suspension, the suspension must be fluid enough to enter, fill, and uniformly coat the substrate skeleton. Low viscosity could result in undesirable thin films while highly viscous slurry would block the pore, thus impairing the interconnectivity of the pores. The viscosity
Figure 2. Cross-section of reticulated alumina substrate, showing the interconnected porosity.
356 |
BIOMATERIALS, TESTING AND STRUCTURAL PROPERTIES OF |
|
||
|
|
Table 1. Sample Group Assignment |
|
|
|
|
|
|
|
|
|
Sample |
Source and Treatment |
SSA, m2 g 1 |
|
|
HA |
Commercial |
63.02 |
|
|
HA600 |
HA heated at 600 8C, 30 min |
40.92 |
|
|
HA900 |
HA heated at 900 8C, 30 min |
17.45 |
|
|
SHA700 |
Synthesized HA heated at 700 8C, 4 h |
15.19 |
|
|
SHA800 |
Synthesized HA heated at 800 8C, 4 h |
1.49 |
|
|
SHA900 |
Synthesized HA heated at 900 8C, 4 h |
1.23 |
|
|
No. 1 |
HA heated at 700 8C, 3.5 h, particle size: 40–100 mesh |
24.38 |
|
|
No. 2 |
HA heated at 700 8C, 3.5 h, particle size: 100–200 mesh |
25.70 |
|
|
No. 3 |
HA heated at 700 8C, 3.5 h, particle size: > 200 mesh |
27.02 |
|
|
|
|
|
was controlled by the relative amount of solvent, binder, and particles. The porous substrates were subsequently immersed into the mixture. After the porous substrates were completely infiltrated, they were spun briefly in a high speed centrifuge for removal of excess solution. Coated substrates were dried in an oven at 100 8C. The dried specimens were heated in air to 400 8C for 1 h to burn out the organic binder from suspension. During the burnout process, a slow and controlled heating rate was necessary to avoid bubbling in the coating. Then the samples were subject to sintering at different temperatures. Two types of suspension were developed for coating. One was prepared by suspending HA particles (300 mesh) (Chemat Technology, Inc.) in an organic binder–solvent system without glass sintering aid, glass frits. The other was prepared by partially substitution of HA by sintering aid, glass frits (65%), which have good adhesion to the Al2O3 substrate and a weak reaction with HA during firing. The glass frits used in this work were borosilicate glasses containing 75% of a mixture of SiO2 and B2O3, and 20 wt% alkali metal oxides. After melting, the glass was quenched in water and ground in a ball mill into a glass frit of the desired particle size (325 mesh).
Thermal Deposition
Mixing calcium 2-ethyl hexanoate with bis(2-ethyhexyl) phosphite stoichiometrically in ethanol. The viscosity of the solution was controlled by the quantity of ethanol added. The mixture was stirred for 2 days at room temperature. Then mixture was used to coat porous substrates. The coating method used is the same as used in suspension method described earlier. Coated substrates were air-dried and calcinated up to 1000 8C at a heating rate of 2 8C/min. Then the samples were subject to sintering at different temperatures. For phase analysis purpose, the HA was prepared in the powder form as well through same procedures. Briefly, the solution was open to the air and stirred to vaporize the solvent in chemical hood. Finally, a highly viscous, translucent mixture was obtained and then subject to calcinations at desirable temperatures.
Mechanical strength measurements were carried out on an Instron testing unit. Bars of the porous substrate (5 5 60 mm3) were cut using a diamond saw. Tension tests were performed in three-point bending. Compression tests were made on cylinder-shaped sample of 10-mm height and 23 mm diameter. X-ray diffraction (XRD), Scanning electron microscopy (SEM) with an energy dis-
persive spectrometer (EDS) was utilized to study the coating structure, surface morphology, and the interface structure. The coating bonding strength was measured through tape test (ASTM D 3359), which was originally designed for organic coatings on metallic substrates. This method was used to find the relative bonding strength. All the tests were performed on dense alumina substrates with one or multilayer HA coatings. Permacel 670 tape (Permacel) was used in the test. After removal from the coating, the tape was examined under a light microscope. Sintering process and chemical bonding of the sintering products were examined using differential thermal analysis (DTA) and Fourier transform infrared spectroscopy (FTIR).
The in vitro tests were conducted to evaluate the bioactivity of the synthetic HA produced by thermal deposition method (commercial HA as control). All the samples were tested in the powder form (Table 1). Table 1 summarizes the different treatments used to obtain a variety of crystalline structures in the materials; and also names the samples according to the treatment conditions, such as HA, HA600, HA900, SHA700, SHA800, SHA900, No. 1, No. 2, and No. 3. The HA sample group refers to commercial hydroxyapatite samples. HA600 and HA 900 groups refer to commercial HA samples treated for 30 min under 600 and 900 8C, respectively. The SHA700, SHA800, SHA900 conditions refer to synthesized HA using the thermal deposition method described earlier and heated for 4 h at 700, 800, and 900 8C, respectively. Sample No. 1, No. 2, and No. 3 refer to commercial HA and are heat-treated at 700 8C for 3.5 h and with different specific surface area (SSA). Sample No. 3 has the highest SSA; Sample No. 1 has the lowest SSA; and Sample No. 2 is in the middle. The simulated body fluid (SBF) solution that had ionic concentrations close to human blood plasma, as shown in Table 2, was prepared by dissolving reagent grade NaCl, NaHCO3, KCl, K2HPO4 3H2O, MgCl2 3H2O, CaCl2, and Na2SO4 in ion-exchanged distilled water. The solution was buffered at pH 7.4 with 1 M HCl and tris(hydroxymethyl) aminomethane, (CH2OH)3CNH2 at 37 8C. Powders were immersed into solution at 1 mg/mL ratio and maintained at 37 8C at periods ranging from 15 min to 9 weeks. The calcium concentrations in the solutions were measured by inductively coupled plasma (ICP). Subsequent to immersion, the solutions were vacuum filtered. The powders were gently rinsed with alcohol, ion-exchanged distilled water and then dried at room temperature. The surface microstructures before and after immersion of SBF solution were analyzed via scanning electron microscope (SEM). Both

|
|
|
|
|
BIOMATERIALS, TESTING AND STRUCTURAL PROPERTIES OF |
357 |
|||
Table 2. Ionic Concentration of SBF in Comparison With Those of Human Blood Plasma |
|
|
|||||||
|
|
|
|
|
|
|
|
|
|
|
|
|
|
|
Concentration, mM |
|
|
|
|
|
|
|
|
|
|
|
|
|
|
|
|
Naþ |
Kþ |
Ca2þ |
Mg2þ |
HCO3 |
Cl |
HPO42 |
SO4 |
Blood plasma |
142.0 |
5.0 |
2.5 |
1.5 |
27.0 |
103.0 |
1.0 |
0.5 |
|
SBF |
142.0 |
5.0 |
2.5 |
1.5 |
4.2 |
147.8 |
1.0 |
0.5 |
|
|
|
|
|
|
|
|
|
|
|
XRD and FTIR determined the contents of the phases that were present in the coatings. Measurements were obtained on a Philips X-ray diffractometer with CuK-radiation at 35 kV and 23 mA.
RESULTS
Suspension Method
The phase diagram for anhydrous calcium phosphates (Fig. 3) shows that the liquid phase appears at a temperature > 1500 8C, and presumably the induced liquid could improve the bonding between HA and the Al2O3 substrate during sintering. However, such as liquid-enhanced bonding process was not experimentally observed. Meanwhile, XRD analysis of the coating made from HA solution (without glass additive) showed that HA was decomposed, and in turn, the bioactivity of the coating was changed. A high density of cracks was found to exist in the coating. The adherence of the coating to the Al2O3 substrate was low and the coating layer could be peeled off by scraping. These results indicated that HA solution without sintering aid, such as glass frits, was not suitable for this particular application.
Using the sintering aid, glass frits, a well-bonded HA coating was produced. Figures 4–6 are SEM photographs of the surfaces and interfaces of the coatings made from solution with glass frits. As is apparent from Figs. 5 and 6, the glass–HA ceramic layer is firmly attached to the alumina substrate. An average coating thickness is 15 mm. The interfacial strength between the coating and the
4CaO P2 O5 + L
|
1700 |
|
3CaO P2 |
O5 + L |
||
|
|
|||||
|
|
|
||||
|
1600 |
|
|
|
|
|
|
|
|
|
|
|
|
C |
1500 |
|
|
|
|
|
|
|
|
|
|
||
T, ° |
1400 |
|
|
|
|
|
|
|
2CaO P2 |
O5 + L |
|||
|
|
|||||
|
|
|
||||
|
1300 |
|
|
|
|
|
|
|
|
|
|
|
|
|
1200 |
|
|
|
|
|
|
|
|
|
|
|
|
|
|
|
|
|
|
|
1100
40 |
50 |
60 |
|
wt. % CaO |
|
Figure 3. Phase diagram of the system CaO–P2O5, indicating the appearance of the liquid phase at high temperatures.
Figure 4. The SEM photograph of the coated surface.
Figure 5. The SEM photograph of the coating interface for dense alumina. The interface is indicated by arrows.
Figure 6. The SEM photograph of the coating interface for porous alumina. The interface is indicated by arrows.
358 BIOMATERIALS, TESTING AND STRUCTURAL PROPERTIES OF
|
120 |
|
|
|
|
|
|
|
|
|
|
|
|
|
|
|
|
|
|
|
|
|
|
|
|
|
|
|
|
|
|
|
|
|
|
|
|
Interface |
|
|
Compositional |
|
|
|
|
||
|
|
|
|
|
|
|
|
|
|
|
|
||||
|
|
|
|
|
|
|
|
|
|
|
|||||
|
|
|
|
|
|
|
|
|
|
|
|
||||
|
100 |
|
|
|
|
|
|
|
|
profile |
|
|
|
|
|
|
|
|
|
|
|
|
|
|
|
|
|
|
|||
% |
80 |
|
Substrate |
|
|
|
|
|
|
|
|
|
|
|
|
|
|
|
|
|
|
|
|
|
|
|
|
|
|||
|
|
|
|
|
|
|
|
|
|
|
|
|
|||
|
|
|
|
|
|
|
|
|
|
|
|
|
|||
|
|
|
|
|
|
|
|
|
|
|
|
|
|
||
wt.AI, |
60 |
|
|
|
|
HA coating |
|
|
|
|
|
|
|||
|
|
|
|
|
|
|
|
|
|||||||
|
|
|
|
|
|
|
|
|
|
|
|
||||
|
40 |
|
|
|
|
|
|
|
|
|
|
|
|||
|
|
|
|
|
|
|
|
|
|
|
|
|
|
|
|
|
|
|
|
|
|
|
|
|
|
|
|
|
|
|
|
|
|
|
|
|
|
|
|
|
|
|
|
|
|
|
|
|
20 |
|
|
|
|
|
|
|
|
|
|
|
|
|
|
|
|
|
|
|
|
|
|
|
|
|
|
|
|
|
|
|
|
|
|
|
|
|
|
|
|
|
|
|
|
|
|
|
|
|
|
|
|
|
|
|
|
|
|
|
|
|
|
|
0− |
|
|
|
|
|
|
|
|
|
|
|
|
|
|
|
|
|
|
|
|
|
|
|
|
|
|
|
|
|
|
|
|
|
|
|
|
|
|
|
|
|
|
|
|
|
|
|
5 |
0 |
5 |
10 |
15 |
20 |
|||||||||
|
|
|
|
|
|
Distance, µm |
|
|
|
|
|
|
|||
Figure 7. Aluminum content profile along the interface. The solid line is a guide to the eye.
substrate depends on the adherence of the glass to the Al2O3. Figure 7 is the aluminum compositional profile across the interface. The data showed that the aluminum concentration decreased when scanning from the substrate to the outer surface of the coating. It was concluded that aluminum ions diffused during sintering, and consequently bonded the glass to the alumina substrate by ion diffusion. This diffusion bonding is attributed to the formation of a eutectic compound at the interface during the sintering, and thus ensures the strong bonding between the coating and the substrate.
The above results indicate that the development of glass frits is essential for having an excellent adhesion of HA coating to the alumina substrate. Great efforts were therefore made in the preparation of the glass frits. As a sintering aid, the glass must wet the substrate and HA, and its melting point should be lower than the decomposing temperature of HA (1300 8C). Furthermore, for successful coating, optimizing the coefficient of thermal expansion of the glass to match the substrate is critical. It has been known that the mismatch in expansion coefficients between the coating and the substrate materials will give rise to interfacial stress that weakens the bonding strength or leads to the cracking and spalling of the coating. The magnitude of this stress is proportional to the difference between the thermal expansion coefficients of the coating and the substrate. The expansion coefficient of HA (13.3 10 6/8C) is relatively higher than that of alumina (8.0 10 6/8C). The expansion coefficient of the selected glass should then be an intermediate one to reduce this difference. Another important aspect of the glass is chemical durability. For biological applications, it is essential for glass to be nontoxic and stable in the body fluid. The dissolution of the glass will lead to the degradation of the coating. The HA particles will escape from the coating, and this will have an extremely negative effect, such as interfacial loosening and tissue inflammation, on the bone regeneration. The optimal properties of the glass can be achieved by adjusting the glass compositions. The glass selected in this work was borosilicate glass. Its expansion coefficient is compatible with that of Al2O3 substrate. No crack was found in the coating
|
250 |
|
|
|
|
|
|
|
|
|
|
|
HA Coating |
|
|
unit |
200 |
|
|
|
|
|
|
|
|
|
|
|
|
|
|
arbitrary |
150 |
|
|
|
|
|
|
|
|
|
|
|
|
|
|
Intensity, |
100 |
|
|
|
|
|
|
50 |
|
|
|
|
|
|
|
|
|
|
|
|
|
|
|
|
0 |
|
|
|
|
|
|
|
20 |
25 |
30 |
35 |
40 |
45 |
50 |
|
|
|
|
2θ |
|
|
|
Figure 8. The XRD spectra showing a typical HA pattern of the coating surface.
(Fig. 4). The XRD pattern of the coating (Fig. 8) shows that there is no negative reaction between the glass and HA. Figure 8 is a typical HA diffraction pattern. Mechanical properties of HA-coated reticulated alumina are 7–10.35 MPa for compressive strength and 5–8 MPa for tensile strength. Compared to previously reported porous materials, such as porous HA (1.3 MPa for compressive strength and 2.5 MPa for tensile strength) and coralline ceramic (5.8 MPa for compressive strength and 1.3 MPa for tensile strength) (6), a substantial increase in strength was obtained. These values are comparable to those of cancellous bone (2–12 MPa for compressive strength and 10–20 for tensile strength) (2). Some much stronger substrate materials, such as fiber reinforced composites, are excellent candidates for the HA coating using the developed approaches discussed in this article. The mechanical properties of the substrate can also be significantly improved by other ceramics routes. In addition, after bone ingrowth, the strength of the implant (bone composites) will be expected to further increase by a factor of 2–7 as previously demonstrated (7).
Thermal Deposition Method
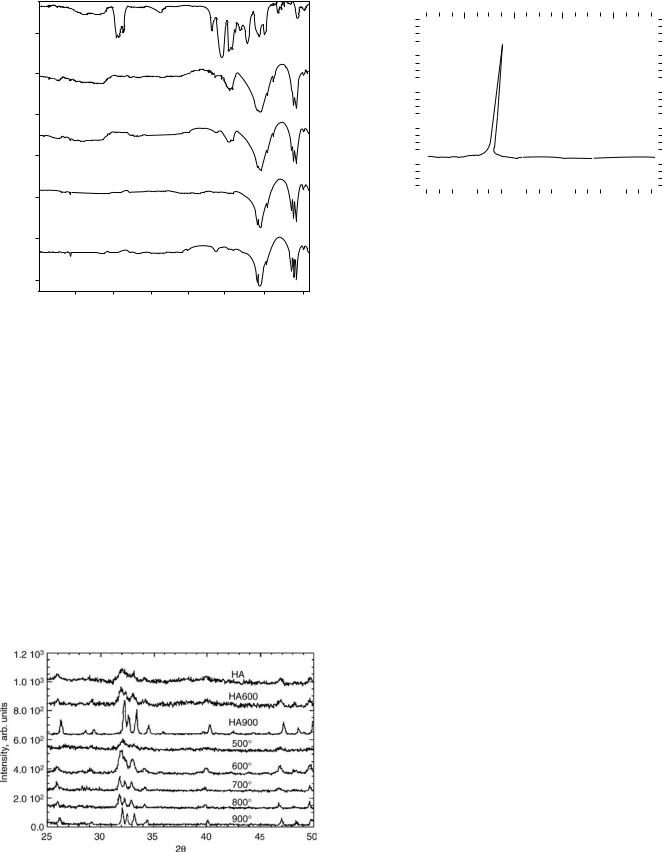
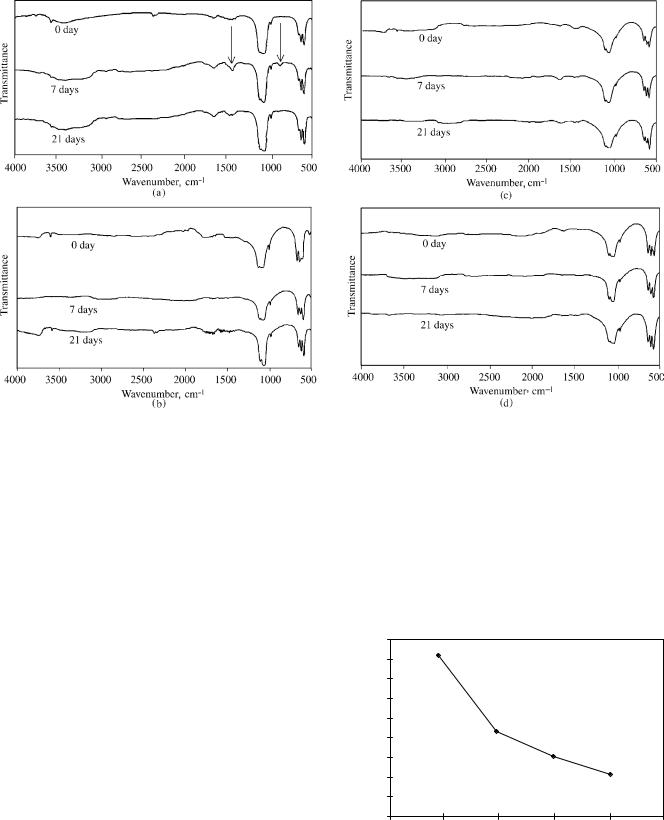
Figure 9 shows the FTIR spectra of an unfired sample and samples fired at 500, 600, 700, and 900 8C. According to standard IR transmission spectra, peaks observed at 3573 and 631 cm 1 are assigned to OH stretching and librational modes. Peaks 600 and 1100 cm 1 are due to the bending and stretching modes of PO bonds in the phosphate groups
(8). These are characteristic peaks of HA. At a sintering temperature of 500 8C, PO bonds formed, but hydroxyl groups were not detected. Compared with the spectra of the unfired sample, most organic groups were burned out by this temperature. At 600 8C, all the characteristic lines of HA were recorded, but some organic residual could still be seen. At 700 8C and higher the peak positions match all those of standard HA, and the organic groups were not detectable.
Figure 10 shows the XRD spectra of HA sintered at different temperatures in the range of 600–900 8C. The results of the XRD are quite consistent with that of the FTIR. The crystalline phase started to form at 600 8C, and
120 Unfired
100 |
|
|
||
|
|
500 °C |
||
Transmittance |
80 |
|
|
|
60 |
600 |
°C |
||
|
||||
|
|
|||
|
40 |
|
|
|
|
|
700 °C |
||
BIOMATERIALS, TESTING AND STRUCTURAL PROPERTIES OF |
359 |
||||||||||||
|
2.0 × 10² |
|
|
|
|
|
|
|
|
|
|
|
|
|
|
|
|
|
|
|
|
|
|
|
|
|
|
mCal/s |
1.5 × 10² |
|
|
|
|
|
|
|
|
|
|
|
|
|
|
|
|
|
|
|
|
|
|
|
|
||
1.0 × 10² |
|
|
|
|
|
|
|
|
|
|
|
|
|
|
|
|
|
|
|
|
|
|
|
|
|
||
Flow, |
50 |
|
|
|
|
|
|
|
|
|
|
|
|
Heat |
|
|
|
|
|
|
|
|
|
|
|
|
|
0.0 |
|
|
|
|
|
|
|
|
|
|
|
|
|
|
|
|
|
|
|
|
|
|
|
|
|
|
|
|
−50 |
|
|
|
|
|
|
|
|
|
|
|
|
|
|
|
|
|
|
|
|
|
|
|
|
|
|
|
0 |
200 |
400 |
600 |
800 |
1000 |
|||||||
|
|
|
|
|
Temperature, °C |
|
|
|
|
|
|||
20 |
|
|
|
|
|
|
900 °C |
|
|
|
|
|
|
0 |
|
|
|
|
|
|
3500 |
3000 |
2500 |
2000 |
1500 |
1000 |
500 |
|
|
Wavenumber, cm−1 |
|
|
||
Figure 9. The FTIR spectra of HA-coated samples sintered for 4 h at the temperature indicated (thermal deposition).
all peaks were attributed to the HA phase. According to the Scherrer equation,
Dð2uÞ ¼ Kl=D |
ð1Þ |
where D is the crystallite dimension; K is the Scherer constant (here K ¼ 0.9); is the X-ray wavelength in angstroms; D(2) is the true broadening of the diffraction peak at half-maximum intensity. The crystallite size is inversely proportional to the peak width. The broadening of peaks was evident at lower sintering temperatures, indicating the initial state of crystal formation. At higher sintering temperatures, the sharpening of peaks evidenced the growth of crystals. The peak shift could also be noted by comparing it with the standard XRD spectra of HA. At lower temperatures the shift was considerable, suggesting great lattice distortion.
Figure 10. The XRD spectra of HA samples sintered at the temperatures indicated.
Figure 11. The DTA profile of the HA-coated sample showing a reaction near 300 8C.
Monitoring the sintering process and the evolution of chemical bonds is important in determining the bioactivity of the sintered products. The material with more lattice defects would be expected to be more reactive (2). This assumption will be experimentally verified later in in vitro tests. The high temperature and long sintering time will result in well-crystallized products. Therefore, to enhance the bioactivity, low temperature and short sintering time is preferred. It is critical to find an optimal sintering procedure so that the sintered HA is poorly crystallized but with no organic residuals. The DTA profile (Fig. 11) shows that burn-out of organic residuals occurs over the temperature range of 300–350 8C. In the current work, the samples were baked at 500 8C to burn out the organic groups. At this temperature, the structure of the sample is amorphous and most of the organic groups can be easily removed. This procedure will be helpful in eliminating residual carbon in the coating. Without this treatment, some organics could be incorporated in the final crystal lattice. It was found that the carbon disappeared at much lower temperatures than those samples treated in a rapid sintering process because most organic groups were not burned out at low temperatures. Therefore, a higher temperature is needed to remove them. However, the reactivity of HA is considerably reduced. It should be noted that the removal of the organic residue is not only related to the microstructure, but also to the macrostate of the samples. For example, for a thick and dense coating, a high temperature is needed to remove the residual carbon.
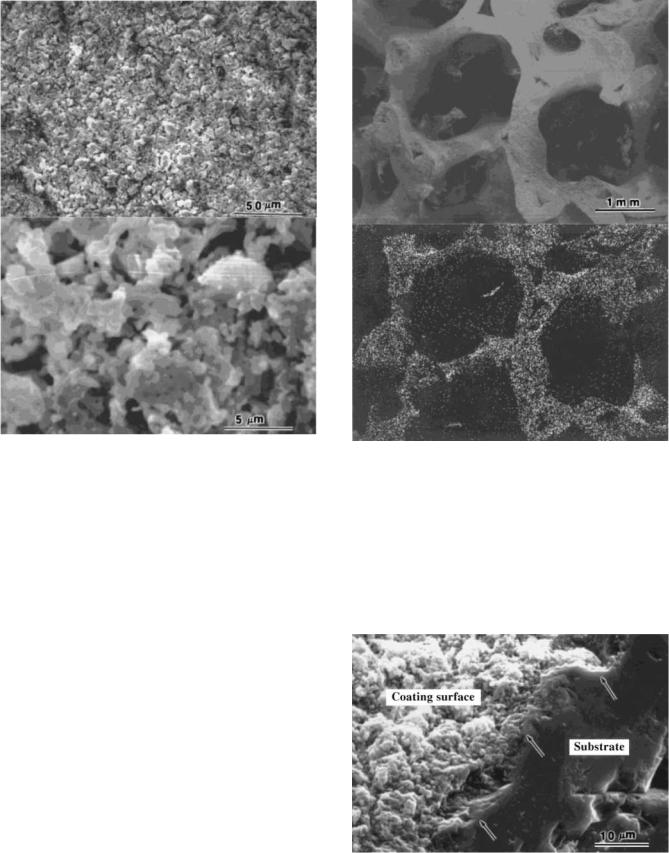
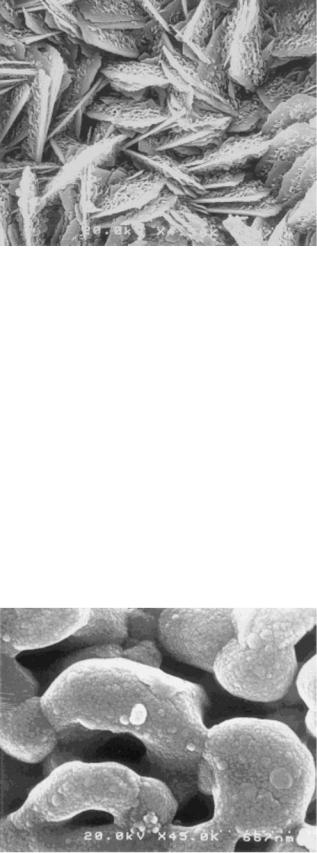
The bonding strength between the HA coating and the substrate was determined using the tape test. No peeling of the coating film was observed for all samples, indicating a strong bonding between the HA coating and the substrate. Figure 12 is the SEM micrographs showing the surfaces of the HA coating on dense alumina. As can be seen in this figure, the coating is fairly porous, which contributes to the bioactivity when immersed in SBF. Figure 13 is an SEM image of HA-coated reticulated alumina with significant open pores in the matrix. Figure 13b is the X-ray map recorded with Ca Ka lines for coated porous alumina. As can be seen in Fig. 13b, the distribution of calcium demonstrated that HA is uniformly coated on the skeleton of the
360 BIOMATERIALS, TESTING AND STRUCTURAL PROPERTIES OF
Figure 12. The SEM photographs showing the coated surface for a dense alumina substrate.
substrate. Figure 14 is the SEM micrograph showing the interface between the HA coating and the substrate. The coating thickness was 1 mm, which can also be altered by a second or third coating.
Bioactivity Test
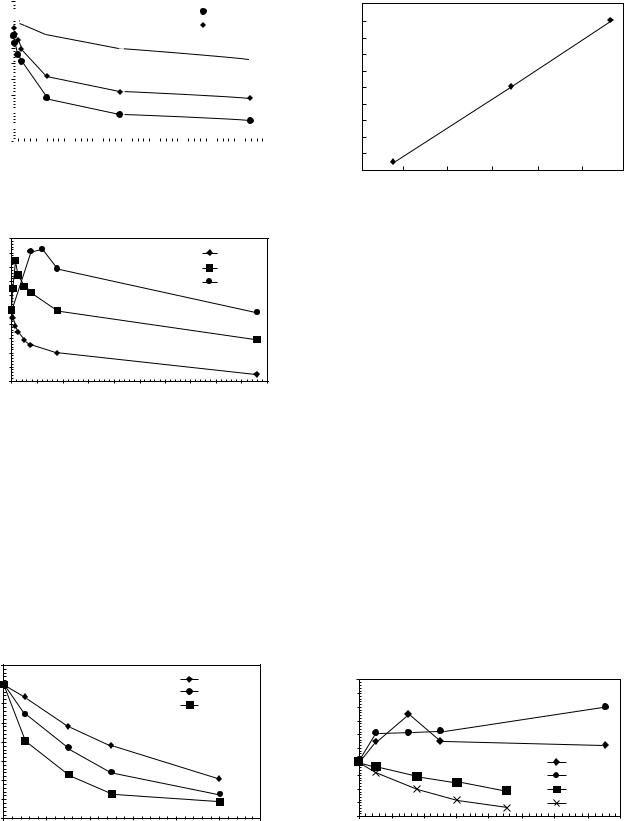
Due to bioactivity of HA, dissolution occurs after the sample is immersed in SBF. Consequently, some of the elements such as calcium in the solution are expected to change. The elemental-concentration changes of calcium in the SBF solution as a function of time are given in Figs. 15,16. As can be seen in Fig. 15, both HA and HA600 exhibit an immediate uptake of the Ca concentration. Initially, there is a high rate of ion uptake, suggesting the formation of a new phase on the HA surface in supersaturated solution. After 24 h, with the depletion of supersaturation, the reaction proceeds at a lower rate of uptake. For HA900, there is an induction time of 60 min prior to a detectable decrease in Ca concentration, and the initial rate of Ca uptake is much lower than those of HA and HA600. The SHA700 behaves similarly to HA and HA600 with a slow reaction rate, as can be seen in Fig. 16. However, the reaction behaviors of SHA800 and SHA900 significantly differ from the HA samples. During the first hour, an increase of Ca concentration was measured, indicating that dissolution of SHA800 and SHA900 has surpassed the new
Figure 13. The SEM photographs showing (a) porous alumina substrate and (b) an X-ray map recorded with Ca Ka lines.
phase formation. Note that the rise in supersaturation for SHA900 is greater than that for SHA800. The ion uptake takes place after this initial dissolution. Another difference between HA and SHA series is that the latter took longer to reach the solid–solution equilibrium stage, clearly indicating a slower reaction rate in the HA series. These results suggest that the dissolution and precipitation rates are
Figure 14. The SEM photograph showing the interface between the HA coating and the dense alumina substrate.
BIOMATERIALS, TESTING AND STRUCTURAL PROPERTIES OF |
361 |
|
5.0 |
|
|
|
|
|
|
|
|
|
|
|
|
|
|
|
|
|
|
|
|
|
|
|
|
|
|
|
|
|
|
|
|
|
|
|
|
|
|
|
|
|
|
|
|
|
|
|
|
|
|
|
|
|
|
|
|
HA |
|
|
|
|
|
|
|
Mm |
0.0 |
|
|
|
|
|
|
|
|
|
|
|
|
|
|
|
|
|
|
|
|
|
|
|
|
HA600 |
|
|
||||
−5.0 |
|
|
|
|
|
|
|
|
|
|
|
|
|
|
|
|
|
|
|
|
|
|
|
|
|
|
||||||
|
|
|
|
|
|
|
|
|
|
|
|
|
|
|
|
|
|
|
|
|
|
|
|
|
|
|
|
|||||
concentration, |
−25.0 |
|
|
|
|
|
|
|
|
|
|
|
|
|
|
|
|
|
|
|
|
|
|
|
|
HA900 |
|
|
||||
|
|
|
|
|
|
|
|
|
|
|
|
|
|
|
|
|
|
|
|
|
|
|
|
|
|
|||||||
|
−10.0 |
|
|
|
|
|
|
|
|
|
|
|
|
|
|
|
|
|
|
|
|
|
|
|
|
|
|
|
|
|
|
|
|
|
|
|
|
|
|
|
|
|
|
|
|
|
|
|
|
|
|
|
|
|
|
|
|
|
|
|
|
|
|
|
|
|
−15.0 |
|
|
|
|
|
|
|
|
|
|
|
|
|
|
|
|
|
|
|
|
|
|
|
|
|
|
|
|
|
|
|
|
|
|
|
|
|
|
|
|
|
|
|
|
|
|
|
|
|
|
|
|
|
|
|
|
|
|
|
|
|
|
|
|
|
−20.0 |
|
|
|
|
|
|
|
|
|
|
|
|
|
|
|
|
|
|
|
|
|
|
|
|
|
|
|
|
|
|
|
Ca |
−30.0 |
|
|
|
|
|
|
|
|
|
|
|
|
|
|
|
|
|
|
|
|
|
|
|
|
|
|
|
|
|
|
|
|
|
|
|
|
|
|
|
|
|
|
|
|
|
|
|
|
|
|
|
|
|
|
|
|
|
|
|
|
|
|
||
|
−35.0 |
|
|
|
|
|
|
|
|
|
|
|
|
|
|
|
|
|
|
|
|
|
|
|
|
|
|
|
|
|
|
|
|
|
|
|
|
|
|
|
|
|
|
|
|
|
|
|
|
|
|
|
|
|
|
|
|
|
|
|
|
|
|
|
|
|
−40.0 |
|
|
|
|
|
|
|
|
|
|
|
|
|
|
|
|
|
|
|
|
|
|
|
|
|
|
|
|
|
|
|
|
|
|
|
|
|
|
|
|
|
|
|
|
|
|
|
|
|
|
|
|
|
|
|
|
|
|
|
|
|
|
|
|
|
0 |
20 |
40 |
60 |
80 |
100 |
120 |
|
140 |
160 |
180 |
|||||||||||||||||||||
Time, h
Figure 15. The Ca concentration in SBF versus immersion time for the HA group sintered at temperature indicated.
|
25.0 |
|
|
|
|
|
|
|
|
|
|
|
20.0 |
|
|
|
|
|
|
|
SHA700 |
||
mM |
15.0 |
|
|
|
|
|
|
|
SHA800 |
||
10.0 |
|
|
|
|
|
|
|
SHA900 |
|||
concentration, |
|
|
|
|
|
|
|
||||
5.0 |
|
|
|
|
|
|
|
|
|
|
|
0.0 |
|
|
|
|
|
|
|
|
|
|
|
−5.0 |
|
|
|
|
|
|
|
|
|
|
|
−10.0 |
|
|
|
|
|
|
|
|
|
|
|
Ca |
−15.0 |
|
|
|
|
|
|
|
|
|
|
|
−20.0 |
|
|
|
|
|
|
|
|
|
|
|
−25.0 |
|
|
|
|
|
|
|
|
|
|
|
0 |
20 |
40 |
60 |
80 |
100 |
120 |
140 |
160 |
180 |
200 |
|
|
|
|
|
|
Time, h |
|
|
|
|
|
Figure 16. The Ca concentration in SBF versus immersion time for the SHA group sintered at temperature indicated.
critically dependent on the crystal structures developed in the HA samples.
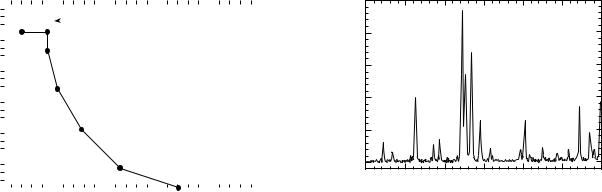
Figure 17 represents the Ca concentration in the solution as a function of immersion time for samples Nos. 1, 2, and 3. All these samples are commercial HA heat treated at 700 8C for 30 min. Therefore, these samples are of the same structural crystallinity, but with different specific surface areas. Sample No. 3 has the highest SSA; Sample No. 1 has the lowest SSA; and Sample No. 2 is in the middle. They were tested at a ratio of 1 mg mL 1 SBF. It is apparent in Fig. 17 that the rates of precipitation are highly dependent on the surface area. From these kinetic curves, the initial
|
2.0 |
|
|
|
|
|
|
|
0.0 |
|
|
|
|
#1 |
|
|
|
|
|
|
#2 |
|
|
M |
|
|
|
|
|
|
|
2.0 |
|
|
|
|
#3 |
|
|
m |
|
|
|
|
|
||
|
|
|
|
|
|
|
|
concentration |
4.0 |
|
|
|
|
|
|
6.0 |
|
|
|
|
|
|
|
8.0 |
|
|
|
|
|
|
|
10.0 |
|
|
|
|
|
|
|
Ca |
|
|
|
|
|
|
|
|
|
|
|
|
|
|
|
|
12.0 |
|
|
|
|
|
|
|
14.0 |
|
|
|
|
|
|
|
0 |
2 |
4 |
6 |
8 |
10 |
12 |
Time, h
Figure 17. The Ca concentration in the solution as a function of immersion time for samples No. 1, No. 2, and No. 3.
|
3.5 |
|
|
|
|
|
|
|
3.3 |
|
|
|
|
|
|
–1 |
3.1 |
|
|
|
|
|
|
2.9 |
|
|
|
|
|
|
|
h |
|
|
|
|
|
|
|
M |
|
|
|
|
|
|
|
2.7 |
|
|
|
|
|
|
|
m |
2.5 |
|
|
|
|
|
|
Rate, |
|
|
|
|
|
|
|
2.3 |
|
|
|
|
|
|
|
|
|
|
|
|
|
|
|
Initial |
2.1 |
|
|
|
|
|
|
1.9 |
|
|
|
|
|
|
|
|
|
|
|
|
|
|
|
|
1.7 |
|
|
|
|
|
|
|
1.5 |
|
|
|
|
|
|
|
24 |
24.5 |
25 |
25.5 |
26 |
26.5 |
27 |
|
|
|
Surface Area, m2 |
|
|
||
Figure 18. Initial reaction rate versus specific area for the samples showing in Fig. 17.
rate of precipitation, R0, was determined by the slope of the first two data points. As shown in Fig. 18, there is a linear relationship between the initial precipitation rate and the surface area.
Figure 19 is a plot of Ca concentration versus immersion time for HA, HA600, SHA800, and SHA900. Samples of each group have been selected to have the same surface area. As can be seen, the initial rates of HAs and SHAs separate into two branches. The HA group exhibits an initial gradual decrease, while that of SHA group increases quite rapidly. However, as can also be seen in this figure, calcium concentration of SHA800 initially increases, but reaches a peak at 3 h, and thereafter decreases. In SHA900, although with a different rate, the calcium concentration always increases up to 9 h. Therefore, it can be concluded that the specific surface area is not the only factor that affects the reaction behavior of various HA samples. As discussed later, the degree of crystillinity in fact plays an even more important role in the reaction rates. The SHA700 sample behaves similarly to HA and HA600 with a slow reaction rate as can be seen in (Fig. 19). However, the reaction behaviors of SHA800 and SHA900 significantly differ from the HA samples. During the first hour, an increase of Ca concentration was measured indicating that dissolution of SHA800 and SHA900 has surpassed the new phase formation. It is noted that the rise in super-
|
30 |
|
|
|
|
|
|
|
|
mM |
25 |
|
|
|
|
|
|
|
|
20 |
|
|
|
|
|
|
|
|
|
concentration, |
15 |
|
|
|
|
|
|
|
|
10 |
|
|
|
|
|
|
|
|
|
5 |
|
|
|
|
|
|
|
|
|
0 |
|
|
|
|
|
|
SHA800 |
|
|
−5 |
|
|
|
|
|
|
SHA900 |
|
|
Ca |
−10 |
|
|
|
|
|
|
HA600 |
|
|
−15 |
|
|
|
|
|
|
HA |
|
|
−20 |
|
|
|
|
|
|
|
|
|
0 |
2 |
4 |
6 |
8 |
10 |
12 |
14 |
16 |
Time, h
Figure 19. The Ca concentration versus immersion time for some of the typical HA and SHA samples.
362 BIOMATERIALS, TESTING AND STRUCTURAL PROPERTIES OF
Figure 20. The SEM photograph showing the surface morphology of the SHA700 immersed in SBF for 1 week.
saturation for SHA900 is greater than that for SHA800. The ion uptake takes place after this initial dissolution. Another difference between HA and SHA series is that the latter took longer time to reach the solid–solution equilibrium stage, clearly indicating a slower reaction rate in the HA series. These results suggest that the dissolution and precipitation rates are critically dependent on the crystal structures developed in the HA samples.
Figures 20 and 21 are surfaces of SHA700 and SHA900 coatings after immersion in SBF for 1 week and 9 weeks, respectively. As can be seen, the morphology of these two surfaces is quite different. The SHA700 coating is fully converted to flake shape with an average diameter of 1–10 mm. The surface of the flakes exhibits fine, needlelike structures within 1 week, which have been identified to be HCA by IR analysis. For SHA900 coating, after 9 weeks of immersion in SBF, a layer of precipitation has been observed under high magnification, which is shown to be amorphous or poorly crystallized new phase instead of HCA.
Figure 21. The SEM photograph showing the surface morphology of the SHA900 immersed in SBF for 9 weeks.
Figure 22 shows the FTIR spectra of HA and SHA samples after immersion in SBF at time periods up to 1 week. The absorption bands at 1460 cm 1 (high C¼O region) and 872 cm 1 (low CO region) are characteristic features of HCA (8). As can be seen from spectrum of HA (Fig. 22a), these bands became significantly greater after 76 h of immersion indicating an increase in carbonate content. A gradual reduction of the splitting of the major PO43 absorption bands (1100–1000 and 600–550 cm 1) with immersion time is also observed, suggesting the formation of amorphous or fine, poorly crystallized new phases. For HA900, a broad band appears in the high energy C¼O region (Fig. 22b). However, the low energy C¼O band at 872 cm 1 is not recorded. At the same time, a gradual reduction of the splitting of the major PO43 bands is observed, indicating again the formation of amorphous or fine, poorly crystallized new phases. The HCA phase cannot be identified from these weak bands, and it is likely that some intermediate phases other than HCA have formed. The HCA peaks have appeared in the spectra of SHA700 within 7 days (Fig. 22c). A time-dependent increase in the carbonate band intensities accompanied by a reduction of splitting of the major PO43 bands is again recorded. Similar changes have occurred in the spectra of immersed SHA800 (Fig. 22d). However, no characteristic HCA peaks are recorded for SHA900 up to 3 weeks, only a broad band has appeared in the high energy C¼O region (Fig. 22c). This trend seems to indicate that the reactivity of HA is considerably reduced at higher temperatures.
DISCUSSION
Structural Effects
The results indicate that in vitro behavior of the HA coatings is strongly affected by the structural characteristics induced by heat treatment. The SBF used in this work represents physiological ion concentration in human body, and it is supersaturated with respect to HA. In this chemical environment, HA is the most stable phase among all the calcium phosphate phases, thus the HCA formation is thermodynamically possible. However, only HA, HA600, and SHA700 have led to immediate Ca ions uptake. The HA900, SHA800, and SHA900 samples show a partial dissolution prior to precipitation. The difference in the dissolution ability of the HA samples is not the only factor in bioactivity. Figure 10 shows XRD spectra of HA sintered at different temperatures in the range of 600–900 8C. The structural evolution begins from an amorphous state in the commercial HA. Crystalline phase started to form at 600 8C, and all peaks were attributed to the HA phase. In addition, relative peak intensities are in agreement with the expected values for HA. Therefore, it can be decided that the structure consists primarily of crystalline HA, no additional peaks were observed to appear at any firing temperatures. However, the peak shift could be noted by comparing with the standard XRD spectra of HA. At lower temperatures, the shift was considerable suggesting great lattice distortion. The breadth of the peaks was used as an indicator of crystal dimension in the direction perpendicular to the diffracting plane hkl. The crystal size D is
BIOMATERIALS, TESTING AND STRUCTURAL PROPERTIES OF |
363 |
Figure 22. The FTIR spectra of HA and SHA samples after immersion in SBF for the time indicated.
inversely proportional to the peak breadth according to the Scherer equation. The contribution to the peak breadth from instrumental broadening was determined to be0.12 8C (0.002 rad), independent of 2u. This amount subtracted from the total experimental width is the value of true broadening, assuming the two contributions add linearly. The peak breadth (D002) is given as a function of temperature in (Fig. 23). It can be seen that the peak breadth decreases with sintering temperature, indicating that the crystal size increases with increasing sintering temperature, from 600 to 900 8C. On the basis of above analysis, the important difference with annealing temperature was the size of the individual crystals and the amount of crystal defects.
It is possible that the crystal growth rate is controlled by more than one of the elementary rate controlling mechanisms. The rate controlling process can change depending on particle size, solution concentration, and surface properties of the crystallites. The mechanisms of crystal growth are usually interpreted from measured reaction rates at different driving forces or from the activation energies of reactions. It is common practice to fit the data to an empirical rate law, which is represented by simple empirical kinetics (9):
Rg ¼ kgssn |
ð2Þ |
where kg is the rate constant for crystal growth, s is a function of the total number of available growth sites, is the degree of supersaturation, and n is the effective order of reaction. A broad empirical test for growth mechanism can be achieved from a logarithmic plot of Eq. 2. From the n
value, the probable mechanism can be deduced. It is possible that the crystal growth rate is controlled by more than one of the elementary rate controlling mechanisms listed above. Under these circumstances, the rate-limiting steps are dependent on the jump frequency of lattice ions: (1) through the solution for mass transport control; (2) to the crystal surface for adsorption control, or (3) along the crystal surface or into a crystal lattice kink site for spiral and polynuclear control. The rate controlling process can change depending on particle size, solution concentration, and surface properties of the crystallites. A broad empirical
4.5
4
units |
3.5 |
|
|
|
|
|
3 |
|
|
|
|
|
|
arb. |
|
|
|
|
|
|
2.5 |
|
|
|
|
|
|
Breadth, |
|
|
|
|
|
|
2 |
|
|
|
|
|
|
1.5 |
|
|
|
|
|
|
Peak |
|
|
|
|
|
|
1 |
|
|
|
|
|
|
|
0.5 |
|
|
|
|
|
|
0 |
|
|
|
|
|
|
500 |
600 |
700 |
800 |
900 |
1000 |
Processing Temperature, °C
Figure 23. The X-ray diffraction peak breadth versus processing temperature for the HA synthesized in this study.
364 BIOMATERIALS, TESTING AND STRUCTURAL PROPERTIES OF
test for growth mechanism can be achieved by plotting the data according to Eq. 2. An effective order reaction in the range 0< n< 1.2, n 2, or n> 2.5 indicates that the rate controlling process is one of adsorption and /or mass transport, surface spiral, or polynucleation, respectively
(9). Experimentally, it is found that the growth rates of the calcium phosphates are insensitive to changes in fluid dynamics indicating surface controlling mechanisms rather than mass transport of ions to the crystal surfaces. A dynamic fluid may effect the growth rate, but not in a pronounced fashion. However, in our experiment, we found the growth to be insensitive. But we have no comparison of growth rates in both static and dynamic fluids.
Temperature Dependence of Activation Energy
Activation energies, obtained from experiments at different temperatures, can be used to differentiate between volume diffusion and surface controlled processes. The activation energy for volume diffusion, reflecting the temperature dependence of the diffusion coefficient, usually lies between 16 and 20 kJ mol 1, while for a surface reaction the value may be in excess of 35 kJ mol 1. If a reaction has activation energy of < 20 kJ mol 1, it is safe to assume that it is overwhelmingly controlled by volume diffusion. However, if the activation energy is higher than 35 kJ mol 1, it is quite certain that an adsorption process predominates. In all other cases, both adsorption and volume diffusion mechanisms may participate for a first-order reaction (10).
Figure 17 represents the Ca concentration in solutions as a function of immersion time at different surface areas. These samples were the same kind of powders to ensure that they have the same crystal structure and surface morphology; while the ratio of surface area to volume of SBF was different. It is apparent in Fig. 17 that the rates of precipitation were highly dependent on the surface area. Based on the empirical kinetics in Eq. 2, to build a relationship between the reaction rate Rg and surface area s, the degree of supersaturation s should be kept at a constant value. The corresponding reaction rates were calculated by a simple fitting procedure from the above kinetic plots. As shown in Fig. 18, there was a linear relationship between the precipitation rates and the total surface area, which is in agreement with the above empirical kinetics equation. This result also showed that crystallization occurred only on the added seed materials without any secondary nucleation or spontaneous precipitation. Furthermore, the advantage of porous bioceramics over dense bioceramics was proved by this relationship.
The initial precipitation rate was not used here because of the following considerations. First, the empirical fitting procedure used to calculate R0 is greatly affected by the slower rates occurring after the initial fast stage of the precipitation process. Thus, the fitting data could not represent the true initial rate. Second, initial rate was a complicated factor. Rapid adjustment of surface composition usually happened when the solids were introduced into the growth or dissolution media. In the case of HA, initial uptaking surges were observed, which might be attributed to calcium ion adsorption. Therefore, considerable uncertainties can arise if too much emphasis is placed upon initial rates of reaction.
Another point needed to be noted was that in this test, the different surface areas were not originated from the distribution of particle sizes, considering that different particle sizes might bring in the factor of surface morphology, which has great influence on the reaction rate. The effect of particle size would be demonstrated later. In the current method, the same powders were used, so that the factor of morphology was eliminated and a linear relationship was obtained.
The particles of different sizes behaved differently under the same surface area to volume (SA/V) test conditions. When comparing the 40–100-mesh and < 200-mesh particles at SA/V of 0.02 m2 mL 1, it is apparent that the Ca adsorption rate is slower for the smaller particles. This may be attributed to physical differences such as the radius of curvature and surface roughness.
Figure 19 is a plot of Ca concentration verses immersion time for HA, HA600, and SHA800, SHA900. Samples of each group were tested under the same SA/V ratio. As can be seen, the initial rate of HA was greater than that of HA600; the behavior of SHA800 differed from the one of SHA900. Therefore, it is concluded that the specific surface area is not the only reason that affects the reaction behavior of various HA powders, the degree of crystallinity also plays an important role in their reaction rates.
Chemical reactions, specifically in this case, the process of nucleation and crystal growth from solution, is described as an activated process with temperature, which is repre-
sented by the following relationship: |
|
|
|
||||
rate |
/ |
exp |
Ea |
|
ð |
3 |
Þ |
|
|||||||
|
kT |
|
|||||
where Ea is the activation energy, so that reaction rate increases exponentially with temperature increase. The reaction rate constant K is related to temperature by an Arrhenius equation:
K |
¼ |
K |
exp |
|
Ea |
|
4 |
Þ |
|
|
|||||||
|
0 |
|
kT |
ð |
||||
By keeping s at a constant value, plot lnR versus 1/T, the slope of the curve will be Ea/k, and consequently Ea can be calculated.
According to the procedures described above, the activation energy for HA, HA600, HA900, and SHA700 was calculated. The parameter s was selected at DCa ¼ 8mM for all the reaction temperatures. The computed activation energy was listed in Table 3. The above results showed that the activation energy increased with the sintering temperature for HA powders. The activation energy of synthesized HA700 was much higher than those of HA and HA600.
In Vitro Biochemistry Behavior of Hydroxyapatite
The formation of biological apatite on the surface of implanted synthetic calcium phosphate ceramics goes
Table 3. Activation Energies for the Samples Indicated
Samples |
Activation energy, kJ |
|
mol 1 |
|
|
|
|
HA |
66.3 |
|
|
HA600 |
80.3 |
|
|
HA900 |
172.7 |
|
|
SHA700 |
130.4 |
|
|
|
|
|
|
BIOMATERIALS, TESTING AND STRUCTURAL PROPERTIES OF |
365 |
through a sequence of chemical reactions. It has been shown that the reaction rate in vitro appears to correlate with the rate of apatite mineral formation in vivo.
Therefore, the laboratory observations can be projected to the in vivo situation. The in vitro behavior of bioceramics is determined by its stability at ambient and body temperatures. Many factors have significant influence on their stability, including the pH and supersaturation of the solution, crystallinity, structure defects, and porosity of the material (11,12). Driessens (13) showed that, among the phases composed of calcium and phosphate, hydroxyapatite is the most stable at room temperature when in contact with SBF, which was used to represent the ionic concentrations of plasma. Generally, SBF will initiate a partial dissolution of the HA material causing the release of Ca2þ, HPO42 , and PO43 , and increasing the supersaturation of the microenvironment with respect to HA phase that is stable in this environment. Following this initial dissolution is the reprecipitation. Carbonate ions, together with other electrolytes, which are from the biological fluids, become incorporated in the new apatite microcrystals forming on the surfaces of the HA.
Since any clinical use of calcium phosphate bioceramics involves contact with water, it is important to understand the stability of HA in the presence of water at ambient temperatures. As Driessens showed (13), there were only two classes of calcium phosphate materials that were stable at room temperature when in contact with aqueous solution. Temperature, ionic strength, and pH are major parameters influencing the stability of calcium phosphate. In the body, temperature and ion strength are constant, therefore, the pH value at the local tissue determines which form of calcium phosphate is the most stable. At a pH < 4.2, the component CaHPO4 2H2O was the most stable, while at higher pH (> 4.2), HA was the stable phase. However, HA does not form at the first place. Other mineral phases such as dicalcium phosphate dihydrate (DCPD), octacalcium phosphate (OCP), and amorphous tricalcium phosphate (TCP) form as precursor phases that transform to HA.
Therefore, in this in vitro test, at biological pH value, only HA or its precursor phase can be found in contact with SBF. It is believed that synthetic HA ceramic surfaces can be transformed to biological apatite through a set of reactions including dissolution, precipitation, and ion exchange. Following the introduction of HA to SBF, a partial dissolution of the surface is initiated causing the release of Ca2þ, HPO42 , and PO43 , which increases the supersaturation of the microenvironment with respect to the stable (HA) phase. Carbonated apatite can form using the calcium and phosphate ions released from partially dissolving ceramic HA and from the biological fluids that contain other electrolytes, such as CO32 and Mg2þ. These become incorporated in the new CO3- apatite microcrystals forming on the surfaces of ceramic HA crystals. The in vitro reactivity of HA is governed by a number of factors, which can be considered from the two aspects: in vitro environment and properties of HA material.
CONCLUSIONS
In order to produce highly strengthened porous bioactive materials for bone substitutes, suspension method and
thermal deposition method, were employed to coat the inner-pore surfaces of a porous ceramic substrate. A thin layer of HA has been uniformly coated onto inner-pore surfaces of reticulated alumina substrates. The in vitro bioactivity of HA coatings was found to be strongly affected by structure characteristics, which are a combination of crystallinity and specific surface area. The bioactivity is reduced at a higher degree of crystallinity, which is likely related to the higher driving force for the formation of a new phase, and the reaction rate was proportional to the surface area. The surface morphology and HA treating temperature also have a direct affect on the reaction rates of the HA coatings. The calcium absorption rate is slower for smaller particles; this could be attributed to physical differences including radius of curvature and surface roughness. The activation energy increased with the heat-treatment temperature for HA powders.
BIBLIOGRAPHY
Cited References
1.Shinzato S, et al. Bioactive bone cement: Effect of silane treatment on mechanical properties and osteoconductivity. J Biomed Mater Res 2001;55(3):277–284.
2.Hench LL. Introduction to Bioceramics. Singapore: World Scientific; 1993. p 139–180.
3.Barth E, Hero H. Bioactive glass ceramic on titanium substrate: the effect of molybdenum as an intermediate bond coating. Biomaterials 1986;7(4):273–276.
4.Kasuga T, et al. Bioactive calcium phosphate invert glassceramic coating on beta-type Ti-29Nb-13Ta-4.6Zr alloy. Biomaterials 2003;24(2):283–290.
5.Livingston T, Ducheyne P, Garino J. In vivo evaluation of a bioactive scaffold for bone tissue engineering. J Biomed Mater Res 2002;62(1):1–13.
6.Roy DM, Linnehan SK. Hydroxyapatite formed from coral skeletal carbonate by hydrothermal exchange. Nature (London) 1974;247(438):220–222.
7.Holmes R, et al. A coralline hydroxyapatite bone graft substitute. Preliminary report. Clin Orthop 1984;188:252– 262.
8.Radin SR, Ducheyne P. The effect of calcium phosphate ceramic composition and structure on in vitro behavior. II. Precipitation. J Biomed Mater Res 1993;27(1):35–45.
9.Nielsen AE. Electrolyte Crystal Growth Mechanisms. J Crystal Growth 1984;67: 289–310.
10.Gengwei J. Development of Bioactive Materials using Reticulated Ceramics for Bone Substitue. Ph. D. dissertation, University of Cincinnati; 2000. p 118.
11.Margolis HC, Moreno EC. Kinetics of hydroxyapatite dissolution in acetic, lactic, and phosphoric acid solutions. Calcif Tissue Int 1992;50(2):137–143.
12.Christoffersen J, Christoffersen MR. Kinetics of Dissolution of Calcium Hydroxyapatite. 5. The Acidity Constant for the Hydrogen Phosphate Surface Complex. J Crystal Growth 1982;57: 21–26.
13.Driessens FCM. Formation and Stability of Calcium Phosphates in Relation to the Phase Composition of the Mineral in Calcified Tissues. In: de Groot K, editor. Bioceramics of Calcium Phosphate. Boca Raton, (FL): CRC Press; 1983; p 1–31.
See also BIOMATERIALS, CORROSION AND WEAR OF; NUCLEAR MAGNETIC RESONANCE SPECTROSCOPY; POROUS MATERIALS FOR BIOLOGICAL APPLICATIONS.