

- •VOLUME 1
- •CONTRIBUTOR LIST
- •PREFACE
- •LIST OF ARTICLES
- •ABBREVIATIONS AND ACRONYMS
- •CONVERSION FACTORS AND UNIT SYMBOLS
- •ABLATION.
- •ABSORBABLE BIOMATERIALS.
- •ACRYLIC BONE CEMENT.
- •ACTINOTHERAPY.
- •ADOPTIVE IMMUNOTHERAPY.
- •AFFINITY CHROMATOGRAPHY.
- •ALLOYS, SHAPE MEMORY
- •AMBULATORY MONITORING
- •ANALYTICAL METHODS, AUTOMATED
- •ANALYZER, OXYGEN.
- •ANESTHESIA MACHINES
- •ANESTHESIA MONITORING.
- •ANESTHESIA, COMPUTERS IN
- •ANGER CAMERA
- •ANGIOPLASTY.
- •ANORECTAL MANOMETRY
- •ANTIBODIES, MONOCLONAL.
- •APNEA DETECTION.
- •ARRHYTHMIA, TREATMENT.
- •ARRHYTHMIA ANALYSIS, AUTOMATED
- •ARTERIAL TONOMETRY.
- •ARTIFICIAL BLOOD.
- •ARTIFICIAL HEART.
- •ARTIFICIAL HEART VALVE.
- •ARTIFICIAL HIP JOINTS.
- •ARTIFICIAL LARYNX.
- •ARTIFICIAL PANCREAS.
- •ARTERIES, ELASTIC PROPERTIES OF
- •ASSISTIVE DEVICES FOR THE DISABLED.
- •ATOMIC ABSORPTION SPECTROMETRY.
- •AUDIOMETRY
- •BACTERIAL DETECTION SYSTEMS.
- •BALLOON PUMP.
- •BANKED BLOOD.
- •BAROTRAUMA.
- •BARRIER CONTRACEPTIVE DEVICES.
- •BIOCERAMICS.
- •BIOCOMPATIBILITY OF MATERIALS
- •BIOELECTRODES
- •BIOFEEDBACK
- •BIOHEAT TRANSFER
- •BIOIMPEDANCE IN CARDIOVASCULAR MEDICINE
- •BIOINFORMATICS
- •BIOLOGIC THERAPY.
- •BIOMAGNETISM
- •BIOMATERIALS, ABSORBABLE
- •BIOMATERIALS: AN OVERVIEW
- •BIOMATERIALS: BIOCERAMICS
- •BIOMATERIALS: CARBON
- •BIOMATERIALS CORROSION AND WEAR OF
- •BIOMATERIALS FOR DENTISTRY
- •BIOMATERIALS, POLYMERS
- •BIOMATERIALS, SURFACE PROPERTIES OF
- •BIOMATERIALS, TESTING AND STRUCTURAL PROPERTIES OF
- •BIOMATERIALS: TISSUE-ENGINEERING AND SCAFFOLDS
- •BIOMECHANICS OF EXERCISE FITNESS
- •BIOMECHANICS OF JOINTS.
- •BIOMECHANICS OF SCOLIOSIS.
- •BIOMECHANICS OF SKIN.
- •BIOMECHANICS OF THE HUMAN SPINE.
- •BIOMECHANICS OF TOOTH AND JAW.
- •BIOMEDICAL ENGINEERING EDUCATION
- •BIOSURFACE ENGINEERING
- •BIOSENSORS.
- •BIOTELEMETRY
- •BIRTH CONTROL.
- •BLEEDING, GASTROINTESTINAL.
- •BLADDER DYSFUNCTION, NEUROSTIMULATION OF
- •BLIND AND VISUALLY IMPAIRED, ASSISTIVE TECHNOLOGY FOR
- •BLOOD BANKING.
- •BLOOD CELL COUNTERS.
- •BLOOD COLLECTION AND PROCESSING
- •BLOOD FLOW.
- •BLOOD GAS MEASUREMENTS
- •BLOOD PRESSURE MEASUREMENT
- •BLOOD PRESSURE, AUTOMATIC CONTROL OF
- •BLOOD RHEOLOGY
- •BLOOD, ARTIFICIAL
- •BONDING, ENAMEL.
- •BONE AND TEETH, PROPERTIES OF
- •BONE CEMENT, ACRYLIC
- •BONE DENSITY MEASUREMENT
- •BORON NEUTRON CAPTURE THERAPY
- •BRACHYTHERAPY, HIGH DOSAGE RATE
- •BRACHYTHERAPY, INTRAVASCULAR
- •BRAIN ELECTRICAL ACTIVITY.
- •BURN WOUND COVERINGS.
- •BYPASS, CORONARY.
- •BYPASS, CARDIOPULMONARY.

490 BLOOD PRESSURE, AUTOMATIC CONTROL OF
Table 2. Summary of Accuracy of Blood Pressure
Measurement Devices
|
|
|
|
Recommended? |
|
|
Number |
|
|
|
|
|
|
|
|
|
|
Device Type |
Surveyed |
Yes |
Questionable |
No |
|
|
|
|
|
|
|
Manual, clinical |
4 |
1 |
1 |
2 |
|
Auto, clinical |
6 |
3 |
2 |
1 |
|
Auto, home, arm |
20 |
4 |
4 |
12 |
|
Auto, home, wrist |
4 |
0 |
2 |
2 |
|
Ambulatory |
50 |
26 |
5 |
19 |
|
Total |
84 |
34 |
14 |
36 |
|
|
|
|
|
|
|
Yet, most devices in the market have not been evaluated for accuracy independently, using the established protocols (18). In their study, O’Brien et al. surveyed published independent evaluations of manual sphygmomanometers, automated devices for clinical use, and automated devices for personal use. If a device was found acceptable by AAMI standards, and received a grade of A or B by BHS standards, for both systolic and diastolic measurements, then it was ‘‘recommended’’. Otherwise it was not recommended. Few studies they surveyed had issues such as specificity, so devices reported in those studies were ‘‘questionably recommended.’’
Table 2 summarizes the result of their survey. It is interesting to note that of the four clinical grade sphygmomanometers, a kind that is highly regarded by health-care providers, only one was ‘‘recommended’’. Overall, the number of devices ‘‘not recommended’’ is more than the number of ‘‘recommended’’ devices. What one should take away from this analysis is that at every level of quality, price, and target market, it is essential to research the accuracy of a device before investing in it and relying on it.
BIBLIOGRAPHY
Cited References
1.Gibbs NC, Gardner RM. Dynamics of invasive pressure monitoring systems: Clinical and laboratory evaluation. Heart Lung 1988;17:43–51.
2.Webster JG, editor. Medical Instrumentation: Application and Design, 3rd ed. New York: Wiley; 1998.
3.Hambly P. Measuring the blood pressure. Update Anaesthesia 2000;11(6).
4.Philips Invasive Monitoring literature. Available at http:// www.medical.philips.com/main/products/patientmonitoring/ products/invasivepressure/.
5.Colak S, Isik C. Blood pressure estimation using neural networks. IEEE International Conference on Computational Intelligence for Measurement Systems and Applications, Boston, July 2004.
6.Colak S, Isik C. Fuzzy pulse qualifier. 23rd International Conference of the North American Fuzzy Information Processing Society (NAFIPS 2004) Proceedings, Banff, June 2004.
7.Osowski S, Linh TH. ECG beat recognition using fuzzy hybrid neural network. IEEE Trans Biomed Eng 2001;48:1265– 1271.
8.Revision Labs, Beaverton, OR, Noninvasive Blood Pressure Measurement and Motion Artifact: A Comparative Study, December 3, 1998. Available at http://www.monitoring.welchallyn.com/pdfs/smartcufwhitepaper.pdf.
9.Dowling Jr NB. Measuring blood pressure in noisy environments. US patent No. 6,258,037 B1, July 10, 2001.
10.Sato T, Nishinaga M, Kawamoto A, Ozawa T, Takatsuji H. Accuracy of a continuous blood pressure monitor based on arterial tonometry. Hypertension 1993;21:866–874.
11.Matthys K, Verdonck P. Development and modelling of arterial applanation tonometry: A review. Technol Health Care 2002;10:65–76.
12.Williams B. Pulse wave analysis and hypertension: Evangelism versus skepticism. J Hypertension 2004;22:447–449.
13.Yang BH, Asada HH, Zhang Y. Cuff-less continuous monitoring of blood pressure, d’Arbeloff Laboratory of Information Systems and Technology, MIT, Progress Report No. 2–5, March 31, 2000. Available at http://darbelofflab.mit.edu/Pro- gressReports/HomeAutomation/Report2-5/Chapter01.pdf.
14.Rhee S, Yang BH, Asada HH. Artifact-resistant powerefficient design of finger-ring plethysmographic sensors. IEEE Trans Biomed Eng 2001;48:795–805.
15.McGrath BP. Ambulatory blood pressure monitoring. Med J Australia 2002;176:588–592.
16.National High Blood Pressure Education Program (NHBPEP) Working Group Report On Ambulatory Blood Pressure Monitoring. NIH Publication 92-3028. Reprinted February 1992. Available at http://www.nhlbi.nih.gov/health/prof/heart/ hbp/abpm.txt.
17.O’Brien E, Pickering T, Asmar R, Myers M, Parati G, Staessen J, Mengden T, Imai Y, Waeber B, Palatini P. Working Group on Blood Pressure Monitoring of the European Society of Hypertension International Protocol for validation of blood pressure measuring devices in adults. Blood Pressure Monitoring 2002;7:3–17. Available at http://www.eshonline.org/ documents/InternationalPS2002.04.29.pdf.
18.O’Brien E, Waeber B, Parati G, Staessen J, Myers MG. Blood pressure measuring devices: Recommendations of the European Society of Hypertension. Br Med J 2001;398. Available at http://bmj.bmjjournals.com/cgi/content/full/322/7285/531.
Further Reading
O’Brien E, Atkins N, Staessen J. State of the market: A review of ambulatory blood pressure monitoring devices. Hypertension 1995;26:835–842.
U.S. Food And Drug Administration. Non-Invasive Blood Pressure (NIBP) Monitor Guidance. March 10, 1997. Available at http:// www.fda.gov/cdrh/ode/noninvas.html.
See also ARTERIES, ELASTIC PROPERTIES OF; BLOOD PRESSURE, AUTOMATIC CONTROL OF; CAPACITIVE MICROSENSORS FOR BIOMEDICAL APPLICATIONS;
LINEAR VARIABLE DIFFERENTIAL TRANSFORMERS.
BLOOD PRESSURE, AUTOMATIC CONTROL OF
YIH-CHOUNG YU
Lafayette College
Easton, Pennsylvania
INTRODUCTION
Arterial pressure is one of the vital indexes of organ perfusion in human bodies. Generally speaking, blood pressure is determined by the amount of blood the heart pumps and the diameter of the arteries receiving blood from the heart. Several factors influence blood pressure. The
nervous system helps to maintain blood pressure by adjusting the size of the blood vessels, and by influencing the heart’s pumping action. The heart pumps blood to make sure a sufficient amount of blood circulates to all the body tissues for organ perfusion. The more blood the heart pumps and the smaller the arteries, the higher the blood pressure is. The kidneys also play a major role in the regulation of blood pressure. Kidneys secrete the hormone rennin, which causes arteries to contract, thereby raising blood pressure. The kidneys also control the fluid volume of blood, either by retaining salt or excreting salt into urine. When kidneys retain salt in the bloodstream, the salt attracts water, increasing the fluid volume of blood. As a higher volume of blood passes through arteries, it increases blood pressure.
Hypertension is defined as abnormal high systemic arterial blood pressure, systolic and diastolic arterial pressures > 140 and 95 mmHg (18.662 and 12.664 kPa). The causes of hypertension might be due to acute myocardial infarction, congestive heart failure, and malignant hypertension. Postoperative cardiac patients may experience hypertension because of pain, hypothermia, reflex vasoconstriction from cardiopulmonary bypass, derangement of the rennin-angiotension system, and ventilation difficulties. A prolonged postoperative hypertension could lead to complications, including myocardial ischemia, myocardial infarction, suture line rupture, excessive bleeding, and arrhythmia. As a result, clinical treatment to postoperative hypertension is needed to reduce the potential risk of complications.
Postoperative hypertension is usually treated pharmacologically in the intensive care unit (ICU). Sodium nitroprusside (SNP) is one of the most frequently used pharmaceutical agents to treat hypertensive patients and is a vasodilating drug that can reduce the peripheral resistance of the blood vessel, and thus causes the reduction of arterial blood pressure. A desired mean arterial pressure (MAP) can be achieved by monitoring MAP and regulating the rate of SNP infusion. The mean arterial pressure can be measured from a patient by using an arterial pressure transducer with appropriate signal amplification. Low pass filtering is used to remove high frequency noise in the pressure signal and provide MAP for monitoring purpose. Administration of SNP infusion could be performed by manual operation. The drug infusion rate should be adjusted frequently in response to the spontaneous pressure variation and patient’s condition changes. In addition, blood pressure response to the drug infusion changes over time and varies from patient to patient. Therefore, this manual approach is extremely difficult and time consuming for the ICU personnel. As the result, the use of control techniques to regulate the infusion of the pharmaceutical agents and maintain MAP within a desired level automatically has been developed in the last 30 years.
IVAC Corporation developed an automatic device, TITRATOR, to infuse SNP and regulate MAP in postoperative cardiac patients in early 1990s. Clinical evaluation for the clinical impact of this device in multiple centers was reported by Chitwood et al. (1). Patients who participate in this trial were treated by either automatic or
BLOOD PRESSURE, AUTOMATIC CONTROL OF |
491 |
manual control. The automated group showed a significant reduction in the number of hypertensive episodes per patient. Chest tube drainage, percentage of patients receiving transfusion, and total amount transfused were all reduced significantly by the use of an automated titration system. Although TITRATOR was not commercialized successfully due to economic reasons, the promising clinical experiences encouraged future development of automatic blood pressure regulation devices.
An automatic blood pressure control system usually includes three components: sensors, a controller, and a drug delivery pump. This article provides an overview of automatic control schemes, including proportional- integral-derivative (PID) controllers, adaptive-controllers, rule-based controllers, and artificial neural network controllers that regulate mean arterial blood pressure using SNP. A brief description of each control strategy is provided, followed by examples from literature. Testing of the control performance in computer simulations, animal studies, and clinical trials, is also discussed.
CONTROL SCHEMES
PID Controller
The PID control of MAP determines the SNP infusion rate, u(t), based on the difference between the desired output and the actual output,
u t |
Þ ¼ |
KPe t |
Þ þ |
KI Z t1 e t |
dt |
þ |
KD |
d |
e t |
Þ |
ð |
1 |
Þ |
|
|
||||||||||||||
ð |
ð |
t0 |
ð Þ |
|
|
dt ð |
|
|||||||
where e(t) ¼ Pd(t) Pm(t), Pd(t) is the desired MAP, and Pm(t) is the actual mean arterial pressure. The parameters KP, KI,
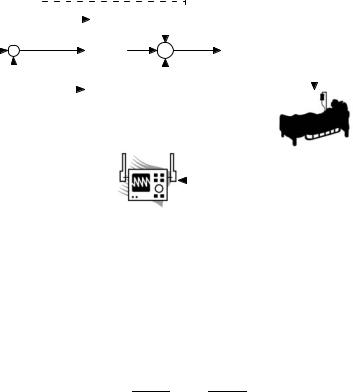
and KD are the proportional, integral, and differentiation gain respectively. The design of this type of controller involves the selection of appropriate control gains, KP, KI, and KD, such that the actual blood pressure, Pm(t), can be stabilized and maintained close to the desired level, Pd(t). Typical components of the automatic blood pressure control system, including the PID controller, the infusion pump, the patient, as well as the patient monitor along with physiologic sensors are illustrated in Fig. 1.
Sheppard and co-worker (2–4) developed a PI-type controller, by setting KD ¼ 0 in (1), to regulate SNP, which has been tested over thousands of postcardiac-surgery patients in the ICU. The control gains were tuned to satisfy an acceptable settling time with minimal overshoot. The discrete-time PI controller updates the infusion rate as
uðkÞ ¼ uðk 1Þ þ DuðkÞ |
ð2Þ |
where u(k 1) is the previous infusion rate a minute ago and Du(k) is the infusion rate increment defined by,
DuðkÞ ¼ K f0:4512 eðkÞ þ 0:4512 ½eðkÞ eðk 1Þ&g ð3Þ
where e(k) and e(k 1) are the current and previous error, respectively. The gain K in Eq. 3 as well as the further correction of Du(k) were determined by the region of current MAP Pm(k) as described in the following:
492 BLOOD PRESSURE, AUTOMATIC CONTROL OF
Pd (t) + |
|
e (t) |
|
|
|
|
|
|
|
|
|
K P |
|
|
|
|
|
|
|
|
|
|
|
|
|
|
|
|
|
u (t) |
|
|
|
|||||
|
|
|
|
|
|
|
|
|
|
|
|
|
|
|
|
|
|
|
|
|
|
|
|
|
|
|
|
|
|
|||||||||
|
|
|
|
|
|
|
|
|
|
|
|
|
|
|
|
|
|
|
|
|
|
|
|
|
|
|
|
|
|
|||||||||
|
|
|
|
|
|
|
|
|
|
|
|
|
|
|
|
|
|
|
|
|
|
|
|
|
|
|
|
|
|
|
|
|
|
|||||
|
|
|
|
|
|
|
|
|
KI |
∫ |
|
|
|
|
|
|
∑ |
|
|
Drug Infusion |
|
|||||||||||||||||
|
|
|
|
– |
|
|
|
|
|
|
|
|
|
|
|
|
|
|
|
|
|
Pump |
|
|||||||||||||||
|
|
|
|
|
|
|
|
|
|
|
|
|
|
|
|
|
|
|
|
|
|
|||||||||||||||||
|
|
|
|
|
|
|
|
|
|
|
|
|
|
|
|
|
|
|
|
|
|
|
|
|
|
|
|
|
|
|
|
|
|
|
|
|
|
|
|
|
|
|
|
|
|
|
|
|
|
|
|
K D |
|
d |
|
|
|
|
|
|
|
|
|
|
|
|
|
|
|
|
|
||||||
|
|
|
|
|
|
|
|
|
|
|
|
|
|
|
|
|
|
|
|
|
|
|
|
|
|
|
|
|
|
|||||||||
|
|
|
|
|
|
|
|
|
|
|
|
|
dt |
|
|
|
|
|
|
|
|
|
|
|
|
|
|
Patient |
||||||||||
|
|
|
|
|
|
|
|
|
|
|
|
|
|
|
|
|
|
|
|
|
|
|
|
|
|
|
||||||||||||
|
|
|
|
|
|
|
|
|
|
|
|
|
|
|
|
|
|
|
|
|
|
|
|
|
|
|
|
|
|
|
|
|||||||
|
|
|
|
|
|
|
|
|
|
|
|
|
Controller |
|
|
|
|
|
|
|
|
|
|
|
||||||||||||||
Figure 1. Proportional-integral-derivative control sch- |
|
Pm(t) |
|
|
|
|
|
|
|
|
|
|
|
|
|
|
|
|
|
|
|
|
|
|
|
|
|
|
||||||||||
|
|
|
|
|
|
|
|
|
|
|
|
|
|
|
|
|
|
|
|
|
|
|
|
|
|
|||||||||||||
|
|
|
|
|
|
|
|
|
|
|
|
|
|
|
|
|||||||||||||||||||||||
|
|
|
|
|
|
|
|
|
|
|
Blood Pressure Transducer |
|
|
|||||||||||||||||||||||||
eme of blood pressure control. |
|
|
|
|
|
|
|
|
|
|
|
|
|
|
|
|
& Patient Monitor |
|
|
|||||||||||||||||||
Rule 1 If Pm(k) Pd þ 5, then |
K ¼ 1 and Du(k) ¼ |
||
Du(k) from Eqs. 3–2 |
|
|
|
Rule 2 If Pd Pm(k) < Pd þ 5, |
then |
K ¼ 0.5 |
and |
Du(k) ¼ Du(k) from Eq. 3 |
|
|
|
Rule 3 If Pd 5 Pm(k) < Pd, |
then |
K ¼ 1 |
and |
Du(k) ¼ Du(k) from Eq. 3 |
|
|
|
Rule 4 If Pm(k) Pd 5, then K ¼ 2 and Du(k) ¼ Du(k) from Eq. 3
Rule 5 If Pm(k) < Pd 5 and Du(k) > 0, then Du(k) ¼ 0 Rule 6 If Pm(k) Pd and Du(k) > 7, then Du(k) ¼ 7
These rules were designed to provide a boundary for the controller and achieve the optimal performance with the minimal pharmacological intervention. As a result, the con-
troller is a nonlinear PI-type controller.
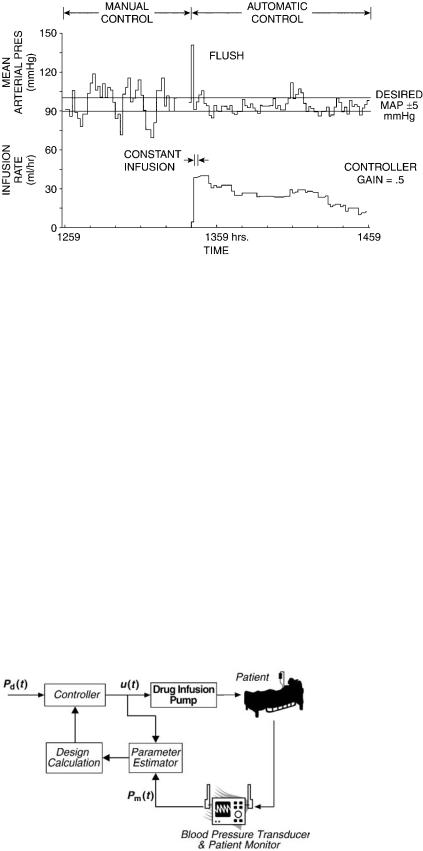
The automatic blood pressure controller described herein performed better than human operation in a comparison study (5). Automatic blood pressure regulation exhibits approximately one-half of the variation observed during manual control; MAP are more tightly distributed about the set-point, as shown in Fig. 2 (2). Forty-nine postcardiac surgery patients in ICU were managed by the automatic controller. The patients’ MAPs were maintained within 5 mmHg ( 0.667 kPa) of the desired MAP 94% of the total operation time (103 out of the 110 operation hours). A group of 37 patients were managed with manual operation provided by experienced personals, with which only 52% of the time the patients’ MAPs were within the prescribed range.
Adaptive Controller
The PID controller considered previously was with the control gains determined prior to their implementation. The control gains were usually tuned to satisfy the performance criterion in simulation or animal studies where the parameters characterizing the system dynamics were fixed variables. In clinical applications, the cardiovascular vascular dynamics change over time as well as from patient to patient. In addition, the sensitivity to drugs varies from one patient to another and even with the same patient at different instant. Therefore, it would be beneficial if the
control gains can be adjusted automatically during operation to adapt the differences between patients as well as physiologic condition changes in a patient over time. This type of controllers is called adaptive controller.
An adaptive control system usually requires a model, representing plant (the patient and the drug infusion system) dynamics. Linear black box models, expressed by
y k |
Bðq 1Þ |
u k |
Cðq 1Þ |
n k |
|
ð Þ ¼ |
Aðq 1Þ ð Þ þ |
Aðq 1Þ ð Þ |
|
||
Aðq 1Þ ¼ 1 þ a1q 1 þ a2q 2 þ þ anq n |
ð4Þ |
||||
Bðq 1Þ ¼ 1 þ b1q 1 þ b2q 2 þ þ blq l |
|
||||
Cðq 1Þ ¼ 1 þ c1q 1 þ c2q 2 þ þ cmq m |
|
||||
are typically used to represent the plant dynamics. A, B, and C are polynomials in the discrete shift operator q, where ai, bi, and ci are coefficients in the polynomials; y(k), u(k), and n(k) are the model input, output, and noise, respectively. Depending on the polynomials B and C, the model in Eq. 4 can be classified as autoregressive [AR, B(q 1 ) ¼ 0, C(q 1) ¼ 1], autoregressive with inputs [ARX, C(q 1) ¼ 1], autoregressive moving average [ARMA, B(q 1) ¼ 0], and autoregressive moving average with inputs (ARMAX). The coefficients of the polynomials are time-varying, much slower than the plant dynamic changes. The controller updates the control input, u(k), by taking the model parameter changes into consideration. General reviews and descriptions on adaptive control theory can be found in literature (6–8). Three types of adaptive control schemes are frequently used in blood pressure controller design: self-tuning regulator, model reference adaptive control, and multiple model adaptive control.
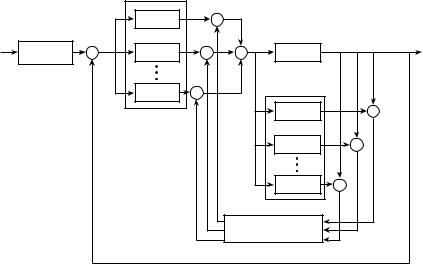
Self-Tuning Regulator. The self-tuning regulator (STR) is based on the idea of separating the estimation of unknown parameters from the design of the controller. It is assumed that a priori knowledge of the model structure, that is, l, m, and n in Eq. 4. In choosing l, m, and n, one must compromise between obtaining an accurate representation of the system dynamics while keeping the system representation simple. The parameters of the regulator are adjusted by using a recursive parameter estimator and a
BLOOD PRESSURE, AUTOMATIC CONTROL OF |
493 |
regulator design calculation as shown in Fig. 3. The parameter estimates are treated as if they are true or at least asymptotically the true parameters. Several algorithms are available for parameter estimation, including recursive least-squares, generalized least-squares, stochastic approximation, maximum likelihood, instrumental variables, and Kalman filter. Every technique has its advantages and disadvantages. Descriptions of parameter estimation algorithms can be found in (9). Various approaches are available for regulator design calculation, such as minimum variance, gain and phase margin analysis, pole placement, and linear quadratic Gaussian (LQG). More detailed information of STR can be found in literature (6–8).
Various STR-type blood pressure controllers have been developed and tested in computer simulations, animal experiments, as well as clinical studies. Arnsparger et al. (10) used a second-order ARMA model to design the STR. A recursive least-mean-squares estimator was used to estimate the model parameters. The parameter estimates were then used to calculate the control signal, the drug infusion rate, based upon a minimum variance or a one-step-ahead control law. Both algorithms were implemented in microprocessor and tested in dog experiments for comparison. Both controllers were able to maintain the
Figure 3. Configuration of self-tuning regulator for blood pressure control.
Figure 2. Comparison of manually controlled SNP infusion with computer control in the same patient. (Redrawn with permission from L.C. Sheppard, Computer control of the infusion of vasoactive drugs, Ann. of Biomed. Eng., Vol. 8: 431–444, 1980. Pergamon Press, Ltd.)
MAP at the desired level. However, the one-step-ahead controller performed better in the test with less variation in the infusion rate.
A combination of proportional derivative with minimum variance adaptive controller was designed by Meline et al. (11) to regulate MAP using SNP. The plant dynamics was represented by a fifth-order ARMAX model, while the model parameters were estimated through a recursive least-squares algorithm. The controller was tested on ten dog experiments as well as human subjects (12). Twenty patients with postsurgical hypertension were randomly assigned to either the manual group, where SNP was administrated by experience nurse, or the automatic group. Statistical analysis showed that MAP was maintained within 10% from the desired MAP for 83.3% of the total operation time in the ‘‘automatic’’ group versus 66.1% of the total operation time in the ‘‘manual’’ group. This implies the automatic control performed better than the manual operation.
A pole-assignment STR was designed by Mansour and Linkens (13) to regulate blood pressure using a fifth-order ARMAX model. The model parameters were identified through a recursive weighted least-squares estimator. These parameters were then used to determine appropriate feedback gains for the controller. Pole-placement algorithm was used because of its robustness to a system with nonminimum phase behavior or unknown time delay. Effectiveness of the controller was evaluated extensively in computer simulation, using a clinically validated model developed by Slate (3) as shown in Fig. 4(2). The controller demonstrated a robust performance even with the inclusion of the recirculation term or a variable time delay.
Voss et al. (14) developed a control advance moving average controller (CAMAC) to simultaneously regulate arterial pressure and cardiac output (CO) using SNP and dobutamine. CAMAC is a multivariable STR, which has the advantage of controlling nonminimum phase plants with unknown or varying dead times. The controller determines the drug infusion rates based on the desired MAP and CO, past inputs, past outputs, and a on-line recursive least-squares estimator with an exponential forgetting factor identifying the subject’s response to the drugs.
494 BLOOD PRESSURE, AUTOMATIC CONTROL OF
Figure 4. Model of MAP in response to SNP infusion. (Redrawn with permission from L.C. Sheppard, Computer control of the infusion of vasoactive drugs, Ann. Biomed. Eng. 1980; 8: 431–444. Pergamon Press, Ltd.)
The plant model for designing the controller and estimator was a second-order ARMAX model. The control algorithm was designed and tested in simulations prior to dog experiments. Although animal studies demonstrated that the controller was capable to maintain MAP and CO at their desired level, changing vasomotor tone and the lack of high frequency excitation signals could lead to inaccuracy in the parameter estimation, causing poor performance in transient response.
Model Reference Adaptive Control. The basic principle of the model reference adaptive control is illustrated in Fig. 5). The desired input–output response is specified by the reference model. The parameters of the regulator are adjusted by the error signal, the difference between the reference model output and the system output, such that the system output follows the reference output. More detailed information about MRAC can be found in Ref. 7.
The use of MRAC to regulate blood pressure was introduced by Kaufmann et al. (15). The format of the reference model was adopted form that developed by Slate (3). Controller design and evaluation were carried out in computer simulation. The controller with adaptation gains showed lower steady-state error than that with nonadaptive gains in simulations, particularly when a process disturbance was introduced. Animal studies were conducted to compare the performance of the MRAC with that of a well-tuned PI controller. Neosynephrine was introduced to change the transfer function characteristics of the subjects during experiments. The MRAC was superior to the PI controller
and maintained MAP closed to the reference with an error within 5 mmHg ( 0.667 kPa) regardless of the plant characteristic changes due to drug intervention.
Pajunen et al. (16) designed a MRAC to regulate blood pressure using SNP with the ability to adjust the reference model by learning the patient’s characteristics, represented by the model parameters, coefficients and time delays, of the transfer function. These model parameters were assumed to be unknown and exponentially timevarying. The time-varying reference model was automatically tuned to achieve the optimal performance while meeting the physical and clinical constraints imposed on the drug infusion rate and MAP. Extensive computer simulation was used to evaluate the robustness of the controller. The MAP was maintained within 15 mmHg ( 2 kPa) around the set-point regardless of changes in patient’s characteristics and the presence of high level noises.
Polycarpou and Conway (17) designed a MRAC to regulate MAP by adjusting SNP infusion rate. The plant model was a second-order model discretized from the Slate’s model (3). Time delay terms in the model were assumed to be known while the model parameters were constant with nonlinear terms. The constant terms were assumed to be known and the nonlinear terms were estimated by a radial basis function (RBF) neural network. The resulting parameter estimates were then used to update the control law such that the system output follows the reference model. Although the RBF was able to model the unknown nonlinearity and thus improve the closedloop characteristics in computer simulation, the
Figure 5. Configuration of MRAC for blood pressure regulation.
assumption that the model parameters and time delays were known would need further justification in practical applications.
Multiple Model Adaptive Control. The concept of multiple model adaptive control (MMAC) was first introduced by Lainiotis (18). This technique assumes that the plant response to the input can be represented by a bank of models. A controller is designed a priori to give a specified performance for each particular model. A probability, P(qi|t), describing the accuracy of each model, qi, to represent the actual system, is calculated and used as the weighting factor to update the control input,
|
¼ |
N |
|
ð j |
Þ |
ð |
Þ |
|
u |
Xui |
|||||||
|
|
P qi t |
|
5 |
|
|||
|
|
i¼1 |
|
|
|
|
|
where ui is the control input based on the model qi. As the response of the system changes, the probability, P(qi|t), will also be adjusted accordingly such that the model closest represents current dynamics gets the greatest probability. As a result, the contribution of the control input, obtained from the model with the greatest probability, to the updated control input in equation 5 is more significant than the inputs from other models with lower probabilities. Configuration of the MMAC is illustrated in Fig. 6.
He et al. (19) introduced the first blood pressure controller using the MMAC technique. There were eight plant models derived from Slate’s model (3) for controller design. Each plant model contains a constant model gain between 0.32 and 6.8, representing the plant gain of 0.25–9 in Slate’s model (3), along with the same time constants and delays at their nominal values. A proportional-plus- integral (PI) type controller was designed for each plant model. These controllers were with the same time constant but different gains. Computer simulation was used to test the controller performance in response to the variations of model parameters and the presence of background noise. The controller was able to settle MAP within 10 min with the error within 10 mmHg ( 1.333 kPa) from the set-
BLOOD PRESSURE, AUTOMATIC CONTROL OF |
495 |
point. The control algorithm was further tested in animal experiments. The controller stabilized MAP in < 10 min with 5 mmHg ( 0.667 kPa) error from its set-point, regardless of the plant characteristic changes due to neosynephrine injection, the sensitivity of the subject to the SNP infusion, and the background noise. The mean error was < 3 mmHg (0.4 kPa) over the entire studies.
Martin et al. (20) developed a MMAC blood pressure controller with seven models modified from Slate’s model
(3). The model gains in the seven models were from 0.33 to 9.03 to cover the variation of the plant gain between 0.25 and 10.86. The other model parameters were held constant at their nominal values. A pole-placement compensator was designed for each model. A Smith predictor was used to remove the effects of infusion delay, and thus simplify the control analysis and design. A PI unit was included to achieve zero steady-state error. Two constrains were used to limit the infusion rate when the patient’s blood pressure is too low or the resulting SNP infusion rate from the controller is beyond the preset threshold. The controller was able to maintain MAP with the settling time < 10 min, the maximum overshoot < 10 mmHg (1.333 kPa), and the steady-state error within 5 mmHg ( 0.667 kPa) around the pressure set-point in computer simulations. The controller was also tested on 5 dogs as well as 19 patients during cardiac surgery with the aid of a supervisor module, which oversees the overall environment and thus improves the safety (21,22).
Yu et al. (23) designed a MMAC to control MAP and CO by adjusting the infusion rates of SNP and dopamine for congested heart failure subjects. There were 36 linear multiinput and multioutput (MIMO) models, represented by first-order transfer functions with time delays, to cover the entire range of possible dynamics. A model predictive controller [MPC, (24)] was designed for each individual model to find a sequence of control signals such that a quadratic cost function can be minimized. In order to save computation time, only the control signals corresponding to the six models with the highest probability weights were used to determine the drug infusion rates. The control
|
|
1 |
ui (k ) |
× |
|
|
|
r (k ) |
|
|
|
|
|
||
Reference |
+ |
ei (k ) |
× |
+ |
|
|
y (k ) |
2 |
Plant |
|
|||||
Model |
|
+ |
|
|
|||
– |
|
|
+ |
|
|
||
|
|
|
|
|
|||
|
|
|
|
|
Model |
|
|
|
|
|
|
|
Bank y (k ) |
|
|
|
|
m |
× |
|
^ |
|
|
|
|
|
i |
|
+ |
||
|
|
|
|
|
1 |
|
|
|
|
Controller Bank |
|
|
– |
||
|
|
|
|
|
|||
|
|
|
|
|
2 |
|
+ |
|
|
|
|
|
|
– |
|
|
|
|
|
|
|
|
|
|
|
|
wi (k ) |
|
|
+ |
i (k ) |
|
|
|
|
m |
|
||
|
|
|
|
|
– |
|
|
|
|
|
|
|
|
|
|
|
y (k ) |
|
|
|
|
|
Figure 6. Block diagram of multiple model pre- |
|
|
|
|
|
|
dictive control. [Redrawn with permission from |
|
|
|
|
|
Weight Computation |
|
||
|
|
|
|
|
Rao et al., Automated regulation of hemodynamic |
||
|
|
|
|
|
|
|
|
|
|
|
|
|
|
|
variables, IEEE Eng. Med. Biol. 2001; 20 (1): 24– |
|
|
|
|
|
|
|
38. (# Copyright 2004 IEEE).] |
496 BLOOD PRESSURE, AUTOMATIC CONTROL OF
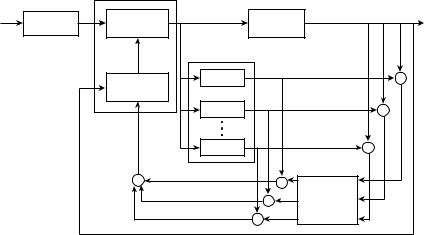
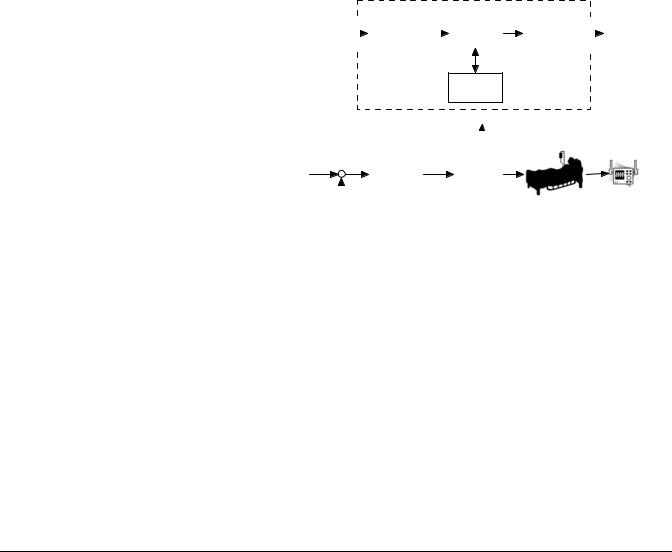
Figure 7. Modified multiple model predictive control strategy. [Redrawn with permission from Rao et al., Automated regulation of hemodynamic variables, IEEE Eng. Med. Biol. 2001; 20 (1): 24– 38. (# Copyright 2004 IEEE).]
r (k ) |
|
Constrained MPC |
|
|
|
|
|
|
|
|
|
|
|
|
Reference |
|
|
u (k ) |
|
y (k ) |
|
Optimization |
Plant |
|
|
||
|
Model |
|
|
|||
|
|
|
|
|
|
|
|
^ |
|
|
Model |
|
|
|
y (k +1:P ) |
|
|
|
|
|
|
|
|
|
Bank |
|
|
|
|
|
|
1 |
|
+ |
|
|
Prediction |
|
– |
||
|
|
|
^ |
|||
|
|
|
|
|
+ |
|
|
|
|
|
2 |
yi (k ) |
|
|
|
|
|
|
– |
|
|
|
|
|
|
|
|
|
|
^ |
|
m |
|
+ |
|
|
y (k ) |
|
|
– |
|
|
y (k ) |
|
|
|
|
|
|
|
+ |
|
|
|
|
|
|
|
× |
|
|
|
|
|
+ |
+ |
Weight |
||
|
|
× |
||||
|
|
|
|
Computation |
||
|
|
|
|
|
||
|
|
|
|
× |
|
i (k ) |
|
|
|
|
wi (k ) |
|
|
algorithm was tested in six dogs, including some cases with induced heart failure. It took 3–10.5 min to settle MAP within 5 mmHg ( 0.667 kPa) of the steady-state setpoint with the mean of 5.8 min in all cases. The overshoot was between 0 and 12 mmHg (1.6 kPa) with the average of 5.92 mmHg (0.79 kPa). The standard deviation of MAP about its set-point was 4 mmHg (0.533 kPa).
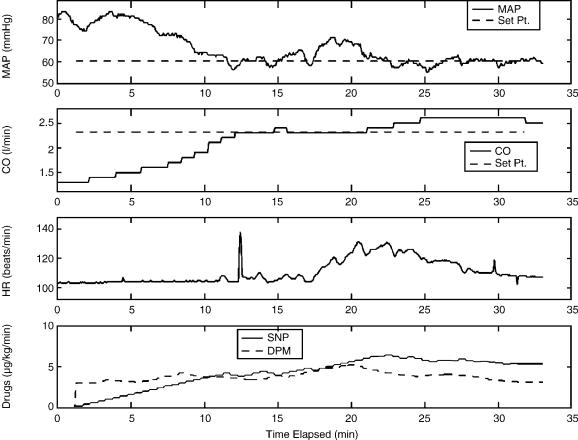
The major challenge of implementing MPC in MMAC is the computation time, especially for a large model bank. Rao et al. (25) designed a MMAC with a single constrained MPC as shown in Fig. 7. The model bank, constituted first- order-plus-time-delay MIMO models spanning sufficient spectrum of model gains, time constants, and time delays, was run in parallel to obtain the possible input–output characteristics of a patient’s response to drug dosages. A Bayesian weight was generated for each model based on the patient’s response to drugs. The MPC used the combination of model weights to determine the optimal drug infusion rates. This control scheme combines the advantages of model adaptation according to patient variations, as well as the ability to handle explicit input and output constraint specifications. The controller effectively maintained MAP and cardiac output in seven canine experiments (26). Figure 8 illustrates the results of control MAP and CO using SNP and dopamine in on study. High levels of fluothane were introduced to reduce CO, mimicking congestive heart failure. The controller achieved both setpoints of MAP ¼ 60 mmHg (8 kPa) and CO ¼ 2.3 L min 1 in 12 min. In average over the entire studies, MAP was maintained within 5 mmHg ( 0.667 kPa) of its set-point 89% of the time with a standard deviation of 3.9 mmHg (0.52 kPa). Cardiac output was held within 1 L min 1 of the set-point 96% of the time with a standard deviation of 0.5 L min 1. Manual regulation was performed in the experiments for comparison. The MAP was kept within5 mmHg ( 0.667 kPa) of its set-point 82% of the time with a standard deviation of 5.0 mmHg (0.667 kPa) while
CO stayed in the |
1 L min |
1 |
band of the set-point |
92% |
|
1 |
|||
of the time with a |
standard |
deviation of 0.6 L min . |
||
Clearly, the automatic control performed better than the manual approach.
Rule-Based Controller
The blood pressure controllers discussed previously rely on mathematical models that can characterize plant dynamics, including the drug infusion system, human cardiovascular dynamics, and pharmacological agents. Identifying such mathematical forms could be a challenge due to the complexity of human body. Despite this, there exist experienced personnel, whose ability to interpret linguistic statements about the process and to reason in a qualitative fashion prompts the question: ‘‘can we make comparable use of this information in automatic controllers?’’
In rule-based or intelligent control, the control law is generated from linguistic rules. This model-free controller usually consists of an inference engine and a set of rules for reasoning and decision making. A typical control rules are represented by if <condition> then <action> statements. Rule-based approaches have been proposed as a way of dealing with the complex natural of drug delivery systems and, more importantly, as a way of incorporating the extensive knowledge of clinical personnel into the automatic controller design.
One of the most popular rule-based control approaches is fuzzy control. Fuzzy control approach is based on fuzzy set theory and is a rule-based control scheme where scaling functions of physical variables are used to cope with uncertainty in the plant dynamics. A typical fuzzy controller, shown in Fig. 9, usually includes three components: (1) membership functions to fuzzify the physical input, (2) an inference engine with a decision rule base, and (3) a defuzzifier that converts fuzzy control decisions into physical control signals. More details on fuzzy set theory and its control applications are available in (27–29).
Isaka et al. (30) applied an optimization algorithm to determine the membership functions of a fuzzy blood pressure controller using SNP. This method reduced the time and efforts to determine appropriate values for a large number of membership functions. In addition, it also provided the knowledge of the effect of membership functions to the fuzzy controller performance, as well as the effect of
BLOOD PRESSURE, AUTOMATIC CONTROL OF |
497 |
Figure 8. Multiple model adaptive control of MAP and CO using SNP and dopamine in canine
experiment. (# Copyright 2004 IEEE).
plant parameter variations to the changes in membership functions. Efficacy of using this controller to regulate MAP by infusing SNP was evaluated in computer simulation model proposed by Slate (3). The MAP was initialized at 120 mmHg (16 kPa) at the beginning of simulation. The target MAP value was first set at 80 mmHg (10.665 kPa) and then changed to 110 mmHg (14.665 kPa). The target MAP values were achieved in < 3 min with overshoots < 10 mmHg (1.333 kPa).
Ying et al. (31) designed an expert-system-shell-based fuzzy controller to regulate MAP using SNP. The controller was a nonlinear PI-type control while the control gains were predetermined by analytically converting the fuzzy control algorithm. This converting process provided the advantage of execution time reduction. The controller was further finetuned to be more responsive to the rapid and large changes of MAP. It was successfully tested in 12 postsurgical patients for the total of 95 hs and 13 min. MAP was maintained within 10% of its target value, 80 mmHg (10.665 kPa), 89.3% of the time over the entire test.
Neural-Network Based Controller
Artificial neural networks (ANN) are computation models that have learning and adaptation capabilities. An ANNbased controller is usually more robust than the traditional
controllers in the presence of plant nonlinearity and uncertainty if the controller is trained properly. A survey article about the use of ANN in control by Hunt et al. (32) provides more detailed information.
The use of ANN-type controller in arterial blood pressure regulation was investigated in feasibility studies in either computer simulation or animal experiments. Chen et al. (33) designed an ANN-type adaptive controller to control MAP using SNP. The controller was tested in computer simulation with various gains and different levels of noise. The controller was able to maintain MAP close to the set point, 100 mmHg (13.33 kPa) with error within 15 mmHg ( 2 kPa) in an acceptable tolerance settling time < 20 min.
Kashihara et al. (34) compared various controllers, including PID, adaptive predictive control using ANN (APPNN), a combined control of PID with APPNN, a fuzzy controller, and a model predictive controller, to maintain MAP for acute hypotension using norepinephrine. The controllers were tested in computer simulation and animal studies. The controllers based on neural network approach were more robust in the presence of unexpected hypotension and unknown drug sensitivity. Adding an ANN or a fuzzy logic scheme to the PID or adaptive controller improved the ability of the controller to handle unexpected conditions more effectively.
498 BLOOD PRESSURE, AUTOMATIC CONTROL OF
e (t ) |
|
|
|
|
Membership |
|
|
Inference |
|
De-Fuzzifier |
|
|
|
u (t ) |
|
|
|
|
|
|
|
|
|
|
|||||
|
|
|
|
|
Functions |
|
|
Engine |
|
|
|
|
|
|
Control
Rule Base
Fuzzy Controller
Figure 9. Block diagram of a fuzzy controller. [Redrawn with permission from Isaka et al., An optimization approach for fuzzy controller design, 1992; SMC 22: 1469–1473. (# Copyright 2004 IEEE).]
|
|
|
|
|
|
|
|
|
Blood Pressure |
|
|
|
|
|
|
|
|
|
|
||
Pd (t ) |
|
|
|
|
|
|
|
Patient |
Transducer |
|
|
e (t ) |
Fuzzy |
u (t ) |
Drug |
|
|
|
|||
|
|
|
|
Infusion |
|
|
|
|||
+ |
|
|
Controller |
|
|
|
|
|||
|
– |
|
Pump |
|
Pm (t ) |
|||||
|
|
|
||||||||
|
|
|
|
|
|
|||||
|
|
|
|
|
|
|
|
|||
|
|
|
|
|
|
|
||||
|
|
|
|
|
|
|
|
|
||
|
|
|
|
|
|
|
|
|
|
|
DISCUSSION
Numerous controllers have been developed since 1970s to regulate SNP and control MAP for hypertension patients. The control strategies can generally be classified as PID control, adaptive control (including STR, MRAC, and MMAC), rule-based control, as well as neural network control. Most controllers were developed and tested in computer simulation and animal experiments successfully. A few controllers were tested clinically with satisfactory results. Table 1 summarizes the control algorithms reviewed in this article.
Controller performance is influenced by several factors, including the fit of the process model to the plant, signal conditioning of the sensors under various clinical environments, as well as the diagnosis ability of the devices. Model selection is crucial for the stability and robustness of a controller. In blood pressure regulation, variable time
delay, patient’s sensitivity to SNP, and rennin regulatory mechanism are important factors. These factors could cause parameter variations in the plant model that might reduce the performance of a fixed-gain controller. Adaptive controllers that can adjust the control signal based on the estimation of model parameters or the probability of model errors could overcome the limit of the fixed-gain control. Some controllers have been tested in the laboratory with promising results. However, clinical applications of this type of controllers were very few. Rule-based and ANN controllers do not need a specific plant model for control design. The training signals or information must provide a broad coverage of possible events in the clinical environment to assure the reliability of the control algorithm.
Patient care practices and other aspects of the clinical environment must be considered in the design of a clinical useful system. A supervisory algorithm that can detect potential risks, determine appropriate control signals to
Table 1. Summary of Blood Pressure Controllers Reviewed in this Article
|
|
|
Controller Performance |
Controller Test |
|
|||
|
|
|
|
|
|
|
|
|
|
|
|
|
Steady-State |
|
|
|
|
|
|
Settling |
Overshoot, |
about the |
|
Animal |
Clinical |
|
Articles |
Control Scheme |
Time (min) |
mmHg |
Set-Point, mmHg |
Simulation |
Studies |
Studies |
|
|
|
|
|
|
|
|
|
|
Slate et al.(2–4) |
Nonlinear PI |
< 10 |
|
10 |
|
x |
x |
x |
Arnsparger et al.(10) |
STR |
2 |
30 |
10 |
|
|
x |
|
Mansour et al.(13) |
STR |
5–20 |
< 10 |
5 |
|
x |
|
|
Voss et al.(14) |
CAMAC |
1.3–7.3 |
0–22 |
4–9.8 |
x |
x |
|
|
Kaufmann et al.(15) |
MRAC (w/known |
< 5 |
|
5 |
|
x |
x |
|
|
time-constant |
|
|
|
|
|
|
|
|
and delay) |
|
|
15 |
|
|
|
|
Pajunen et al.(16) |
MRAC |
< 5 |
< 15 |
|
x |
|
|
|
|
(w/time-varying |
|
|
|
|
|
|
|
|
parameters) |
|
|
10 |
|
|
|
|
Polycarpou et al.(17) |
MRAC |
5 |
|
|
x |
|
|
|
He et al.(19) |
MMAC |
< 8 |
< 5 |
5 |
|
x |
x |
|
Martin et al.(20–22) |
MMAC |
< 10 |
< 10 |
5 |
|
x |
x |
x |
Yu et al.(23) |
MMAC |
3–10.5 |
0–12 |
5 |
|
x |
x |
|
Rao et al.(25,26) |
MMPC |
12 |
|
5 |
|
x |
x |
|
Isaka et al.(30) |
Fuzzy controller |
< 3 |
< 10 |
5 |
|
x |
|
|
Ying et al.(31) |
Fuzzy controller |
|
|
8 |
|
x |
|
x |
Chen et al.(33) |
ANN |
5 to 20 |
|
15 |
|
x |
|
|
Kashihara et al.(34) |
ANN |
2 |
|
5 |
|
x |
x |
|
stably maintain a patient’s blood pressure near the set point, and identify excessive noise or artifact in sensor measurements would be beneficial (21,22,31). The supervisor oversees the entire conditions of the control environment and directs the controller to take control actions efficiently and safely. Control decision is based upon sensor measurements. It is very important that the supervisor is able to process measurements and detect the nonphysiological signals, such as the noisy signals duo to suction the airway and flushing the arterial catheter, and thus avoid acting on unreliable information. In addition, the supervisor must have the ability to assure the proper operation of the infusion system for drug delivery. This monitoring system should be able to detect the potential faults that could prevent abnormal operation of the device (e.g., blood clotting, infusion kinking, leakage, and infusion pump stoppage).
CONCLUSION
Because of the quick action of SNP in blood pressure reduction, frequent monitoring of MAP followed by infusion rate adjustment is necessary. The use of manual control to achieve desired MAP would be burdensome to ICU personnel, who are already loaded with many duties. Successful development of a blood pressure controller that could automatically maintain patient’s MAP within a preset range with self-monitoring capability would reduce the workload of the patient care providers and improve the patient’s quality of life in the clinical environment.
Blood pressure control systems designed previously provide valuable experiences for further development. The future controller should be able to adapt the characteristic changes (represented by gains, time delays, and time constants) from patient to patient as well as the variations within a patient over time. In order to improve the reliability and safety of the controller, incorporating a supervisory scheme that can monitor system operation as well as identify and manage unexpected mechanical errors and clinical environment changes with the control system would be essential.
BIBLIOGRAPHY
Cited References
1.Chitwood Jr WR, Cosgrove 3rd DM, Lust RM. Multicenter trial of automated nitroprusside infusion for postoperative hypertension. Titrator Multicenter Study Group. Ann Thorac Surg 1992;54:517–522.
2.Sheppard LC. Computer control of the infusion of vasoactive drugs. Ann Biomed Eng 1980;8:431–444.
3.Slate JB. Model-based design of a controller for infusing sodium nitroprusside during postsurgical hypertension. Ph.D. dissertation. University of Wisconsin-Madison, 1980.
4.Slate JB, Sheppard LC. Automatic control of blood pressure by drug infusion. Proc Inst Electr Eng 1982;129, (Pt. A):639– 645.
5.de Asla RA, Benis AM, Jurado RA, Litwak RS. Management of postcardiotomy hypertension by microcomputer-controlled administration of sodium nitroprusside. J Thrac Cardiovas Surg 1985;89:115–120.
6.Astrom KJ. Theory and application of adaptive control— a survey. Automatica 1983;19:471–486.
BLOOD PRESSURE, AUTOMATIC CONTROL OF |
499 |
7.Astrom KJ, Wittenmark B. Adaptive Control 2nd ed. New York: Addison-Wesley; 1994.
8.Goodwin GC, Sin KS. Adaptive Filtering, Prediction, and Control. Englewood Cliffs (NJ): Prentice Hall; 1984.
9.Ljung L. System Identification: Theory for the User. 2nd ed. Englewood Cliffs (NJ): Prentice Hall; 1998.
10.Arnsparger JM, McInnis BC, Glover Jr JR, Norman NA. Adaptive control of blood pressure. IEEE Trans Biomed Eng 1983;BME-30:168–176.
11.Meline LJ, Westenskow DR, Pace NL, Bodily MN. Computer controlled regulation of sodium nitroprusside infusion. Anesth Analog 1985;64:38–42.
12.Waller JL, Roth JV. Computer-controlled regulation of sodium nitroprusside infusion in human subjects. Anesthesiology 1985;63:A192.
13.Mansour NE, Linkens DA. Pole-assignment self-tuning control of blood pressure in postoperative patients: a simulation study. Proc Inst Electr Eng 1989;136, (Pt. D):1–11.
14.Voss GI, Katona PG, Chizeck HJ. Adaptive multivariable drug delivery: control of arterial pressure and cardiac output in anesthetized dogs. IEEE Trans Biomed Eng 1987;BME- 34:617–623.
15.Kaufman H, Roy R, Xu X. Model reference control of drug infusion rate. Automatica 1984;20:205–209.
16.Pajunen GA, Steinmetz M, Shankar R. Model reference adaptive control with constraints for postoperative blood pressure management. IEEE Trans Biomed Eng 1990;BME-37:679–687.
17.Polycarpou MM, Conway JY. Indirect adaptive nonlinear control of drug delivery systems. IEEE Trans Auto Control 1998;AC-43:849–856.
18.Lainiotis DG. Partition: a unifying framework for adaptive systems II: control. Proc IEEE 1976;64:1182–1198.
19.He WG, Kaufman H, Roy R. Multiple model adaptive control procedure for blood pressure control. IEEE Trans Biomed Eng 1986;BME-33:10–19.
20.Martin JF, Schneider AM, Smith NT. Multiple-model adaptive control of blood pressure using sodium nitroprusside. IEEE Trans Biomed Eng 1987;BME-34:603–611.
21.Martin JF, Schneider AM, Quinn ML, Smith NT. Improved safety and efficacy in adaptive control of arterial blood pressure through the use of a supervisor. IEEE Trans Biomed Eng 1992;BME-39:381–388.
22.Martin JF, Smith NT, Quinn ML, Schneider AM. Supervisory adaptive control of arterial blood pressure during cardiac surgery. IEEE Trans Biomed Eng 1992;BME-39:389–393.
23.Yu C, Roy RJ, Kaufman H, Bequette BW. Multiple-model adaptive predictive control of mean arterial pressure and cardiac output. IEEE Trans Biomed Eng 1992;BME-39:765–778.
24.Garcia CE, Prett DM, Morari M. Model predictive control: theory and practices—a survey. Automatica 1989;25:335– 348.
25.Rao RR, Palerm CC, Aufderheide B, Bequette BW. Automated regulation of hemodynamic variables. IEEE Eng Med Biol 2001;20 (1):24–38.
26.Rao RR, Aufderheide B, Bequette BW. Experimental studies on multiple-model predictive control for automated regulation of hemodynamic variables. Trans Biomed Eng 2003;50 (3):277–288.
27.Zadeh LA. Fuzzy sets. Inform Contr 1965;8:338–353.
28.Tong RM. A control engineering review of fuzzy systems. Automatica 1977;13:559–569.
29.Sugeno M. An introductory survey of fuzzy control, Inform. Science 1985;36:59–83.
30.Isaka S, Sebald AV. An optimization approach for fuzzy controller design. IEEE Trans Sys, Man, Cyber 1992;SMC 22:1469–1473.