

ARTERIAL TONOMETRY. See TONOMETRY, ARTERIAL.
ARTIFICIAL BLOOD. See BLOOD, ARTIFICIAL.
ARTIFICIAL HEART. See HEART, ARTIFICIAL.
ARTIFICIAL HEART VALVE. See HEART VALVE
PROSTHESES.
ARTIFICIAL HIP JOINTS. See HIP JOINTS,
ARTIFICIAL.
ARTIFICIAL LARYNX. See LARYNGEAL PROSTHETIC
DEVICES.
ARTIFICIAL PANCREAS. See PANCREAS, ARTIFICIAL.
ARTERIES, ELASTIC PROPERTIES OF
KOZABURO HAYASHI
Okayama University of Science
Okayama, Japan
INTRODUCTION
The elastic properties of the arterial wall are very important because they are closely related to arterial physiology and pathology, especially via effects on blood flow and arterial mass transport. Furthermore, stresses and strains in the arterial wall are prerequisite for the understanding of the pathophysiology and mechanics of the cardiovascular system. Stresses and strains cannot be analyzed without exact knowledge of the arterial elasticity.
STRUCTURE OF ARETRIAL WALL AND BASIC CHARACTERISTICS
Arteries become smaller in diameter with increasing distance from the heart, depending on functional demands (1). In concert with this reduction in size, their structure, chemical composition, and wall thickness-inner diameter ratio gradually change in a way that leads to a progressive increase both in stiffness and in their ability to change their inner diameter in response to a variety of chemical and neurological control signals.
Arterial wall is inhomogeneous not only structurally, but also histologically. It is composed of three layers (intima, media, and adventitia), which are separated by elastic membranes. Because the media is much thicker than the other two layers and supports load induced by blood pressure, its mechanical properties represent the properties of arterial wall. The media is mainly composed of elastin, collagen, and cells (smooth muscle cell and fibroblast). Roughly speaking, elastin gives an artery its elasticity, while collagen resists tensile forces and gives the artery its burst strength. Smooth muscle cells contract or relax in response to mechanical, chemical, and the other stimuli, which alters the deformed configuration of arteries. The wall compositions vary at different locations depending on required functions. For example, collagen
ARTERIES, ELASTIC PROPERTIES OF |
85 |
and smooth muscle increase and elastin decreases at more distal sites in conduit arteries; the ratio of collagen to elastin increases in more distally located arteries. Collagen and elastin are essentially similar proteins, but collagen is very much stronger and stiffer than elastin. Therefore, the change of arterial diameter developed by blood pressure pulsation depends on the arterial site; it is larger in more proximal arteries.
Like most biological soft tissues, arteries undergo large deformation when they are subjected to physiological loading, and their force-deformation and stress–strain relations are nonlinear partly because of the abovementioned inhomogeneous structure and partly because of the nonlinear characteristics of each component itself. Since collagen is a long-chained high polymer, it is intrinsically anisotropic. Moreover, not only collagen and elastin fibers, but also cells, are oriented in tissues and organs in order so that their functions be most effective. Inevitably, the arterial wall is mechanically anisotropic like many other biological tissues. Biological soft tissues including arterial wall demonstrate opened hysteresis loops in their force–deformation and stress–strain curves, which means that those tissues are viscoelastic. In such materials, the stress state is not uniquely determined by current strain, but depends also on the history of deformation. When a viscoelastic tissue is elongated and maintained at some length, load does not stay at a specific level, but decreases rather rapidly at first and then gradually (relaxation). If some constant load is applied to the tissue, it is elongated with time rather rapidly at first and then gradually (creep). Viscoelastic materials generally show different stress– strain properties under different strain rates. It is true, and higher strain rates give higher stresses. However, such a strain rate effect is not so much in biological soft tissues like arteries, namely, their elastic properties are not more sensitive to strain rate. Therefore, it is not always necessary to consider viscoelasticity for arterial mechanics; it is very often enough to assume wall material to be elastic. Many biological soft tissues contain water of > 70%. Therefore, they hardly change their volume even if load is applied, and they are almost incompressible. The incompressibility assumption is very important in the formulation of constitutive laws of soft tissues, because it imposes a constraint on the strains and they are not independent.
MEASUREMENT OF ARTERIAL ELASTICITY
In Vitro Tests
It is widely recognized that the mechanical properties of blood vessels do not change for up to 48 h if tissues are stored at 4 8C (1). One of the basic methods for the determination of the mechanical properties of biological tissues is uniaxial tensile testing on excised specimens. In this test, an increasing force is steadily applied to the longitudinal direction of a specimen, and the resulting specimen deformation is measured, which gives relations between stress (force divided by specimen cross-sectional area) and strain (specimen elongation divided by reference specimen length). This in vitro test is simple but, nevertheless, provides us with basic and useful information on
86 |
ARTERIES, ELASTIC PROPERTIES OF |
|
||
|
Recorder |
|
|
|
Sequencer |
|
|
|
|
|
Pressure |
Strain |
Video |
Strain |
|
dimension |
|||
|
transducer |
amp. |
amp. |
|
|
Reservoir |
|
analyzer |
Load cell |
|
|
CCD |
||
|
Valve |
|
|
|
|
|
camera |
95%O2 + 5%CO2 |
|
|
|
|
|
|
|
Actuator |
|
|
|
Diaphragm |
Krebs-Ringer |
Specimen |
|
solution (37uC) |
|
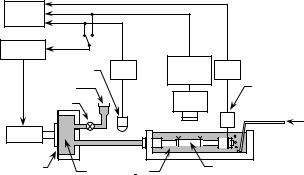
Figure 1. An in vitro experimental setup for the pressure– diameter–axial force test of a tubular arterial specimen. Internal pressure or outer diameter can be controlled with a feedback system (2).
the mechanical properties of tissues. Dumbbell-shape specimens, helically stripped specimens, and ring specimens are commonly used for arterial walls.
Under in vivo conditions, arteries are tethered to or constrained by perivascular connective tissues and side branches, and pressurized by blood from inside. These forces develop multiaxial stresses in the wall. For the determination of the mechanical characteristics of arteries under multiaxial conditions, biaxial tensile tests on flat specimens are utilized to simultaneously apply forces in the circumferential and longitudinal directions; however, the effect of wall radial stress is ignored in this case.
Although stress–strain data obtained from the abovementioned uniaxial and biaxial tests on flat, strip, and ring specimens are often used to represent the elastic properties of arterial walls, the data obtained from pressure–diameter tests on the tubular segments of blood vessels are more important and realistic. An example of the test devices is shown in Fig. 1 (2). A tubular specimen is mounted in the bath filled with Krebs–Ringer solution, which is kept at 37 8C and aerated with 95% O2 and 5% CO2 gas mixture. Then, it is extend to the in vivo length to mimic the in vivo condition, because arteries inside the body are tethered to the surrounding tissues as mentioned above and, therefore, they are extended in the axial direction. A diaphragmtype actuator, which is controlled with a sequencer, is incorporated in the device for the application of internal pressure to the specimen. The internal pressure or specimen diameter can be controlled with the sequencer during pressure–diameter tests. The pressure is measured with a fluid-filled pressure transducer, while the outer diameter of the specimen is determined with a video dimension analyzer combined with a CCD camera. If the measurements of axial force are required in order to obtain pres- sure–diameter–axial force relations for the purpose of determining multiaxial constitutive laws, a load cell attached to one end of the vessel can be used.
In Vivo Measurements
It may be more realistic to obtain data from in vivo experiments under in situ conditions rather than to get data from in vitro biomechanical tests. As a result of recent progress
in ultrasonic techniques, arterial diameter and even arterial wall thickness can be measured noninvasively with fairly good precision. These methods are being used not only for in vivo animal experiments, but also for clinical diagnosis of vascular diseases. It is true that the data obtained from these experiments and clinical cases are very useful, and provide important information concerning arterial mechanics. On the other hand, it is also true that many factors considerably affect the results obtained. These include physiological reactions to momentary changes in body and ambient conditions as well as the effects of anesthesia and respiration. In addition, since there has been some difficulty in applying the methods to small-diameter blood vessels, accurate measurements of vascular diameter and wall thickness with current techniques have been mostly limited to aortas and large arteries.
Before noninvasive ultrasonic techniques were developed, in vivo measurements of vascular diameter were invasively performed following surgical exposure of blood vessels, using strain gauge-mounted cantilevers, strain gauge-pasted calipers, and sonomicrometers. For example, a pair of miniature ultrasonic sensors may be used for the measurement of the outer diameter of a blood vessel (3). They are attached to the adventitial surface of a blood vessel so as to face each other across the vascular diameter. The diameter is determined from the transit time of the pulses between the two sensors. Similar sonomicrometers have been used for the measurement of arterial diameter not only in anesthetized, but also in conscious animals.
The noninvasive measurement of the elastic properties of arteries offers several significant advantages over invasive techniques. First, the nontraumatic character of the measurement guarantees a physiological state of the arterial wall, whereas such key functional elements of the wall as endothelium and smooth muscle might be affected in certain invasive measurement techniques. Second, it is of great clinical interest because it allows the monitoring of many outpatients and, therefore, it is well adapted for epidemiological or cross-sectional studies.
Noninvasive measurement of the arterial diameter can be done with ultrasonic echo-tracking techniques; recent improvements of the original technique have been proposed, which include digital tracking, prior inverse filtering, and coupling with B-mode imaging (1).
There exist no direct ways to measure pressure noninvasively in large central arteries, such as the aorta. Thus, regardless of the progress of ultrasonic and magnetic resonance imaging techniques which allow for the noninvasive measurement of vascular diameter, mechanical properties, such as compliance and elastic modulus cannot be derived from first principles. Therefore, primarily for clinical use, as an indirect, but noninvasive way of estimating the mechanical properties, the pulse wave velocity, c (see the next section), is often obtained from the measurements of pulsation at two distinct points along the vessel. One of the major drawbacks of this technique is low accuracy. The other one is that it yields a single value for the wave velocity. Because of the nonlinear elastic properties of the arterial wall, the pulse wave velocity sensitively changes depending on blood pressure. Therefore, the determination of a single value or a typical value of the arterial stiffness
estimated from the pulsation does not provide a full description of the mechanical properties of the arterial wall.
MATHEMATICAL EXPRESSION OF ARTERIAL ELASTICITY
Uniaxial Tensile Behavior
There are many tensile test data from arterial walls in humans and animals (4). Arterial walls exhibit nonlinear force-deformation or stress–strain behavior, having higher distensibility in the low force or stress range and losing it at higher force or stress. To represent strain in such biological soft tissues that deform largely and nonlinearly, we commonly use extension ratio, l, which is defined by the ratio of the current length of a specimen (L) to its initial length (L0). If we plot a stress/extension ratio curve as the slope of a stress/extension ratio curve versus stress, we can see that the relation is composed of one or two straight lines (1). Each line is described by
dT=dl ¼ BT þ C |
(1) |
where T is Lagrangian stress defined by F/A0 (F, force; A0, cross-sectional area of an undeformed specimen), and B and C are constants. This is also expressed by
T ¼ A½exp Bðl 1Þ 1& |
(2) |
where A is equal to C/B. This type of exponential formulation is applicable to the description of the elastic behavior of many other biological soft tissues (5).
Pressure–Diameter Relations
For practical purposes, it is convenient to use a single parameter that expresses the arterial elasticity under living conditions. In particular, for noninvasive diagnosis in clinical medicine, material characterization should be simple, yet quantitative. For this purpose, several parameters have been proposed and commonly utilized
(1). These include pressure–strain elastic modulus, Ep and vascular compliance, Cv. Pulse wave velocity, c, which was mentioned above, is also used to express elastic properties of the arterial wall. These parameters are described by
Ep ¼ DP=ðDDo=DoÞ |
(3) |
Cv ¼ ðDV=VÞ=DP |
(4) |
and |
|
c2 ¼ ðS=rÞðDP=DSÞ ¼ ðV=rÞðDP=DVÞ |
(5) |
where Do, V, and S are the outer diameter, volume, and luminal area of a blood vessel at pressure P, respectively, and DDo, DV, and DS are their increments for the pressure increment, DP. The parameter r is the density of the blood.
To calculate these parameters, we do not need to measure the wall thickness; for Ep and Cv, we need to know only pressure–diameter and pressure–volume data, respectively, at a specific pressure level. However, we should remember that these parameters express the stiffness or distensibility of a blood vessel. Therefore, they are
ARTERIES, ELASTIC PROPERTIES OF |
87 |
structural parameters, and do not rigorously represent the inherent elastic properties of the wall material; in this sense, they are different from the elastic modulus which is explained below. In addition, these parameters are defined at specific pressures, and give different values at different pressure levels because the pressure–diameter relations of arteries are nonlinear.
To overcome this shortcoming, several functions have been proposed to mathematically describe pressure– diameter, pressure–volume, and pressure-luminal area data, and one or several parameters included in these equations have been used for the expression of the elastic characteristics of arteries. Among these functions, the following equation is one of the simplest and most reliable for the description of pressure-diameter relations of arteries in the physiological pressure range (6):
lnðP=PsÞ ¼ bðDo=Ds 1Þ |
(6) |
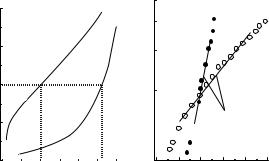
where Ps is a standard pressure and Ds is the wall diameter at pressure Ps. A physiologically normal blood pressure like 100 mmHg (13.3 kPa) is recommended for the standard pressure, Ps. As an example, Fig. 2 shows the pressure–diameter relationships of a human femoral artery under normal and active conditions of vascular smooth muscle and the relations between the logarithm of pressure ratio, P/Ps, and distension ratio, Do/Ds. Figure 2a demonstrates nonlinear behavior of the artery under both conditions, while Fig. 2b shows the close fit of the data to Eq. 6 over a rather wide pressure range. The coefficient, b, called the stiffness parameter, represents the structural stiffness of a vascular wall; it does not depend upon pressure. This parameter has been used for the evaluation of the stiffness of arteries not only in basic investigations, but also in clinical studies (1).
As can be seen from Fig. 2a, under the normal condition, arteries greatly increase the diameter with pressure under a low pressure range, say < 60 mmHg (8 kPa), and then gradually lose the distensibility at higher pressures. When vascular smooth muscle cells are activated by stimuli, arteries are contracted and their diameter decreases in a
Internal pressure P (mmHg)
200
150
Active
(Contracted)
Normal
100
Ps
50
0 |
|
Ds |
|
Ds |
|
|
|
|
|
|
|
5.0 |
6.0 |
7.0 |
8.0 |
||
External diamater Do (mm)
Pressure ratio P/Ps
2.5 |
|
|
2.0 |
|
|
1.5 |
Normal |
|
|
(β=11.2) |
Active |
|
|
(β=3.2) |
1.0 |
|
|
 ln(P/Ps)=β(Do/Ds–1)
  β=Stiffness parameter
0.5
0.8 0.9 1.0 1.1 1.2 1.3 Distension ratio Do/Ds
(a) |
(b) |
Figure 2. Pressure–diameter (a) and pressure ratio–distension ratio (b) relations of a human femoral artery under normal and active conditions (in vitro study) (1,7).
88 ARTERIES, ELASTIC PROPERTIES OF
physiological pressure range and below the range [< 200 mmHg (26.6 kPa) in Fig. 2], and their pressure–diameter curves become greatly different from those observed under the normal condition.
To express the elastic properties of wall material, it is necessary to use a material parameter such as elastic modulus or Young’s modulus, which is the slope of a linear stress–strain relation. For arterial walls that have nonlinear stress–strain relations, the following incremental elastic modulus has been often used for this purpose (8):
Huu ¼ 2D2i DoðDP=DDoÞ=ðD2o D2i Þ þ 2PD2o=ðD2o D2i Þ (7)
where Di is the internal diameter of a vessel. This equation was derived using the theory of small elastic deformation superposed on finite deformation in the case of a pressurized orthotropic cylindrical tube.
To calculate this modulus, it is necessary to know the thickness or internal diameter of a vessel. In in vitro experiments, we can calculate them from Do, the internal and external diameters under no-load conditions measured after pressure–diameter testing, the in vivo axial extension ratio, and assuming the incompressibility of wall material. Noninvasive measurement of wall thickness or internal diameter on intact vessels has been rather difficult compared with the measurement of external diameter; however, it is now possible with high accuracy ultrasonic echo systems as mentioned above.
Constitutive Laws
Mathematical description of the mechanical behavior of a material in a general form is called a constitutive law or constitutive equation. We cannot perform any mechanical analyses without knowledge of constitutive laws of materials. Strain energy functions are commonly utilized for formulating constitutive laws of biological soft tissues that undergo large deformation (5). Let W be the strain energy per unit mass of a tissue, and r0 be the density in the zerostress state. Then, r0W is the strain energy per unit volume of the tissue in the zero-stress state, and this is called the strain energy density function. Because arterial tissue is considered as an elastic solid, a strain energy function exists, and the strain energy W is a function solely of the Green strains:
W ¼ WðEi jÞ |
(8) |
where Eij are the components of the Green strain tensor with respect to a local rectangular Cartesian coordinate system.
Under physiological conditions, arteries are subjected to axisymmetrical loads, and the axes of the principal stresses and strains coincide with the axes of mechanical orthotropy. Moreover, the condition of incompressibility is used to eliminate the radial strain Err, and therefore the strain energy function becomes a function of the circumferential and axial strains Euu and Ezz. Then, the constitutive equations for arteries are
suu srr ¼ ð1 þ 2EuuÞ@ðr0WÞ=@Euu |
(9) |
and |
|
szz srr ¼ ð1 þ 2EzzÞ@ðr0WÞ=@Ezz |
(10) |
where suu, szz, and srr are Cauchy stresses in the circumferential, axial, and radial directions, respectively. Thus, we need to know the details of the strain energy function to describe stress–strain relations.
Three major equations have so far been proposed for the strain energy function of arterial wall. Vaishnav et al. (9) advocated the following equation:
r0W ¼ ðc=2Þexpðb1Err2 þ b2Euu2 þ b3Ezz2 |
|
þ 2b4ErrEuu þ 2b5EuuEzz þ 2b6EzzErrÞ |
ð11Þ |
where Euu and Ezz are Green strains in the circumferential and axial directions, respectively, and A, B, and so on, are constants.
Chuong and Fung (10) proposed another form with an exponential function:
r0W ¼ ðc=2Þexpðb1Err2 þ b2Euu2 þ b3Ezz2 |
|
þ 2b4ErrEuu þ 2b5EuuEzz þ 2b6EzzErrÞ |
ð12Þ |
where c, b1, b2, and so on, are material constants.
Later, Takamizawa and Hayashi (11) proposed a logarithmic form of the function described by
r0W ¼ C lnð1 auuE2uu=2 azzE2zz=2 auzEuuEzzÞ (13)
where C, auu, azz, and auz characterize the elastic properties of a material.
By using one of these strain energy equations or another type of equation for W in Eqs. 9 and 10, and applying the equations of equilibrium and boundary conditions, we determine the values of material constants. Although all of the proposed formulations describe quite well the elastic behavior of arterial walls, we prefer to reduce the number of constants included in the equations in order to handle them more easily, as well as to give physical meanings to the constants. For this reason, the logarithmic expression (Eq. 13) may be advantageous.
ELASTIC PROPERTIES OF NORMAL ARTERIES
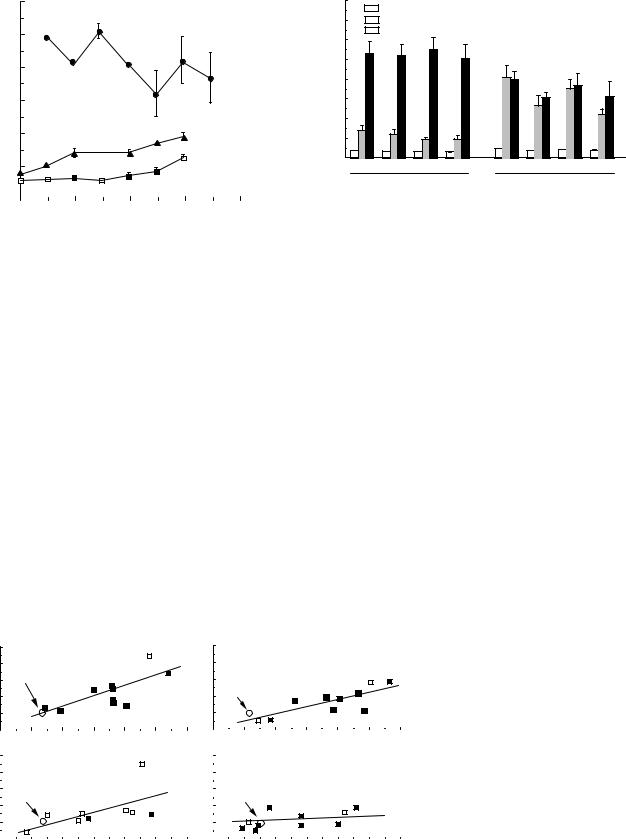
Figure 3 shows b values of common carotid arteries, intracranial vertebral arteries, and coronary arteries obtained from autopsied human subjects of different ages (7). Note that arterial stiffness is much larger in the coronary arteries than in the other arteries, and also that intracranial vertebral arteries are considerably stiffer than extracranially located common carotid arteries. As can be seen from this figure, almost all the data obtained from normal human aortas and conduit arteries show that the structural stiffness of wall (e.g., Ep and b) increases with age rather gradually until the age of 40 years, and rapidly thereafter; on the other hand, the wall compliance (Cv) decreases with age. The stiffness of intracranial arteries like the intracranial vertebral artery progressively increases until 20 years, and then more slowly (6). There seems to be almost no age-related change in the human coronary artery (12).
ARTERIES, ELASTIC PROPERTIES OF |
89 |
Stiffness parameter b
60
50
40
Coronary artery
30
20 |
Intracranial vertebral artery |
|
|
|
|
|
|
|
10
Pressure strain elastic modulus
80 |
|
Ep at 100 mmHg |
Psys = Systolic blood pressure |
|
|
||
70 |
|
Ep at Psys |
p<0.05 vs Normotensive |
|
|||
|
|||
|
|
Ep at 200 mmHg |
(Mean ± SE) |
|
|
|
60 |
|
|
|
|
|
|
|
(mmHg) |
50 |
|
|
|
|
|
|
|
40 |
|
|
|
|
|
|
|
|
|
|
|
|
|
|
|||
|
|
|
|
|
|
|
||
p |
|
|
|
|
|
|
||
|
|
|
|
|
|
|
||
E |
30 |
|
|
|
|
|
|
|
|
|
|
|
|
|
|
|
|
|
20 |
|
|
|
|
|
|
|
|
|
|
|
|
|
|
|
|
|
10 |
|
|
|
|
|
|
|
|
|
|
|
|
|
|||
|
0 |
4wks |
8wks |
16wks |
2wks |
4wks |
8wks |
16wks |
|
2wks |
|
|
|
|
|
|
|
|
|
|
|
|
|
Normotensive |
Hypertensive |
|
|
|
|
|
|
|
|
Common carotid artery |
|
|||||
|
|
|
|
|
|
|
|
|
||||||
|
|
|
|
|
|
|
|
|
(Psys = 134 mmHg) |
(Psys = 197 mmHg) |
||||
|
|
|
|
|
|
|
|
|
|
|
|
|
||
0 |
20 |
40 |
60 |
80 |
|
|||||||||
|
|
|
|
|
|
Age Y (Year) |
|
|
Figure 4. Structural stiffness of thoracic arotas in normotensive |
|||||
|
|
|
|
|
|
|
|
|
|
|
|
|
and hypertensive rats (7). |
|
Figure 3. Age-related changes in the wall stiffness of human arteries. (In vitro studies, reproduced from Ref. 7.)
Most of the data obtained from arteries in animals indicated that the incremental elastic modulus or the slope of stress–strain curve increases with age, although there are several opposite data (13).
ELASTIC PROPERTIES OF DISEASED ARTERIES
Hypertension
Hypertension is recognized as one of the important risk factors for many cardiovascular diseases, including atherosclerosis and stroke. Elevated blood pressure exerts influences on the synthetic activity of vascular smooth muscle cells, and is believed to induce changes in structure and morphology of the arterial wall, its mechanical properties, and vascular contractility. It is therefore very important to understand arterial mechanics in hypertension. However, results from the extensive literature concerning the elastic properties of hypertensive arteries are contradictory and inconclusive (1,7,13,14). As mentioned above, when we analyze the reported data, we should remember that the values of such parameters as Ep (Eq. 3) and Cv (Eq. 4) are dependent on pressure. Without this consideration, com-
parisons between the results from different studies have little meaning.
Several studies have been performed to determine the pressure–diameter or pressure–volume relationships of aortas and arteries in hypertensive animals and humans. For example, comparison of hypertensive rats to normotensive controls has shown that at 100 mmHg (13.3 kPa) and also at the working pressure (systolic blood pressure before sacrifice, Psys) of each group, the pressure strain elastic modulus, Ep of the thoracic aorta is greater in hypertensives than in normals; whereas at 200 mmHg (26.6 kPa) the Ep values in the hypertensive animals are slightly lower than those of the normals (Fig. 4) (7). These results do not depend on the duration of hypertension for 2–16 weeks.
With regard to the inherent elastic modulus of wall material calculated from pressure–diameter data, it has been shown that the incremental elastic moduli of the rat thoracic aorta (Huu in Eq. 7) at systolic blood pressure levels have significant correlations with blood pressure until 8 weeks after the induction of hypertension; at 16 weeks, however, the correlation disappears and the elastic modulus tends to be at the same level as that in control, normotensive rats (Fig. 5) (7). There are no significant differences in the incremental elastic modulus at
Elastic modulus at Psys
Hθθ (MPa)
10 |
2 wks |
10 |
8 wks |
|
|
|
|||||
8 |
Control |
|
|
8 |
r=0.79 |
|
|
|
|||
6 |
|
|
|
|
|
6 |
|
|
|
||
|
|
|
(p<0.01) |
|
|
|
|||||
|
|
|
|||||||||
|
|
|
|
|
|||||||
4 |
r=0.74 |
4 |
Control |
(p<0.02) |
|
||
2 |
2 |
|
|
|
|
0 |
|
|
|
|
|
|
|
|
|
|
|
|
|
|
|
|
|
|
|
|
|
|
|
|
|
0 |
|
|
|
|
|
|
|
|
|
|
|
|
|
|
|
|
|
|
|
|
|
|
|
|
|
|
|
|
|
|
|
|
|
|
|
|
|
|
|
|
|
|
|
|
|
|
|
|
|
|
|
|
|
|
|
|
|
|
|
|
|
|
|
|
|
|
|
|
|
|
|
||
|
|
|
|
|
|
|
|
|
|
|
|
|
|
|
|
|
|
|
|
|
|
|
|
|
|
|
|
|
|
|
|
|
|
|
|
|
|
|
|
|
|
|
|
|
|
|
|
||
100 |
125 |
150 |
175 |
200 |
|
225 |
250 |
100 |
125 |
150 |
175 |
200 |
|
225 |
250 |
||||||||||||||||||||||||||||||||||
10 |
|
|
4 wks |
|
|
|
|
|
|
|
|
|
|
|
|
|
|
|
|
|
|
|
|
10 |
|
16 wks |
|
|
|
|
|
|
|
|
|
|
|
|
|
|
|
|
|||||||
|
|
|
|
|
|
|
|
|
|
|
|
|
|
|
|
|
|
|
|
|
|
|
|
|
|
|
|
|
|
|
|
|
|
|
|
|
|
||||||||||||
8 |
|
|
|
|
|
|
|
|
|
|
r=0.68 |
|
|
|
|
|
|
8 |
|
|
|
|
|
|
|
|
|
|
|
|
|
|
|
|
|
||||||||||||||
|
|
|
|
|
|
|
|
|
|
|
|
|
|
|
|
|
|
|
|
|
|
|
|
|
|
|
|
|
|
|
|
|
|||||||||||||||||
|
|
|
|
|
|
|
|
|
|
|
|
|
|
|
|
|
|
|
|
|
|
|
|
|
|
|
|
|
|
|
|
|
|
|
|
|
|
|
|
|
|
||||||||
6 |
|
|
|
|
|
|
|
|
|
|
|
|
|
|
|
|
|
|
|
6 |
|
|
|
|
|
|
|
|
|
|
|
|
|
|
r=0.59 |
|
|
|
|
||||||||||
|
Control |
|
|
|
|
|
|
|
|
(p<0.05) |
|
|
|
|
|
|
|
|
|
|
|
|
|
|
|
|
|
|
|
|
|
|
|
|
|||||||||||||||
|
|
|
|
|
|
|
|
|
|
|
|
|
|
|
|
Control |
|
|
|
|
|
|
|
(N.S.) |
|
|
|
|
|||||||||||||||||||||
4 |
|
|
|
|
|
|
|
|
|
|
|
|
|
|
|
|
|
|
|
|
|
4 |
|
|
|
|
|
|
|
|
|
|
|
|
|||||||||||||||
|
|
|
|
|
|
|
|
|
|
|
|
|
|
|
|
|
|
|
|
|
|
|
|
|
|
|
|
|
|
|
|
|
|
|
|
|
|
|
|
|
|
|
|
|
|
|
|
||
2 |
|
|
|
|
|
|
|
|
|
|
|
|
|
|
|
|
|
|
|
|
|
|
|
|
|
2 |
|
|
|
|
|
|
|
|
|
|
|
|
|
|
|
|
|
|
|
|
|
|
|
0 |
|
|
|
|
|
|
|
|
|
|
|
|
|
|
|
|
|
|
|
|
|
|
|
|
|
0 |
|
|
|
|
|
|
|
|
|
|
|
|
|
|
|
|
|
|
|
|
|
|
|
|
|
125 |
150 |
175 |
200 |
|
225 |
250 |
|
125 |
|
150 |
175 |
200 |
|
225 |
250 |
||||||||||||||||||||||||||||||||
100 |
|
100 |
|
|
|||||||||||||||||||||||||||||||||||||||||||||
Systolic blood pressure Psys (mmHg)
Figure 5. Incremental elastic modulus versus blood pressure in the rat aorta at 2, 4, 8, and 16 weeks after the treatment for hypertension (7).
90 ARTERIES, ELASTIC PROPERTIES OF
100 mmHg (13.3 kPa) regardless of the period of hypertension. The aortic wall in hypertensive rats seems to restore the in vivo elastic properties to a normal level in 16 weeks due to the functional adaptation and remodeling of the wall.
In connection with the elastic properties of wall, many data have shown that the arterial wall is thickened by hypertension and hypertrophy occurs (14). Wall thickness critically depends on pressure level and, therefore, we have to pay attention to the pressure for the thickness measurement when we interpret the results. If the thickness of wall at the in vivo blood pressure level is used to calculate in vivo wall stress in the circumferential direction (hoop stress), the stress is independent of the degree of hypertension and is always maintained at a control, normal level even at 2 weeks after the induction of hypertension. This phenomenon is attributable to a functional adaptation and remodeling of the arterial wall (15).
Atherosclerosis
Effects of flow dynamics and wall shear stress on the initiation and development of atherosclerosis have been studied extensively. However, less attention has been paid to the mechanical properties of atherosclerotic wall tissue. Does atherosclerosis stiffen the arterial wall or increase the elastic modulus of wall? The results obtained have been conflicting and inconclusive, as shown in Table 1 (7). One of the reasons for this is that the structural stiffness of arterial wall and the elasticity of wall material have been confusingly used for the expression of the elastic properties of atherosclerotic wall. In this table, the elastic modulus represents the elasticity of wall material, which corresponds to the slope of stress–strain curve and is given by, for example, the incremental elastic modulus, Huu; the stiffness is the structural stiffness expressed by, for example, the stiffness parameter, b.
Several studies have shown that the arterial wall is stiffened by the development of atherosclerosis. However, others have presented different results. Thus it has not been clear whether atherosclerosis increases the elastic modulus of arterial wall. We can see from Table 1 that atherosclerosis is mostly accompanied by wall thickening. This might be a reason why there are no data indicating a decrease in the structural stiffness associated with atherosclerosis. The structural stiffness is determined not only by the elastic modulus of wall material, but also by wall dimensions such as wall thickness.
A detailed and systematic study on the mechanical properties and morphology of atherosclerotic aortas in the rabbit has shown that the changes in the wall stiffness (b) and the elastic modulus (Huu) are not always correlated
Table 1. Distributions of Reported Data of the Elasticity, Stiffness, and Thickness of Atherosclerotic Walla
|
No. of |
Increase, |
No Change, |
Decrease, |
|
Data |
% |
% |
% |
|
|
|
|
|
Elastic modulus |
17 |
29 |
47 |
24 |
Stiffness |
17 |
71 |
29 |
0 |
Wall thickness |
12 |
67 |
25 |
8 |
aSee Ref. 7
Area fraction of intimal hyperplasia Ah (%)
70
60
(Mean±SE)
50
40
30 |
|
20 |
|
10 |
|
0 |
|
0 |
I |
II |
III |
Grade of atherosclerosis
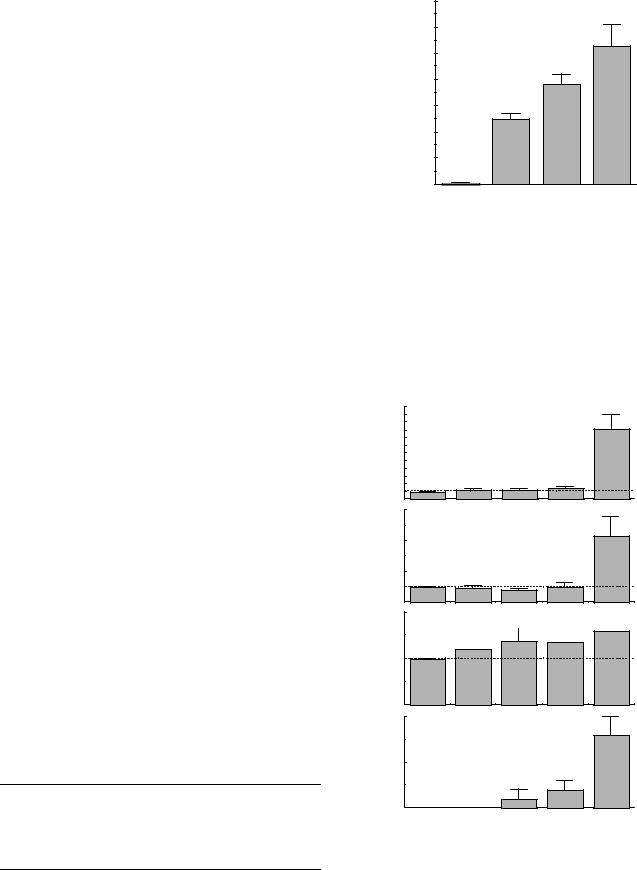
Figure 6. Area fraction of intimal hyperplasia in atherosclerotic thoracic aortas in the rabbit (7). Atherosclerosis was induced by the combination of denudation of endothelial cells and cholesterol diet.
with the time of cholesterol diet feeding (16). Thus, the grade of atherosclerosis was defined from the percent fraction of the luminal surface area stained with Sudan IV as well as from wall stiffening. The area fraction of intimal hyperplasia increases with the grade (Fig. 6). Likewise, wall thickness steadily increases with the progression
12 |
* p<0.02 (vs Control) |
|
|
* |
|
|
(Mean±SE) |
|
|
|
|
8 |
Stiffness |
|
|
|
|
4 |
(Ratio vs. Control) |
|
|
|
|
1 |
|
* |
6 |
|
|
4 |
Elastic modulus |
* |
(Ratio vs. Control) |
|
|
|
|
|
2 |
|
|
1 |
|
|
2
Wall thickness (Ratio vs. Control)
 *
*
1

 * *
* *  *
*
10
Area fraction of |
|
|
|
|
calcified region (%) |
|
|
|
|
5 |
|
|
|
|
0 |
|
|
|
|
Control |
0 |
I |
II |
III |
|
Grade of atherosclerosis |
|
||
Figure 7. Elasticity, wall thickness, and calcification of athorosclerotic thoracic aortas in the rabbit (7).