

- •VOLUME 1
- •CONTRIBUTOR LIST
- •PREFACE
- •LIST OF ARTICLES
- •ABBREVIATIONS AND ACRONYMS
- •CONVERSION FACTORS AND UNIT SYMBOLS
- •ABLATION.
- •ABSORBABLE BIOMATERIALS.
- •ACRYLIC BONE CEMENT.
- •ACTINOTHERAPY.
- •ADOPTIVE IMMUNOTHERAPY.
- •AFFINITY CHROMATOGRAPHY.
- •ALLOYS, SHAPE MEMORY
- •AMBULATORY MONITORING
- •ANALYTICAL METHODS, AUTOMATED
- •ANALYZER, OXYGEN.
- •ANESTHESIA MACHINES
- •ANESTHESIA MONITORING.
- •ANESTHESIA, COMPUTERS IN
- •ANGER CAMERA
- •ANGIOPLASTY.
- •ANORECTAL MANOMETRY
- •ANTIBODIES, MONOCLONAL.
- •APNEA DETECTION.
- •ARRHYTHMIA, TREATMENT.
- •ARRHYTHMIA ANALYSIS, AUTOMATED
- •ARTERIAL TONOMETRY.
- •ARTIFICIAL BLOOD.
- •ARTIFICIAL HEART.
- •ARTIFICIAL HEART VALVE.
- •ARTIFICIAL HIP JOINTS.
- •ARTIFICIAL LARYNX.
- •ARTIFICIAL PANCREAS.
- •ARTERIES, ELASTIC PROPERTIES OF
- •ASSISTIVE DEVICES FOR THE DISABLED.
- •ATOMIC ABSORPTION SPECTROMETRY.
- •AUDIOMETRY
- •BACTERIAL DETECTION SYSTEMS.
- •BALLOON PUMP.
- •BANKED BLOOD.
- •BAROTRAUMA.
- •BARRIER CONTRACEPTIVE DEVICES.
- •BIOCERAMICS.
- •BIOCOMPATIBILITY OF MATERIALS
- •BIOELECTRODES
- •BIOFEEDBACK
- •BIOHEAT TRANSFER
- •BIOIMPEDANCE IN CARDIOVASCULAR MEDICINE
- •BIOINFORMATICS
- •BIOLOGIC THERAPY.
- •BIOMAGNETISM
- •BIOMATERIALS, ABSORBABLE
- •BIOMATERIALS: AN OVERVIEW
- •BIOMATERIALS: BIOCERAMICS
- •BIOMATERIALS: CARBON
- •BIOMATERIALS CORROSION AND WEAR OF
- •BIOMATERIALS FOR DENTISTRY
- •BIOMATERIALS, POLYMERS
- •BIOMATERIALS, SURFACE PROPERTIES OF
- •BIOMATERIALS, TESTING AND STRUCTURAL PROPERTIES OF
- •BIOMATERIALS: TISSUE-ENGINEERING AND SCAFFOLDS
- •BIOMECHANICS OF EXERCISE FITNESS
- •BIOMECHANICS OF JOINTS.
- •BIOMECHANICS OF SCOLIOSIS.
- •BIOMECHANICS OF SKIN.
- •BIOMECHANICS OF THE HUMAN SPINE.
- •BIOMECHANICS OF TOOTH AND JAW.
- •BIOMEDICAL ENGINEERING EDUCATION
- •BIOSURFACE ENGINEERING
- •BIOSENSORS.
- •BIOTELEMETRY
- •BIRTH CONTROL.
- •BLEEDING, GASTROINTESTINAL.
- •BLADDER DYSFUNCTION, NEUROSTIMULATION OF
- •BLIND AND VISUALLY IMPAIRED, ASSISTIVE TECHNOLOGY FOR
- •BLOOD BANKING.
- •BLOOD CELL COUNTERS.
- •BLOOD COLLECTION AND PROCESSING
- •BLOOD FLOW.
- •BLOOD GAS MEASUREMENTS
- •BLOOD PRESSURE MEASUREMENT
- •BLOOD PRESSURE, AUTOMATIC CONTROL OF
- •BLOOD RHEOLOGY
- •BLOOD, ARTIFICIAL
- •BONDING, ENAMEL.
- •BONE AND TEETH, PROPERTIES OF
- •BONE CEMENT, ACRYLIC
- •BONE DENSITY MEASUREMENT
- •BORON NEUTRON CAPTURE THERAPY
- •BRACHYTHERAPY, HIGH DOSAGE RATE
- •BRACHYTHERAPY, INTRAVASCULAR
- •BRAIN ELECTRICAL ACTIVITY.
- •BURN WOUND COVERINGS.
- •BYPASS, CORONARY.
- •BYPASS, CARDIOPULMONARY.
Standard – 5th ed. H3-A5, Vol 23, Number 32. NCCLS, Wayne (PA).
4.Becton, Dickinson and Company. 2004, BD Vacutainer Order of Draw for Multiple Tube Collections. Available at www.bd.com/vacutainer.
5.Centers for Disease Control and Prevention (CDC). Revised Guidelines for performing CD4þ T-cell determinations in persons infected with human immunodeficiency virus (HIV). MMWR. 1997;46(No.RR-2):1–29.
6.Deems D, et al. 1994, FACSCount White paper. Becton Dickenson. Available at www.bdbiosciences.com/immunocytometrysystems/ whitepapers/pdf/FcountWP.pdf.
7.Dieye TN, et al. Absolute CD4 T-Cell Counting in ResourcePoor Settings: Direct Volumetric Measurements Versus Bead-Based Clinical Flow Cytometry Instruments. J Acquir Immune Defic Syndr 2005;39:32–37.
8.Maino VC, Maecker HT. Cytokine flow cytometry: a multiparametric approach for assessing cellular immune responses to viral antigens. Clin Immunol. 2004;110:222–231.
9.Wiseman JD et al. Procedures for the Handling and Processing of Blood Specimens; CLSI (NCCLS) Approved Guideline. 2nd ed. H18-A2. Vol. 19 Number 21. 1999. NCCLS, Wayne, PA
10.Boyum A. Isolation of mononuclear cells and granulocytes from human blood. Scand J Clin Lab Invest 1968;21:77–89.
11.Cox J et al. Accomplishing cellular immune assays for evaluation of vaccine efficacy. In: Hamilton RG, Detrich B, Rose NR; Manual Clinical Laboratory Immunology 6th ed. Washington (DC): ASM Press; 2002. Chapt. 33. pp 301–315.
See also ANALYTICAL METHODS, AUTOMATED; CELL COUNTERS, BLOOD;
DIFFERENTIAL COUNTS, AUTOMATED.
BLOOD FLOW. See BLOOD RHEOLOGY; HEMODYNAMICS.
BLOOD GAS MEASUREMENTS
AHMAD ELSHARYDAH
RANDALL C. CORK
Louisiana State University
Shreveport, Louisiana
INTRODUCTION
Blood gas measurement–monitoring is essential to monitor gas exchange in critically ill patients in the intensive care units (1,2), and ‘‘standard of care’’ monitoring to deliver general anesthesia (3). It is a cornerstone in the diagnosis and management of the patient’s oxygenation and acid– base disorders (4). Moreover, it may indicate the onset or culmination of cardiopulmonary problems, and may help in evaluating the effectiveness of the applied therapy. Numerous studies and reports have shown the significance of utilizing blood gas analyses in preventing serious oxygenation and acid–base problems. This article gives a summarized explanation of the common methods and instruments used nowadays in blood gas measurements in clinical medicine. This explanation includes a brief history of the development of these methods and instruments, the principles of their operation, a general descrip-
BLOOD GAS MEASUREMENTS |
465 |
tion of their designs, and some of their clinical uses, hazards, risks, limitations, and finally the direction in the future to improve these instruments or to invent new ones. Blood gas measurement in clinical medicine can be classified into two major groups: (1) Noninvasive blood gas measurement, which includes blood oxygen– carbon dioxide measurement–monitoring by using different types of pulse oximeters (including portable pulse oximeters), transcutaneous oxygen partial pressure– carbon dioxide partial pressure (PO2/PCO2) monitors, intrapartum fetal pulse oximetry, cerebral oximetry, capnometry, capnography, sublingual capnometry, and so on;
(2) invasive blood gas measurement, which involves obtaining a blood sample to measure blood gases by utilizing blood gas analyzers (in a laboratory or by using a bedside instrument), or access to the vascular system to measure/ monitor blood gases. Examples include, but not limited to, mixed venous oximetry (SvO2) monitoring by utilizing pulmonary artery catheter or jugular vein (SvO2) measurement (5); continuous fibroptic arterial blood gas monitoring, and so on. In this article, we will talk about some of these methods; others have been mentioned in other parts of this encyclopedia.
BASIC CONCEPTS IN INVASIVE AND NONINVASIVE BLOOD GAS MEASUREMENTS
The Gas Partial Pressure
Gases consist of multiple molecules in rapid, continuous, random motion. The kinetic energy of these molecules generate a force as the molecules collide with each other and bounce from one surface to another. The force per unit area of a gas is called pressure, and can be measured by a device called a manometer. In a mixture of gases (e.g., a mixture of O2, CO2, and water vapor), several types of gas molecules are present within this mixture, and each individual gas (e.g., O2 or CO2) in the mixture is responsible for a portion of the total pressure. This portion of pressure is called partial pressure (P). According to Dalton’s law, the total pressure is equal to the sum of partial pressures in a mixture of gases. Gases dissolve freely in liquids, and may or may not react with the liquid, depending on the nature of the gas and the liquid. However, all gases remain in a free gaseous phase to some extent within the liquid. Gas dissolution in liquids is a physical, not chemical, process. Therefore, gases (e.g., CO2, O2) dissolved in liquid (blood) exist in two phases: liquid and gaseous phase. Henry’s law states that the partial pressure of a gas in the liquid phase equilibrates with the partial pressure of that gas in the gaseous phase (6,7).
BLOOD GAS ELECTRODES
Basic Electricity Terms
Electricity is a form of energy resulting from the flow of electrons through a substance (conductor). Those electrons flow from a negatively charged pole called Cathode, which has an excess of stored electrons, to a positively charged pole called Anode, which has a relative shortage
466 BLOOD GAS MEASUREMENTS
of electrons. The potential is the force responsible for pumping these electrons between the two poles. The greater the difference in electron concentration between these two poles, the greater is the potential. Volt is the potential measurement unit. The electrical current is the actual flow of electrons through a conductor. Ampere (amp) is the unit of measurement for the electrical current. Conductors display different degree of electrical resistance to the flow of the electrical current. The unit of the electrical resistance is ohm (V). Ohm’s law states: voltage ¼ current resistance.
The Principles of Blood Gas Electrodes
Blood gas electrodes are electrochemical devices used to measure directly pH and blood gases. These blood gas electrodes use electrochemical cells. The electrochemical cell is an apparatus that consists of two electrodes placed in an electrolyte solution. These cells usually incorporated together (one or more cells) to form an electrochemical cell system. These systems are used to measure specific chemical materials (e.g., PO2, PCO2 and pH). The basic generic blood gas electrode consists of two electrode terminals, which are also called half-cells: one is called the working half-cell where the actual chemical analysis occurs, or electrochemical change is taken place; and the other one is called the reference half-cell. The electrochemical change occurring on the working terminal is compared to the reference terminal, and the difference is proportional to the amount of blood gas in the blood sample (6,7).
P O2 Electrode
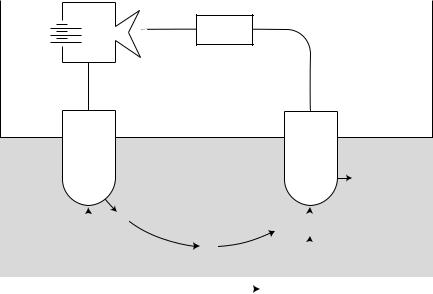
The PO2 electrode basically consists of two terminals (1). The cathode, which usually made of platinum (negatively charged) and (2) the anode, which usually made of silver– sliver chloride (positively charged). How does this unit measure PO2 in the blood sample? As shown in Fig. 1,
the electricity source (battery or wall electricity) supplies the platinum cathode with energy (voltage of 700 mV). This voltage attracts oxygen molecules to the cathode surface, where they react with water. This reaction consumes four electrons for every oxygen molecule reacts with water and produces four hydroxyl ions. The consumed four electrons, in turn, are replaced rapidly in the electrolyte solution as silver and chloride react at the anode. This continuous reaction leads to continuous flow of electrons from the anode to the cathode (electrical current). This electrical current is measured by using an ammeter (electrical current flow meter). The current generated is in direct proportion to the amount of dissolved oxygen in the blood sample, which in direct proportion to PO2 in that sample.
Oxygen Polarography
The electrical current and PO2 have a direct (linear) relationship when a specific voltage is applied to the cathode. Therefore, a specific voltage must be identified, to be used in PO2 analysis. The polarogram is a graph that shows the relationship between voltage and current at a constant PO2. As shown in Fig. 2, when the negative voltage applied to the cathode is increased, the current increases initially, but soon it becomes saturated. In this plateau region of the polarogram, the reaction of oxygen at the cathode is so fast that the rate of reaction is limited by the diffusion of oxygen to the cathode surface. When the negative voltage is further increased, the current output of the electrode increases rapidly due to other reactions, mainly, the reduction of water to hydrogen. If a fixed voltage in the plateau region (e.g., 0.7 V) is applied to the cathode, the current output of the electrode can be linearly calibrated to the dissolved oxygen. Note that the current is proportional not to the actual concentration, but to the activity or equivalent partial pressure of dissolved oxygen. A fixed voltage between 0.6 and 0.8 V is usually selected as the
Battery
_
Ammeter
+
Silver |
Platinum |
anode |
cathode |
−
OH
|
|
e− |
|
e− + O |
|
|
+ H |
O |
|
|
|
|
|
||||
|
|
2 |
||||||
|
Cl |
|
||||||
|
|
|
2 |
|
||||
|
|
e− |
|
|
|
|
|
|
|
|
|
|
|
|
|
||
|
|
O2 |
|
|||||
|
|
|
|
|
||||
|
|
|
|
|
|
|
|
|
|
|
O2 + 2H2O + 4e− |
|
4 OH− |
|
|
|
|
|
|
|
|
|
|
|||
Figure 1. PO2 electrode. |
|
|
|
|
|
|
||
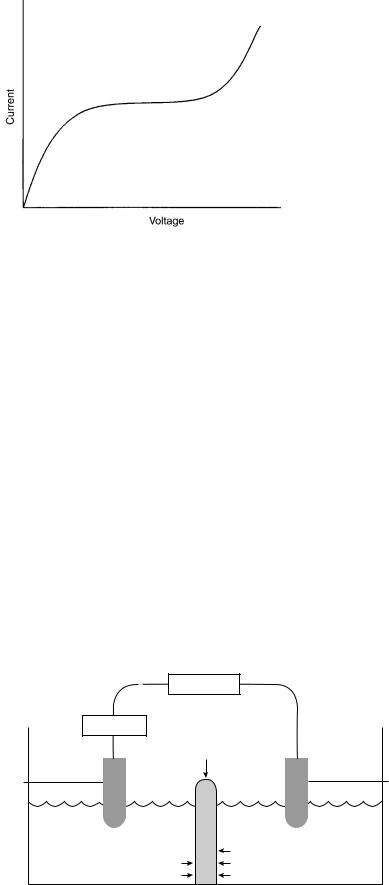
Figure 2. Polarogram.
polarization voltage when using Ag/AgCl as the reference electrode.
pH Electrode
The pH electrode uses voltage to measure pH, rather than actual current as in PO2 electrode. It compares a voltage created through the blood sample (with unknown pH) to known reference voltage (in a solution with known pH). To make this possible, the pH electrode basically needs four electrode terminals (Fig. 3), rather than two terminals (as in the PO2 electrode). Practically, one common pH-sensitive glass electrode terminal between the two solutions is adequate. This glass terminal allows the hydrogen ions to diffuse into it from each side. The difference in the hydrogen ions concentration across this glass terminal creates a net electrical potential (voltage). A specific equation is used to calculate the blood sample pH, using the reference fluid pH, the created voltage, and the fluid temperature.
PCO2 Electrode
The PCO2 electrode is a modified pH electrode. There are two major differences between this electrode and the pH
BLOOD GAS MEASUREMENTS |
467 |
electrode. The first difference is that in this electrode, the blood sample comes in contact with a CO2 permeable membrane (such as Teflon, Silicone rubber), rather than a pH-sensitive glass (in the pH electrode), as shown in Fig. 4. The CO2 from the blood sample diffuses via the CO2 permeable (silicone) membrane into a bicarbonate solution. The amount of the hydrogen ions produced by the hydrolysis process in the bicarbonate solution is proportional to the amount of the CO2 diffused through the silicone membrane. The difference in the hydrogen ions concentration across the pH-sensitive glass terminal creates a voltage. The measured voltage (by voltmeter) can be converted to PCO2 units. The other difference is that the CO2 electrode has two similar electrode terminals (silver–silver chloride). However, the pH electrode has two different electrode terminals (silver–silver chloride and mercury–mercurous chloride).
BLOOD GAS PHYSIOLOGY (8,9)
Oxygen Transport
Oxygen is carried in the blood in two forms: A dissolved small amount and a much bigger, more important component combined with hemoglobin. Dissolved oxygen plays a small role in oxygen transport because its solubility is so low, 0.003 mL O2 /100 mL blood per mmHg (133.32 Pa). Thus, normal arterial blood with a PO2 of 100 mmHg (13332.2 Pa) contains only 0.3 mL of dissolved oxygen per 100 mL of blood, whereas 20 mL is combined with hemoglobin. Hemoglobin consists of heme, an iron– porphyrin compound, and globin, a protein that has four polypeptide chains. There are two types of chains, alpha and beta, and differences in their amino acid sequences give rise to different types of normal and abnormal human hemoglobin, such as, hemoglobin F (fetal) in the newborn, and hemoglobin S in the sickle cell anemia patient. The combination of oxygen (O2) with hemoglobin (Hb) (to form oxyhemoglobin–HbO2) is an easily reversible. Therefore, blood is able to transport large amounts of oxygen.
The relationship between the partial pressure of oxygen and the number of binding sites of the hemoglobin that have oxygen attached to it, is known as the oxygen dis-
VOLTMETER
Common
pH-sensitive
AMPLIFIER glass electrode terminal
Ag/AgCl |
|
Hg/HgCl |
half-cell |
|
half-cell |
Reference solution |
|
Fluid with |
with known pH |
H+ |
unknown pH |
H+ |
H+ |
|
H+ |
H+ |
Figure 3. pH electrode. |
|
|

468 BLOOD GAS MEASUREMENTS
AMPLIFIER
Ag/AgCl
half-cell
Reference solution with known pH
Figure 4. PCO2 electrode.
sociation curve (Fig. 5). Each gram of pure hemoglobin can combine with 1.39 mL of oxygen, and because normal blood has 15 g Hb/100 mL, the oxygen capacity (when all the binding sites are full) is 20.8 mL O2/100 mL blood. The total oxygen concentration of a sample of blood, which includes the oxygen combined with Hb and the dissolved oxygen, is given by (Hb 1.36 SaO2) þ (0.003 PaO2) Hb is the hemoglobin concentration.
The characteristic shape of the oxygen dissociation curve has several advantages. The fact that the upper portion is almost flat means that a fall of 20–30 mmHg in arterial PO2 in a healthy subject with an initially normal value (e.g., 100 mmHg or 13332.2 Pa) causes only a minor reduction in arterial oxygen saturation. Another consequence of the flat upper part of the curve is that loading of oxygen in the pulmonary capillary is hastened. This results from the large partial pressure difference between alveolar gas and capillary blood that continues to exist even when most of the oxygen has been loaded. The steep lower part of the oxygen dissociation curve means that considerable amounts of oxygen can be unloaded to the peripheral tissues with only a relatively small drop in capillary PO2. This maintains a large partial pressure difference between the blood and the tissues, which assists in the diffusion process. Various factors affect the position of the oxygen dissociation curve, as shown in Fig. 5. It is shifted to the right by an increase of temperature, hydrogen ion concentration, PCO2, and concentration of 2,3-diphosphoglycerate in the red cell. A rightward shift indicates that the affinity of oxygen for hemoglobin is reduced. Most of the effect of the increased PCO2 in reducing the oxygen affinity is due to the increased hydrogen concentration. This is called the Bohr effect, and it means that as peripheral blood loads carbon dioxide, the unloading of oxygen is assisted. A useful measure of the position of the dissociation curve is the PO2 for 50% oxygen saturation; this is known as the P50. The normal value for human blood is 27 mmHg (3599.6 Pa).
VOLTMETER
Common pH-sensitive glass electrode terminal
|
|
|
|
|
|
|
|
Ag/AgCl |
|
|
|
|
|
|
|
|
half-cell |
|
|
Bicarbonate |
|
|
|
|||
H+ |
H+ |
solution |
|
|
|
|
||
H+ |
|
|
|
|
|
|
|
|
H+ |
H+ + HCO− |
H |
CO |
3 |
H |
O + CO |
2 |
Silicone |
|
3 |
2 |
|
2 |
|
|||
|
Blood |
|
|
|
|
CO2 |
membrane |
|
|
|
|
|
|
|
|||
such as carbamino compounds (Fig. 6). Dissolved carbon dioxide obeys Henry’s law (as mentioned above). Because carbon dioxide is some 24 times more soluble than oxygen in blood, dissolved carbon dioxide plays a much more significant role in its carriage compared to oxygen. For example, 10% of the carbon dioxide that evolves into the alveolar gas from the mixed venous blood comes from the dissolved form. Bicarbonate is formed in blood by the following hydration reaction:
CO2 þ H2O$H2CO3$Hþ þ HCO3
The hydration of carbon dioxide to carbonic acid (and vice versa) is catalyzed by the enzyme carbonic anhydrase (CA), which is present in high concentrations in the red cells, but is absent from the plasma. However, some carbonic anhydrase is apparently located on the surface of the endothelial cells of the pulmonary capillaries. Because of the presence of carbonic anhydrase in the red cell, most of the hydration of
100 |
pH |
Temperature |
 P CO2
P CO2
 2,3-DPG
 Fetal Hb
(%) |
|
|
|
|
pH |
Saturation |
|
|
|
|
|
50 |
|
|
|
Temperature |
|
|
|
|
|
||
|
|
|
|
P CO2 |
|
|
|
|
|
||
|
|
|
|
|
|
|
|
|
|
||
|
|
|
|
|
2,3-DPG |
|
|
|
|
||
|
|
|
|
0
50 |
100 |
Carbon Dioxide Transport
Carbon dioxide is transported in the blood in three forms: dissolved, as bicarbonate, and in combination with proteins
PO2 (mmHg)
Figure 5. Oxygen dissociation curve and the effects of different factors on it.

CO2
Tissue
Blood
5−10% CO2 |
|
|
|
|
20−30% CO2 |
|
60−70% |
||
in physical solution |
bound to proteins |
|||
|
|
|
|
CO2 chemically |
plasma |
|
|
|
converted to HCO3− |
|
|
|
||
|
|
|
|
|
protein |
|
|
|
|
albumin |
|
|
RBC |
|
|
|
|
|
HCO3− travels to lung |
|
|
|
|
capillaries in plasma |
Figure 6. Carbon dioxide transport in blood.
carbon dioxide occurs there, and bicarbonate ion moves out of the red cell to be replaced by chloride ions to maintain electrical neutrality (chloride shift). Some of the hydrogen ions formed in the red cell are bound to Hb, and because reduced Hb is a better proton acceptor than the oxygenated form, deoxygenated blood can carry more carbon dioxide for a given PCO2 than oxygenated blood can. This is known as the Haldane effect. Carbamino compounds are formed when carbon dioxide combines with the terminal amine groups of blood proteins. The most important protein is the globin of hemoglobin. Again, reduced hemoglobin can bind more carbon dioxide than oxygenated hemoglobin, so the unloading of oxygen in peripheral capillaries facilitates the loading of carbon dioxide, whereas oxygenation has the opposite effect. The carbon dioxide dissociation curve, as shown in Fig. 7, is the relationship between PCO2 and total carbon dioxide concentration. Note that the curve is much more linear in its working range than the oxygen dissociation curve, and also that, as we have seen, the lower the saturation of hemoglobin with oxygen, the larger the carbon dioxide concentration for a given PCO2.
|
60 |
|
[Hg] = 15 g% |
|
|
|
0 |
|
|
|
|
|
|
|
|
50 |
|
|
|
|
|
|
|
|
|
100 |
%)(vol |
40 |
|
|
|
|
|
|
P O2 (mmHg) |
|
|
|
|
|
|
|
||
|
|
|
|
|
|
|
|
|
2 |
|
|
|
|
|
|
|
|
CO |
20 |
|
|
|
|
|
|
|
|
|
|
|
|
|
|
|
|
|
|
|
|
Dissolved CO2 |
|
|
|
|
|
0 |
|
|
|
|
|
|
|
|
|
10 |
20 |
30 |
40 |
50 |
60 |
|
|
0 |
|||||||
P CO2 (mm Hg)
Figure 7. The carbon dioxide dissociation curve showing the effect of PO2 variations.
BLOOD GAS MEASUREMENTS |
469 |
OXIMETRY
Historical Development
Oximetry has its origins in the early 1860s (10), when Felix Hoppe-Seyler described the hemoglobin absorption of light using the spectroscope. He demonstrated that the light absorption was changed when blood was mixed with oxygen, and that hemoglobin and oxygen formed a compound called oxyhemoglobin. Soon after, George Gabriel Stokes reported that hemoglobin was in fact the carrier of oxygen in the blood. In 1929, Glen Allan Millikan (11), an American physiologist, began construction of a photoelectric blood oxygen saturation meter, which, used to measure color changes over time when desaturated hemoglobin solutions were mixed with oxygen solutions in an experimental setting. The use of photoelectric cells later proved to be crucial to the development of oximeters. In 1935, Kurt Kramer demonstrated, for the first time, in vivo measurement of blood oxygen saturation in animals. The same year, Karl Matthes introduced the ear oxygen saturation meter. This was the first instrument able to continuously monitor blood oxygen saturation in humans. In 1940, J.R. Squire introduced a two-channel oximeter that transmitted red and infrared (IR) light through the web of the hand. In 1940, Millikan and colleagues developed a functioning oximeter, and introduced the term ‘‘oximeter’’ to describe it. The instrument used an incandescent, battery-operated light and red and green filter. In 1948, Earl Wood of the Mayo Clinic made several improvements to Millikan’s oximeter, including the addition of a pressure capsule. Then, in the 1950s, Brinkman and Zijlstra of the Netherlands developed the reflectance oximetry. However, oximetry did not fully achieve clinical applicability until the 1970s.
Principles of Operation
It is important to understand some of the basic physics principles that led to the development of oximetry and pulse oximetry. This is a summary of these different physics principles and methods (7,12).
Spectrophotometry. The spectroscope is a device which was used initially to measure the exact wavelengths of light emitted from a light generator (bunsen burner) (10). Each substance studied with the spectroscope has its unique light emission spectrum, in other words, each substance absorbed and then emitted light of different wavelengths. The graph of the particular pattern of light absorption–emission of sequential light wavelengths called the absorption spectrum. Figure 8 reveals the absorption spectra of common forms of hemoglobin.
Colorimetry. Colorimetry is another method of qualitative analysis (10). In this method, the color of known substance is compared of that of unknown one. This method is not highly exact, because it depends on visual acuity and perception.
Photoelectric Effect. The photoelectric effect is the principle behind spectrophotometry. It is defined as the ability of light to release electrons from metals in proportion to the
470 |
|
|
|
BLOOD GAS MEASUREMENTS |
|
|
|
|||||||
Coefficient |
10 |
|
|
|
Red |
|
|
|
Infrared |
|
|
|
||
|
|
|
|
|
|
|
|
|
||||||
1 |
|
|
|
|
|
|
|
|
|
methemoglobin |
|
|
|
|
|
|
|
|
|
|
|
|
|
|
|
|
|
||
|
|
|
|
|
|
|
|
|
|
|
|
|
|
|
Extinction |
|
|
|
|
|
|
|
|
|
|
oxyhemoglobin |
|
|
|
.1 |
|
|
|
|
|
|
reduced hemoglobin |
|
|
|
||||
|
|
|
|
|
|
|
|
|
|
|||||
|
|
|
|
|
|
|
carboxyhemoglobin |
|
|
|
||||
|
|
|
|
|
|
|
|
|
||||||
|
|
|
|
|
|
|
|
|
|
|
||||
|
.01 |
|
|
|
|
|
|
|
|
|
|
|
|
|
|
600 |
700 |
800 |
900 |
1000 |
|||||||||
|
|
|
|
|
|
|
|
Wavelength (nm) |
|
|
|
|||
Figure 8. Absorption spectra of common forms of hemoglobin. Absorption spectra of oxyhemoglobin, deoxyhemoglobin, methemoglobin, carboxyhemoglobin.
intensity of the light. In spectrophotometry, light passes via a filter that converts the light into a specific wavelength. This light then passes through a container that contains the substance being analyzed. This substance absorbs part of this light and emits the remaining part, which goes through a special cell. This cell is connected to a photodetector, which detects and measures the emitting light (spectrophotometry). This method can be used for quantitive as well as qualitative analyses.
Lambert–Beer Law. This law combines the different factors that affect the light absorption of a substance:
log 10 Io=Ix ¼ kcd
Io ¼ intensity of light incident on the specimen
Ix ¼ intensity of the transmitted light
Io=Ix ¼ optical density
As shown in the above formula, the concentration of absorbing substance, the path length of the absorbing medium (d) and the characteristics of the substance and the light wavelength (k ¼ constant) all affect light absorption (12).
Transmission Versus Reflection Oximetry. When the light at a particular wavelength passes through a blood sample, which contains Hb, this light would be absorbed, transmitted, or reflected. The amount of the absorbed, transmitted, or reflected light at those particular wavelengths is determined by various factors, including the concentration (Lambert–Beer law) and the type of the Hb present in the blood sample. The amount of light transmitted through the blood sample at a given wavelength is related inversely to the amount of light absorbed or reflected. The transmission oximetry is a method to determine the arterial oxygen saturation (SaO2) value by measuring the amount of light transmitted at certain wavelengths. On the other side, in the reflection oximetry, measuring the amount of light reflected is used to determine the SaO2 value. The significant difference between these two methods is the location of the photodetecor (Fig. 9). In the reflection method, the
 LEDs
LEDs
Photodetector
Transmission sensor
Photodetector LEDs
Perfused tissue
Bone
Reflectance sensor
Figure 9. Major components of transmission and reflection oximeters.
photodetector is on the same side of the light source. However, in the transmission oximetry, it is on the opposite site side of the light source (7,12).
Oximetry Versus Cooximetry. Each form of hemoglobin (e.g., oxyhemoglobin, deoxygenated hemoglobin, carboxyhemoglobin, methemoglobin) has its own unique absorption– transmission–reflection spectrum. By plotting the relative absorbance to different light wavelengths for both oxyhemoglobin and deoxygenated Hb as shown in Fig. 10. It is clear that these two hemoglobins absorb light differently at different light wavelengths. This difference is big in some light wavelengths (e.g., 650 nm in the red region), and small or not existing in other light wavelengths. The isosbestic point (13) is the light wavelength at which there is no difference between these two hemoglobins in absorbing light ( 805 nm near the IR region). The difference in these two wavelengths can be used to calculate the SaO2.
|
|
|
|
|
|
Red LED |
|
|
|
Isosbestic |
Infrared LED |
|||||||||
|
|
|
|
|
|
|
|
|
Wavelength |
|||||||||||
|
|
|
|
|
|
λ1 |
|
|
|
|
|
|
λ2 |
|||||||
|
|
|
|
|
|
|
|
|
λISO |
|
|
|
||||||||
(1/Mol·cm) |
|
|
|
|
|
HbO2 |
Hb |
|
|
|
|
|
|
|||||||
1000 |
|
|
|
|
|
|
|
|
|
|
|
|
|
|||||||
|
|
|
|
|
|
|
|
|
|
|
|
|
|
|
|
|
|
|
|
|
Coefficient |
800 |
|
|
|
|
|
|
|
|
|
|
|
|
|
|
|
|
|
|
|
|
|
|
|
|
|
|
|
|
|
|
|
|
|
|
|
|
|
|
||
600 |
|
|
|
|
|
|
|
|
|
|
|
|
|
|
|
|
|
|
|
|
|
|
|
|
|
|
|
|
|
|
|
|
|
|
|
|
|
|
|
|
|
|
400 |
|
|
|
|
|
|
|
|
|
|
|
|
|
|
|
|
|
|
|
|
|
|
|
|
|
|
|
|
|
|
|
|
|
|
|
|
|
|
|
|
Extinction |
200 |
|
|
|
|
|
|
|
|
|
|
|
|
|
|
|
|
|
|
|
|
|
|
|
|
|
|
|
|
|
|
|
|
|
|
|
|
|
|
||
0 |
|
|
|
|
|
|
|
|
|
|
|
|
|
|
|
|
|
|
|
|
|
600 |
650 |
700 |
800 |
900 |
1000 |
||||||||||||||
|
|
|
|
|
|
|
|
|
Wavelength λ (nm) |
|
|
|
|
|
|
|||||
Figure 10. Light absorption spectra of oxygenated and deoxygenated hemoglobin.
However, these two hemoglobins are not only the hemoglobins exist in the patient’s blood. There are other abnormal hemoglobins (dyshemoglobins) that can join these two hemoglobins in some abnormal conditions (such as carboxyhemoglobin and methemoglobin). Each one of these dyshemoglobins has its unique transmission–reflection– absorption spectrum. Some of these spectra are very close to the oxyhemoglobin spectrum at the routinely used two light wavelengths (see above). This makes these two wavelengths are incapable in detecting those dyshemoglobins. Therefore, the use of regular oximeters in these conditions may lead to erroneous and false readings, which may lead to detrimental effects on the patient’s care. To overcome this significant problem a special oximeter (cooximeter, i.e., cuvette oximeter) is needed when there is a suspicion of presence of high level of dyshemoglobins in the patient’s blood. Functional SaO2 is the percentage of oxyhemoglobin compared to sum of oxyand deoxyhemoglobins. Therefore, the abnormal hemoglobins are not directly considered in the measurement of functional SaO2 by using regular oximetry. Cooximetry uses four or more light wavelengths, and has the ability to measure carboxyhemoglobin and methemoglobin as well as normal hemoglobins. The fractional SaO2 measures the percentage of oxyhemoglobin to all hemoglobins (normal and abnormal) present in the blood sample (14,15).
EAR OXIMETRY
Historical Development
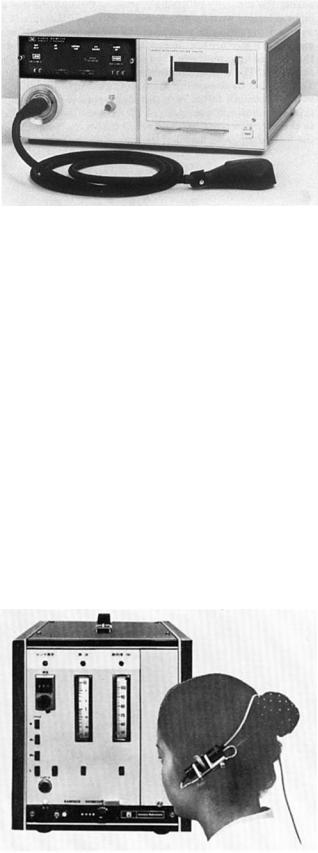
In 1935, Matthes (16,17) showed that transmission oximetry could be applied to the external ear. However, a major problem with noninvasive oximetry applied to the ear was the inability to differentiate light absorption due to arterial blood from that due to other ear tissue and blood. In the following years, two methods were tried to solve this problem. The first was increasing local perfusion by heating the ear, applying vasodilator, or rubbing the ear. The second was comparing the optical properties of a ‘‘bloodless’’ earlobe (by compressing it using a special device) to the optical properties of the perfused ear lobe. Arterial SaO2 was then determined from the difference in these different measurements. This step was a significant step toward an accurate noninvasive measurement of SaO2. In 1976, Hewlett-Packard (18) used the collected knowledge about ear oximetry to that date to develop the model 47201A ear oximeter, Fig. 11.
HEWLETT-PACKARD EAR OXIMETER
This oximeter (18) is based on the measured light transmission at eight different wavelengths, which made this sensor less accurate and more complex than pulse oximeters. It used a high intensity tungsten lamp that generated a broad spectrum of light wave lengths. This light passes through light filters, then enters a fiberoptic cable, which carrys the filtered light to the ear. A second fibroptic cable carries the light pulses transmitted through the ear to the device for detection and analysis. The ear probe is relatively bulky ( 10 10 cm) equipped with a tempera-
BLOOD GAS MEASUREMENTS |
471 |
Figure 11. The Hewlett-Packard Model 47201A ear oximeter.
ture-controlled heater (to keep temperature of 418C). It is attached to the antihelix after the ear has been rubbed briskly. This monitor is no longer manufactured because of its bulkiness and cost, and because of the development widely of a more accurate, smaller, and cost-effective monitor, the pulse oximeter.
PULSE OXIMETRY
Historical Development
In the early 1970s, Takuo Aoyagi (16,19,20), a Japanese physiological bioengineer, introduced pulse oximetry, the underlying concept of which had occurred to him while trying to cancel out the pulsatile signal of an earpiece densitometer with IR light. In early 1973, Dr. Susumu Nakajima, a Japanese surgeon, learned of the idea and ordered oximeter instruments from Nihon Kohden. After several prototypes were tested, Aoyagi and others delivered the first commercial pulse oximeter in 1974. This instrument was the OLV-5100 ear pulse oximeter, (Fig. 12). In 1977, the Minolta Camera Company
Figure 12. The OLV-5100 ear pulse oximeter, the first commercial pulse oximeter, it was introduced by Nihon Kohden in 1974.
472 BLOOD GAS MEASUREMENTS
LEDs
Red Infrared
Photodiode
Figure 13. The basic components of a pulse oximeter sensor. Two LEDs with different wavelengths as light sources and a photodiode as receiver.
introduced the Oximet MET-1471 pulse oximeter with a fingertip probe and fiberoptic cables. Nakajima and others tested the Oximet MET-1471 and reported on it in 1979. In the years since, pulse oximetry has become widely used in a number of fields, including Anesthesia, intensive care, and neonatal care.
Principles of Operation
Pulse oximetry differs from the previously described oximetry in that it does not rely on absolute measurements, but rather on the pulsations of arterial blood. Oxygen saturation is determined by monitoring pulsations at two wavelengths and then comparing the absorption spectra of oxyhemoglobin and deoxygenated hemoglobin (20,21). Pulse oximetry uses a light emitter with red and infrared LEDs (light-emitting diodes) that shine through a reasonably translucent site with good blood flow (Fig. 13). Typical adult–pediatric sites are the finger, toe, pinna (top), or lobe of the ear. Infant sites are the foot or palm of the hand and the big toe or thumb. On the opposite side of the emitter is a photodetector that receives the light that passes through the measuring site. There are two methods of sending light through the measuring site (see above) (Fig. 9). The transmission method is the most common type used, and for this discussion the transmission method will be implied. After the transmitted red (R) and IR signals pass through the measuring site and are received at the photodetector, the R/IR ratio is calculated. The R/IR is compared to a ‘‘look-up’’ table (made up of empirical formulas) that converts the ratio to pulse oxygen saturation (SpO2) value. Most manufacturers have their own tables based on calibration curves derived from healthy subjects at various SpO2 levels. Typically, an R/IR ratio of 0.5 equates to approximately 100% SpO2, a ratio of 1.0 to82% SpO2, while a ratio of 2.0 equates to 0% SpO2. The major change that occurred from the eight-wavelength Hewlett-Packard oximeters (see above) of the 1970s to the oximeters of today was the inclusion of arterial pulsation to differentiate the light absorption in the measuring site due
Absorption |
AC |
Pulsatile arterial blood |
|
Non-pulsatile arterial blood |
|
|
Venous and capillary blood |
|
DC |
|
|
Light |
|
|
|
Tissue |
|
|
|
Time |
Figure 14. Schematic Representation of light absorption in adequately perfused tissue.
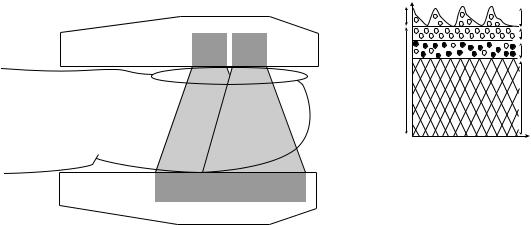
to skin, tissue, and venous blood from that of arterial blood. At the measuring site there are several light absorbers (some of them are constant) such as skin, tissue, venous blood, and the arterial blood (Fig. 14). However, with each heart beat the heart contracts and there is a surge of arterial blood, which momentarily increases arterial blood volume across the measuring site. This results in more light absorption during the surge. Light signals received at the photodetector are looked at as a waveform (peaks with each heartbeat and troughs between heartbeats). If the light absorption at the trough, which should include all the constant absorbers, is subtracted from the light absorption at the peak, then the resultants are the absorption characteristics due to added volume of blood only, which is arterial blood. Since peaks occur with each heartbeat or pulse, the term ‘‘pulse oximetry’’ was applied.
New Technologies
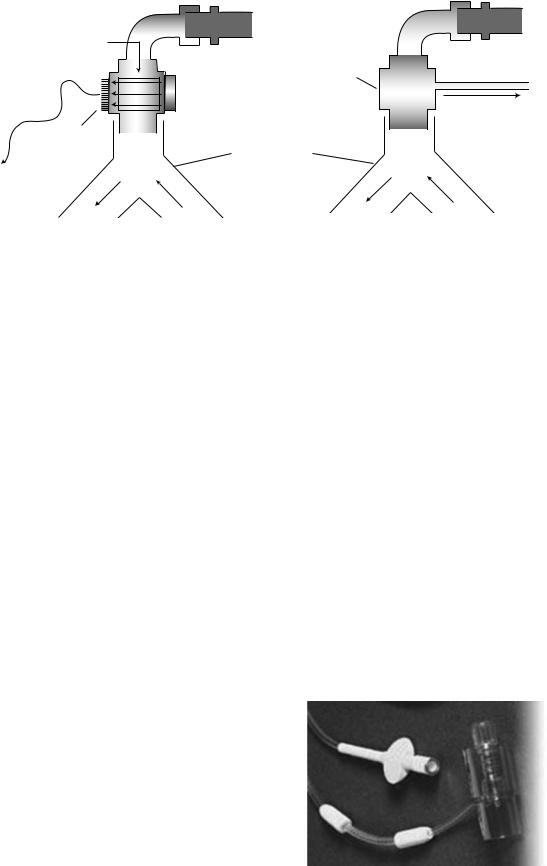
Conventional pulse oximetry accuracy degrades during motion and low perfusion. This makes it difficult to depend on these measurements when making medical decisions. Arterial blood gas tests have been and continue to be commonly used to supplement or validate pulse oximeter readings. Pulse oximetry has gone through many advances and developments since the Hewlett-Packard Model 47201A ear oximeter invention in 1976. There are several types of pulse oximeters manufactured by different companies available in the market nowadays. Different technologies have been used to improve pulse oximetry quality and decrease its limitations, which would lead eventually to better patient care. Figure 15 shows a modern pulse oximeter (Masimo Rad-9) designed by Masimo using the Signal Extraction Technology (Masimo SET) (22,23), is a software system composed of five parallel algorithms designed to eliminate nonarterial ‘‘noise’’ in a patient’s blood flow. This monitor display includes: SpO2, pulse rate, alarm, trend, perfusion index (PI) (24), signal IQ, and plethysmographic waveform. Moreover, Masimo manufactures a handheld pulse oximeter by utilizing the same technology (Masimo SET) as shown in Fig. 16. Its small size ( 15.7 7.6 3.5 cm) and broad catalog of features make it suited for hospital, transport, and home use. Nellcor (25) uses the OxiMax technology to produce a list of pulse oximetry monitors and sensors. These sensors have a small digital memory chip that transmits
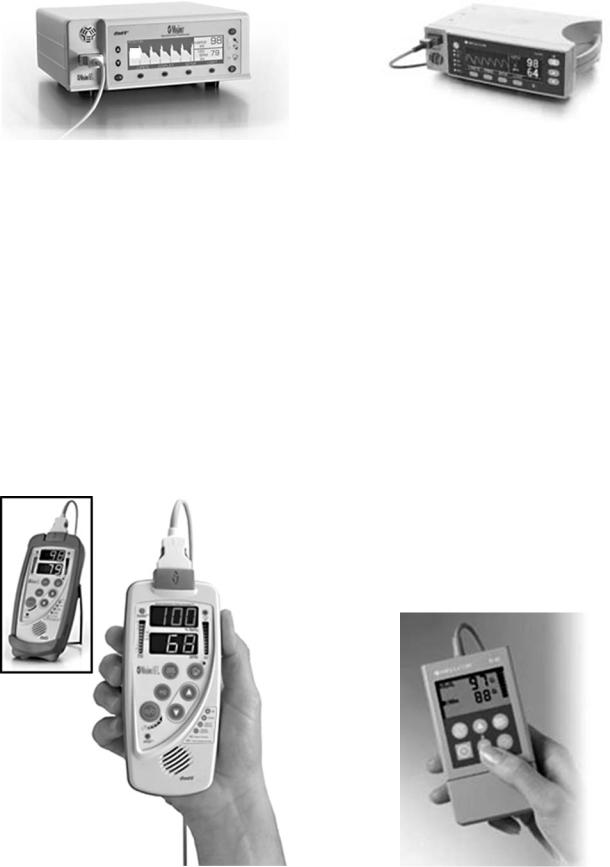
Figure 15. Masimo Rad-9 pulse oximeter.
sensor-specific data to the monitor. These chips contain all the calibration and operating characteristics for that sensor design. This gives the monitor the flexibility to operate accurately with a diverse range of sensor designs without the need for calibrating each sensor to the specific monitors. This opens a new area of pulse oximetry innovations. Figure 17 reveals some of the Nellcor monitors and sensors available. Furthermore, Nellcor has designed a handheld pulse oximeter, as shown in Fig. 18, compatible with its line of OxiMax pulse oximetry sensors. Nellcor combines two advanced technologies in measuring blood gases: the OxiMax technology and Microstream CO2 technology (see the section Capnography) to produce a SpO2 and end-tidal CO2 partial pressure (PetCO2) handheld capnograph–pulse oximeter to monitor both SpO2 and PetCO2. Several additional parameters are now available on the modern oximeter, and they add additional functionality for these monitors and decrease their limitations. One of these parameters is called the ‘‘perfusion index’’ (PI) (24,26). This is a simple
BLOOD GAS MEASUREMENTS |
473 |
Figure 17. Nellcor N-595 pulse oximeter.
measure of the change that has occurred in the tissue- under-test (e.g., the finger) over the cardiac cycle. When this parameter was first recognized as being something that a pulse oximeter could measure, it was difficult to imagine a value to the measurement because it is affected by so many different physiological and environmental variables, including systemic vascular resistance, volume status, blood pressure, and ambient temperature. But as time continues to pass since its introduction, more applications for PI have been found. The most obvious use for perfusion index is as an aid in sensor placement. It provides a means to quantify the validity of a given sensor site and, where desired, to maximize measurement accuracy. Perfusion index has also provided a simple and easy way test for sufficient collateral blood flow in the ulnar artery to allow for harvest of the radial artery for coronary artery bypass graft (CABG) surgery and for monitoring peripheral perfusion in critically ill patients.
Clinical Uses
Pulse oximeters are widely used in clinical practice (27–30). They are used extensively in the intensive care units to monitor oxygen saturation, and to detect and prevent hypoxemia. Monitoring oxygen saturation during anesthesia is a standard of care, which is almost always done by pulse oximeters. Pulse oximeters are very helpful in monitoring patients during procedures like bronchoscopy, endoscopy, cardiac catheterization, exercise testing,
Figure 16. Masimo Rad-5 handheld pulse oximeter. |
Figure 18. Nellcor N-45 handheld pulse oximeter. |
474 BLOOD GAS MEASUREMENTS
Figure 19. Portable Nonin Onyx 9500 pulse oximeter.
and sleep studies. Also, they are commonly used during labor and delivery for both the mother and infant. These sensors have no significant complications related to their use. There are several types of portable pulse oximeters on the market. These oximeters are small in size, useful for patients transport, and can be used at home. Figure 19 shows one of these pulse oximeters.
Accuracy and Limitations
The accuracy of pulse oximeters in measuring exact saturation has been shown to be 4% as compared to blood oximetry measurements. Several studies have shown that with low numbers of SaO2, there is a decreased correlation between SpO2 and SaO2, especially when SaO2 < 70% and in unsteady conditions (31). However, newer technologies have improved accuracy during these conditions substantially. Another factor that influences the accuracy of pulseoximetry is the response time. There is a delay between a change in SpO2 and the display of this change. This delay ranges from 10 to 35 s. Pulse-oximeters have several limitations that may lead to inaccurate readings. One of its most significant limitations is that it estimates the SaO2, not the arterial oxygen tension (PaO2). Another limitation is the difficulty these sensors have in detecting arterial pulsation in low perfusion states (low cardiac output, hypothermia etc.) (32). Furthermore, the presence of dyshemoglobins (e.g., methemoglobin, carboxyhemoglobin) (15) and diagnostic dyes (e.g., methylene blue, indocyanine green, and indigo carmine) (33) affects the accuracy of these monitors, leading to false readings. High carboxyhemoglobin levels will falsely elevate SpO2 readings, which may lead to a false sense of security regarding the patient’s
oxygenation, and possible disastrous outcome. CO-oxime- try should be used to measure SaO2 in every patient who is suspect for elevated carboxyhemoglobin (such as fire victims). Methemoglobinemia may lead to false 85% saturation reading. The clinician should be alert to the potential causes and possibility of methemoglobinemia (e.g., nitrites, dapsone, and benzocaine). The CO-oximetry is also indicated in these patients. Vascular dyes may also affect the SpO2 readings significantly, especially methylene blue, which is also used in the treatment of methemoglobinemia. Brown, blue, and green nail polish may affect SpO2 too. Therefore, routine removal of this polish is recommended. The issue of skin pigmentations effect on SpO2 reading is still controversial. Motion artifacts are a common problem in using pulse oximeters, especially in the intensive care units.
Future Directions for Pulse Oximeters
As mentioned above, there are several limitations with the recent commercially available pulse oximeters. Pulse oximeters technology is working on decreasing those limitations and improving pulse oximeters function (34). In the future, techniques to filter out the noise component common to both R and IR signals, such as Masimo signal extraction, will significantly decrease false alarm frequency. Pulse oximeters employing more than two wavelengths of light and more sophisticated algorithms will be able to detect dyshemoglobins. Improvements in reflection oximetry, which detects backscatter of light from lightemitting diodes placed adjacent to detectors, will allow the probes to be placed on any body site. Scanning of the retinal blood using reflection oximetry can be used as an index of cerebral oxygenation. Combinations of reflectance oximetry and laser Doppler flowmetry may be used to measure microcirculatory oxygenation and flow.
Continuous Intravascular Blood Gas Monitoring (CIBM)
The current standard for blood gas analysis is intermittent blood gas sampling, with measurements performed in vitro in the laboratory or by using bedside blood gas analyzer. Recently, miniaturized fiberoptic devices have been developed that can be placed intravascularly to continuously measure changes in PO2, PCO2, and pH. These devices utilize two different technologies: Electrochemical sensors technology, based on a modified Clark electrode, and optode (photochemical/optical) technology (35,36).
Optode (Photochemical–Optical) Technology. An optode unit consists of optical fibers with fluorescent dyes encased in a semipermeable membrane. Each analyte, such as hydrogen ion, oxygen, or carbon dioxide, crosses the membrane and equilibrates with a specific chemical fluorescent dye to form a complex. As the degree of fluorescence changes with the concentration of the analyte, the absorbance of a light signal sent through the fiberoptic bundles changes, and a different intensity light signal is returned to the microprocessor. Optode technology has accuracy comparable to that of a standard laboratory blood gas analyzer. However, several reasons and problems, including the cost (see below) still limit the use of this monitor routinely.
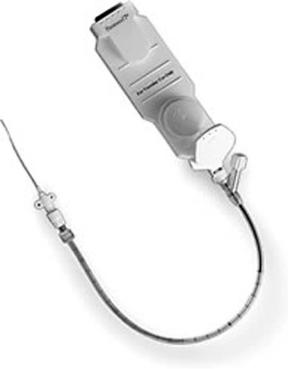
At present, the Paratrend 7þ (PT7þ; Diametric Medical Inc., High Wycombe, U.K.; distributed by Philips Medical Systems), and Neotrend (NT) are the only commercially available multiparameter CIBM systems. The original probe of Paratrend 7 (PT7) was introduced in 1992. It consists of a hybrid probe incorporating four different sensors: miniaturized Clark electrode to measure PO2, optode to determine PCO2, and pH (absorbance sensors, phenol red in bicarbonate solution), and a thermocouple (copper, constantan) to measure temperature and allow temperature correction of the blood gas values. All these sensors were encased in a heparin-coated microporous polyethylene tube that was permeable to the analytes to be measured. This sensor was modified in 1999. In the new sensor (PT7þ) (Fig. 20), the Clark electrode was replaced by an optical PO2 sensor. According to the manufacturer, this new PO2 sensor is more accurate and has a faster response time.
Clinical Uses
Continuous intravascular blood gas monitoring has been applied in various clinical settings (36,37) in the operating room and the intensive care unit. In the operating room, especially in adults undergoing one lung ventilation for major surgery (e.g., one lung ventilation for thoracoscopic surgery or lung transplantation, major cardiac or vascular surgery). The most common site for CIBM measurement is the radial artery in adults and the femoral artery in children. The umbilical artery is used for probe insertion in neonates. Reports and studies showed that performance and accuracy of CIBM devices appear to be sufficient for clinical use.
Figure 20. The Paratrend 7þ (PT7þ; Diametric Medical Inc.) sensor.
BLOOD GAS MEASUREMENTS |
475 |
Limitations and Complications
Reliable intravascular blood gas measurement depends on a number of mechanical, electrical, and physicochemical properties of the CIBM probe as well as the conditions of the vessel into which the probe is inserted (36,37). Therefore, several factors can affect the performance of CIBM, including mechanical factors related to the intraarterial probe (e.g., not advanced adequately in the artery, the sensor becomes attached to the wall of the vessel), factors related to the artery itself (e.g., vasospasm), interference from electrocautery and ambient or endoscopic light, or related to the ‘‘flush’’ solution used to flush the intraarterial catheter, which may lead to false measurements. Complications may include thrombosis, ischemia, vasospasm, and failure. Although CIBM appears to be advantageous, there are no prospective, randomized, double-blind studies of its impact on morbidity and mortality. Future outcome studies should focus on well-defined groups of selected patients who might benefit from CIBM (e.g., critically ill patients with potentially rapid and unexpected changes in blood gas values). Furthermore, no data is available on the cost/benefit ratio of CIBM, and more studies are still needed to know if this monitor is cost-effective.
Intrapartum Fetal Pulse Oximetry
Intrapartum fetal pulse oximetry is a direct continuous noninvasive method of monitoring fetal oxygenation (38). Persistent fetal hypoxemia may lead to acidosis and neurological injury, and current methods to confirm fetal compromise are indirect and nonspecific. Therefore, intrapartum fetal pulse oximetry may improve intrapartum fetal assessment and, most important, improve the specificity of detecting fetal compromise (39,40). Intrapartum fetal pulse oximetry may monitor, not only the fetal heart rate (FHR), but also the arterial oxygen saturation and peripheral perfusion may be assessed.
Principle of Operation and Placement
The fetus in utero does not have an exposed area that would allow placement of a transmission sensor (38). Thus, reflectance sensors have been designed where the light-emitting diodes are located adjacent to the photodetector (Fig. 9). During labor, the sensor is placed transvaginally between the uterine wall and the fetus, with contact on the fetal presenting part, usually the soft tissue of the fetal cheek. Monitoring of fetal oxygen saturation has been encumbered by multiple technical obstacles (38). For example, reflectance sensors not directly attached to the fetus, work only when in contact with fetal skin and may not produce an adequate SpO2 signal when contact is suboptimal during intense uterine contractions or during episodes of fetal movement. In this situation, sensor position may require adjustment. Improved reflectance sensor contact has been attempted via a variety of sensor modifications, including suction devices, application with glue, and direct attachment to the fetal skin with a special clip. The Nellcor (Fig. 21) sensors have been developed with a ‘‘fulcrum’’ modification, which mechanically places the sensor surface into better contact with the fetal skin. Other technical

476 BLOOD GAS MEASUREMENTS
Figure 21. Nellcor OxiFirst fetal pulse oximeter.
advances, such as modification of the red light-emitting diode from a 660 to a 735 nm wavelength, have resulted in improved registration times.
Future Direction of Intrapartum Fetal Pulse Oximetry.
Ideally, calibration of these monitors in human fetuses should be done by simultaneous measurement of SpO2 and preductal SaO2. Because the access to fetal circulation during labor is not feasible, calibration of these monitors is still a major problem (38). It appears that well-designed animal laboratory studies and human infant and neonatal studies will have to suffice for calibration and validation of these monitors. To make this monitor more valuable and accurate as a guide for obstetric and neonatal management during labor, prospective studies with a larger number of abnormal fetuses will be necessary to determine duration and level of hypoxia leading to metabolic acidosis in humans. Also, more studies are needed to answer questions about its safety and efficacy. Finally, further refinements in equipment design should improve the accuracy of SpO2 determination and the ability to obtain an adequate signal. Decreased signal-to-noise ratios, motion artifacts (e.g., contractions, fetal movement, maternal movement), impediments to light transmission (e.g., vernix, fetal hair, meconium), and calibration difficulties are unique obstacles in accurately assessing the fetus by this monitor. Technical development goals of fetal pulse oximetry should include improvement of sensor optical design, hardware, and software modification to obtain high signal quality and precise calibration. Major advantages of fetal oxygen saturation monitoring include its ease of interpretation for clinicians of varying skills, being noninvasive method, and the ability to monitor fetal oxygenation continuously during labor. However, more studies are needed to evaluate its safety, efficacy, and cost issues (41). When these issues are resolved, intrapartum fetal oxygen saturation monitoring could perhaps be one of the major advances in obstetrics during the twenty-first century.
TRANSCUTANEOUS BLOOD GAS MONITORING (TCM)
Historical Development
The possibility of continuously monitoring arterial blood oxygen and carbon dioxide using a heated surface electrode on human skin was discovered in the early 1970s and made commercially available by 1976 (42). In 1951, Baumberger and Goodfriend published an article showing a method to determine the arterial oxygen tension in man by equilibration through intact skin. By immersing a finger in a phosphate buffer solution heated to 45 8C, they found that
the PO2 of the buffer approached that of the alveolar air. They showed that if skin blood flow increased by the highest tolerable heat (458C), the surface PO2 rises to arterial blood PO2. A few years later (in 1956), Clark invented the membrane covered platinum polarographic electrode to measure O2 tissue tensions. By 1977, at least three commercial transcutaneous PO2 (tcPO2) electrodes were available (Hellige, Roche, RADIOMETER). These devices were applied initially to premature infants in an effort to reduce the incidence of blindness due to excessive oxygen administration. Throughout more than three decades, the TCM technology has been closely linked to the care of neonates; however, recent studies suggest that TCM technology may work just as well for older children and adults (29). The TCM offers continuous noninvasive measurement of blood gases, which is especially advantageous in critically ill patients in whom rapid and frequently life-threatening cardiopulmonary changes can occur during short periods of time. However, with the widespread use of pulse oximetry, the use of transcutanenous blood gas monitors has decreased.
Blood Gas Diffusion Through the Skin
The human skin consists of three main layers: the stratum corneum, epidermis, and dermis (Fig. 22). The thickness of the human skin varies with age, sex, and region of the body. The thickness of the stratum corneum varies from 0.1 to 0.2 mm depending on the part of the body. This is nonliving layer composed mainly of dehydrated cells (dead layer), which do not consume oxygen or produce carbon dioxide. The next layer is the epidermis layer, which consists of proteins, lipids, and melanin-forming cells. The epidermis is living, but is blood-free. The thickness of this layer 0.05–1 mm. Underneath the epidermis is the dermis, which consists of dense connective tissue, hair follicles, sweat glands, fat cells, and capillaries. These capillaries receive blood from arterioles and drain in venules. Arteriovenous anastomoses innervated by nerve fibers are commonly found in the dermis of the palms, face, and ears. These shunting blood vessels regulate blood flow
Cutaneous sensor
Stratum corneum
Epidermis
Dermis
Hypodermis
Figure 22. Human skin.

through the skin. Heat increases blood flow through these channels almost 30-fold. Gas diffusion through the skin occurs due to a partial pressure difference between the blood and the outermost surface of the skin. Diffusion of blood gases through the skin normally is very low, however, the heated skin ( 43 8C) becomes considerably more permeable to these gases.
Principle of Transcutaneous PO2 Measurement (tcPO2)
The probe used to measure the tcPO2 is based on the idea of oxygen polarography (see above). This probe (7,12) consists of a platinum cathode and a silver reference anode encased in an electrolyte solution and separated from the skin by a membrane permeable to oxygen (usually made of Teflon, polypropylene, or polyethylene). The electrode is heated, thereby melting the crystalline structure of the stratum corneum, which otherwise makes this skin layer an effective barrier to oxygen diffusion. The heating of the skin also increases the blood flow in the capillaries underneath the electrodes. Oxygen diffuses from the capillary bed through the epidermis and the membrane into the probe, where it is reduced at the cathode, thereby generating an electric current that is converted into partial pressure measurements and displayed by the monitor. Because of an in vitro drift inevitably occurring inside the probe, where several chemical reactions are going on, the tcPO2 sensor must be calibrated before using, and be repeated every 4–8 h. Since the O2-dependent current flow exhibits a linear relationship at a fixed voltage, only two known gas mixtures are required for the calibration. Two in vitro calibration techniques can be employed: by using two precision gas mixtures (e.g., nitrogen and oxygen), and by using a ‘‘zero O2 solution’’ (e.g., sodium sulfite) and room air.
The Transcutaneous PO2 Sensor. The modern transcutaneous PO2 sensors still use the principles used by Clark decades ago (7,12). Figure 23 illustrates a cross-sectional diagram of a typical Clark-type sensor. This particular sensor consists of three glass-sealed platinum cathodes that are separately connected via current amplifiers to a surrounding Ag–AgCl cylindrical ring. A buffered KCl electrode, which has a low water content to reduce drying of the sensor, is used. The following basic reactions happen between the two electrodes:
At the anode (þ electrode):
4 Ag þ 4 Cl $ 4 AgCl þ 4 e
(the electrons complete the circuit) At the cathode ( electrode):
4 Hþ þ 4 e þ O2 $ 2 H2O
(the electrons are boiled off of the platinum electrode) Overall:
4 Ag þ 4 Cl þ 4 Hþ þ O2 $ 4 AgCl þ 2 H2O
The two electrodes are covered with a thin layer of electrolytic solution that is maintained in place by a membrane that allows slow diffusion of O2 from the skin into the sensor. The diffusion of O2 through the skin is normally very low. Under normal physiological conditions, the PO2
BLOOD GAS MEASUREMENTS |
477 |
Platinum wire
Glass rod
Ag/AgCl anode 
Filling solution 

 O-ring
Sample inlet |
Sample outlet |
Platinum cathode (exposed and of wire)
O2 permeable membrane
Figure 23. A cross-sectional diagram of a typical Clark-type sensor.
measured at the surface of the skin using a nonheated transcutaneous PO2 electrode is near zero, regardless of the underlying blood PO2. In order to facilitate O2 diffusion through the skin, abrasion of the skin and drug-induced hyperemia through the application of nicotinic acid cream were initially used. However, since direct skin heating gives a more prolonged and consistent effect, a heating element is now used in all commercial transcutaneous PO2 sensors. Generally, temperatures between 43 and 448 yield adequate vasodilatation of the cutaneous blood vessels with minimal skin damage. Heating the skin speeds up O2 diffusion through the stratum corneum. In addition, it also causes vasodilatation of the dermal capillaries, which increases blood flow to the region of skin in contact with the sensor. With increased blood flow, more O2 is available to the tissues surrounding the capillaries in the skin, and consequently the PO2 of the blood in these capillary loops approximate more closely that of the arterial blood. Heating the blood also shifts the oxygen dissociation curve to the right. Therefore, the binding of hemoglobin with O2 is reduced and the release of O2 to the cells is increased. Simultaneously, skin heating also increases local tissue O2 consumption. Fortunately, however, these two factors tend to cancel each other.
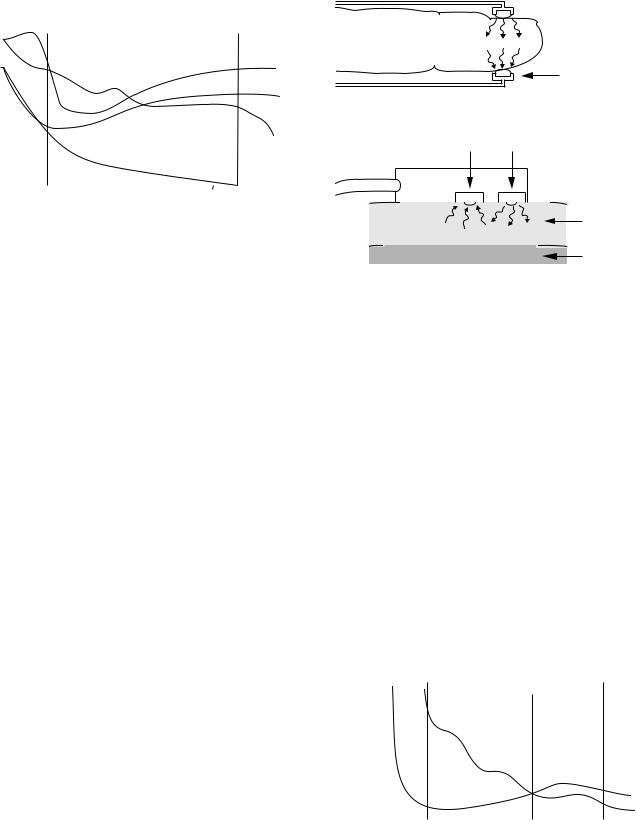
Transcutaneous PCO2 Monitoring
Continuous PCO2 monitoring is helpful in monitoring lung ventilation during spontaneous breathing or artificial ventilation. It makes it easier to adjust the parameters of the ventilator and prevent respiratory acidosis or alkalosis.
The Transcutaneous PCO2 Sensor
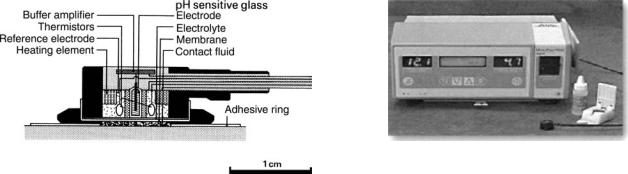
The typical sensor is similar the O2 sensor that was described above, as shown in Fig. 24. This sensor (7,12) consists of glass pH electrode with a concentric Ag–AgCl reference electrode that also serves as a temperature-
478 BLOOD GAS MEASUREMENTS
Figure 24. The transcutaneous PCO2 sensor.
controlled heater. A buffer electrolyte (e.g., HCO3 ) is placed on the surface of the electrode and a thin CO2 permeable membrane (e.g., Teflon) stretched over the electrode separates the sensor from its surroundings. As CO2 molecules diffuse via the CO2-permeable membrane into the HCO3 containing solution, the following chemical reaction occurs:
CO2 þ H2O $ H2CO3 $ Hþ þ HCO3
A potential between the pH and the reference electrodes is generated as a result of this reaction. This potential is proportional to the CO2 concentration. Measurement of pH with a pH electrode can lead to estimation of the skin PCO2, which correlates with the PaCO2. According to the Henderson–Haselbach relationship, pH is proportional to the negative logarithm of PCO2.
Skin temperature must be considered when analyzing PCO2 measurements, because the skin heating can affect the transcutaneous PCO2 sensor reading. This effect is due to the high temperature coefficient of the PCO2 sensor. Heating the sensor results in an increase in PCO2, since CO2 solubility decreases, increase in local tissue metabolism, and increase in the rate of CO2 diffusion through the stratum corneum. Therefore, the transcutaneous PCO2 values are usually higher than the corresponding arterial PCO2. Calibration of the PCO2 sensor is different from the PO2 sensor calibration. In the CO2 sensor case, the voltage signal generated in the PCO2 sensor is proportional to the logarithm of the CO2 concentration (not to CO2 concentration directly, as the case in PO2). Therefore, there is no ‘‘zero point’’ calibration in transcutaneous PCO2 sensor as there is with a transcutaneous PO2 sensor. For this reason, one needs two different precisely analyzed gas mixtures for calibration. Usually, gas mixtures containing 5 and 10% CO2 are used for calibrating the PCO2 sensor. On the other side, PCO2 sensor calibration must be done at the temperature at which it will be operated.
Clinical Applications of Transcutaneous PO2 and PCO2
Monitoring
Transcutaneous PO2 and PCO2 monitoring have found numerous applications in clinical medicine and research (42,43) during the past two decades: (1) neonatology: tcPO2 monitoring remains the most commonly used technique to guide oxygen therapy in premature infants. In low birth weight infants, tcPO2 is one of the best available
Figure 25. Radiometer TCM 4 transcutaneous blood gas monitor.
monitor of ventilation. (2) Fetal monitoring: specially designed electrodes attached to the fetal scalp have been used. Changes in tcPO2 rapidly reflected changing maternal and fetal conditions. Some studies showed that fetal tcPO2 is considerably affected by local scalp blood flow, therefore repeated episodes of asphyxia, which may lead to increase in catecholamines, can reduce fetal scalp blood flow and lead to misleading reduction in tcPO2. (3) Sleep studies: pulse oximetry and combined tcPO2–tcPCO2 electrode are used in sleep studies. This combination made it possible to study the ventilator response of hypoxia in sleeping infants. (4) Peripheral circulation: tcPO2 electrodes are extensively used in evaluation peripheral vascular disease (44). Furthermore, transcutaneous oximetry has been used in several clinical situations such as prediction of healing potential for skin ulcers or amputation sites, assessment of microvascular disease (45), and determination of cutaneous vasomotor status. Figure 25 shows one of the commercially available transcutaneous blood gas monitor.
CAPNOMETRY AND CAPNOGRAPHY
Introduction
Capnometry is the measurement of carbon dioxide (CO2) in the exhaled gas. Capnography is the method of displaying CO2 measurements as waveforms (capnograms) during the respiratory cycle. The end-tidal PCO2(PetCO2) is the maximum partial pressure of the exhaled CO2 during tidal breathing (just before the beginning of inspiration). The measurement of CO2 in respiratory gases was first accomplished in 1865, using the principle of Infrared(IR) absorption. Capnography was developed in 1943 and introduced to clinical practice in the 1950s (27). Since then, capnometry–capnography has gone through significant advances. Now capnography is a ‘‘standard of care’’ for general anesthesia (3), as described by the American Society of Anesthesiologists (ASA).
Measurement Techniques
Capnometry most commonly utilizes IR light absorption or mass spectrometry. Other technologies include Raman spectra analysis and a photoacoustic spectra technology (46,47)
Infrared Light Absorption Technique. This is the most common technique used to measure CO2 in capnometers.
BLOOD GAS MEASUREMENTS |
479 |
Chopper |
Recorder/display |
Infrared |
light soures |
Airway sample chamber |
Photodetector |
This method is cheaper and simpler than mass spectrometry. However, it is less accurate and has a slower response time ( 0.25 vs. 0.1 s for mass spectrometry). There are two types of IR analyzers, a double and a single beam. The double-beam positive-filter model consists of an IR radiation source, which radiates to two mirrors. The two beams pass via a filter to two different chambers (sample chamber and reference chamber), and then to a photodetector. Consequently, it is possible to process the detector output electronically to indicate the concentration of CO2 present. The single-beam negative-filter (Fig. 26), utilizes only one beam without using a reference. The principle behind this technique is that gases generally absorb electromagnetic IR radiation, and gas molecules with two or more atoms, provided these atoms are dissimilar (e.g., CO2, but not O2) absorb IR radiation in the range 1000–15000 nm. By filtering particular wavelengths, carbon dioxide and other gases can be measured. Carbon dioxide absorbs IR radiation strongly between 4200 and 4400 nm. Nitrous oxide and water have absorption peaks close to this area. Thus, there is a potential for the introduction of error with these substances in this method.
Raman Spectrography. Raman spectrography uses the principle of ‘‘Raman Scattering’’ for CO2 measurement. The gas sample is aspirated into an analyzing chamber, where the sample is illuminated by a high intensity monochromatic argon laser beam. The light is absorbed by molecules, which are then excited to unstable vibrational or rotational energy states (Raman scattering). The Raman scattering signals (Raman light) are of low intensity and are measured at right angles to the laser beam. The spectrum of Raman scattering lines can be used to identify all types of molecules in the gas phase. Raman scattering technology has been incorporated into many newer anesthetic monitors (RASCAL monitors) to identify and quantify instantly CO2 and inhalational agents used in anesthesia practice (48).
Mass Spectrography. The mass spectrograph separates molecules on the basis of mass to charge ratios. A gas sample is aspirated into a high vacuum chamber, where an electron beam ionizes and fragments the components of the sample. The ions are accelerated by an electric field into a final chamber, which has a magnetic field, perpendicular to the path of the ionized gas stream. In the magnetic field, the particles follow a path wherein the radius of curvature
Figure 26. Single-beam infrared CO2 analyzer, used in some mainstream sampling systems.
is proportional to the charge: mass ratio. A detector plate allows for determination of the components of the gas and for the concentration of each component. Mass spectrometers are quite expensive and too bulky to use at the bedside and are rarely used presently. They are either ‘‘stand alone’’, to monitor a single patient continuously, or ‘‘shared’’, to monitor gas samples sequentially from several patients in different locations (multiplexed). Up to 31 patients may be connected to a multiplexed system, and the gas is simultaneously sampled from all locations by a large vacuum pump. A rotary valve (multiplexer) is used to direct the gas samples sequentially to the mass spectrometer. In a typical 16-station system, with an average breathing rate of 10 breaths min 1, each patient will be monitored about every 3.2 min. The user can interrupt the normal sequence of the multiplexer and call the mass spectrometer to his patient for a brief period of time (46–48).
Photoacoustic Spectrography. Photoacoustic gas measurement is based on the same principles as conventional IR-based gas analyzers: the ability of CO2, N2O and anesthetic agents to absorb IR light (46,49). However, they differ in measurement techniques. While IR spectrography uses optical methods, photoacoustic spectrography (PAS) uses an acoustic technique. When an IR energy is applied to a gas, the gas will expand and lead to an increase in pressure. If the applied energy is delivered in pulses, the gas expansion would be also pulsatile, resulting in pressure fluctuations. If the pulsation frequency lies within the audible range, an acoustic signal is produced and is detected by a microphone. Potential advantages of PAS over IR spectrometry are higher accuracy, better reliability, less need of preventive maintenance, and less frequent need for calibration. Furthermore, as PAS directly measures the amount of IR light absorbed, no reference cell is needed and zero drift is nonexistent in PAS. The zero is reached when there is no gas present in the chamber. If no gas is present there can be no acoustic signal (49).
CO2 Sampling Techniques
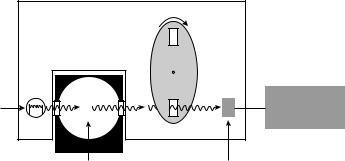
Sidestream versus Mainstream. Capnometers that are used in clinical practice use two different sampling techniques (50) (Fig. 27): sidestream or mainstream. A mainstream (flow-through) capnometer has an airway adaptor cuvette attached in-line and close to the endotracheal tube. The cuvette incorporates an IR light source and sensor that
480 BLOOD GAS MEASUREMENTS
Tracheal tube |
|
Tracheal tube |
Sample |
|
|
chamber |
|
|
|
Sample |
To remote analyzer |
Infrared light |
adapter |
|
source |
|
|
To microprocessor |
|
|
Photodetector |
|
|
Ventilator circuit |
|
|
wye connectors |
|
|
(a) |
(b) |
Figure 27. Sidestream vs. mainstream CO2 sampling techniques. (a) Mainstream CO2 sampling.
(b) Sidestream sampling.
senses carbon dioxide absorption to measure PetCO2. A sidestream capnometer uses a sampling line that attaches to a T-piece adapter at the airway opening, through which the instrument continually aspirates tidal airway gas for analysis of carbon dioxide. The main advantage of the mainstream analyzer is its rapid response, because the measurement chamber is part of the breathing circuit. The sample cuvette lumen, through which inspired and expired gases pass, is large in order to minimize the work of breathing, and pulmonary secretions generally do not interfere with carbon dioxide analysis. Compared with sidestream (aspiration) sampling, the airway cuvette is relatively bulky and can add dead space. However, within the past few years lighter and smaller airway cuvettes have been developed to allow its use in neonates. The sidestream PCO2 analyzer adds only a light T-adapter to the breathing circuit, and can be easily adapted to nonintubation forms of airway control. Because the sampling tubing is small bore, it can be blocked by secretions. During sidestream capnography, the dynamic response, the steepness of the expiratory upstroke and aspiratory downslope, tends to be blunted because of the dispersive mixing of gases through the sampling line, where gas of high PCO2 mixes with gas of low PCO2. In addition, a washout time is required for the incoming sampled gas to flush out the volume of the measuring chamber. The overall effect is an averaging of the capnogram, resulting in a lowering of the alveolar plateau and an elevation of the inspiratory baseline. Thus, PetCO2 may be underestimated and rebreathing can be simulated. These problems are exacerbated by high ventilatory rates and by the use of long sampling catheters. In addition, the capnogram is delayed in time by transport delay, the time required to aspirate gas from the airway opening adapter through the sampling tubing to the sampling chamber.
Micro-Stream Technology. Micro-stream technology (51) is a new CO2 sampling techneque that uses a low aspiration rate (as low as 50 mL min 1), such as NBP-75, Nellcor Puritan Bennett, as shown in Fig. 28. In addition, this
technology uses a highly CO2-specific IR source, where the IR emission exactly matches the absorption spectrum of the CO2 molecules. The advantages of this technology, compared to the traditional high flow side-stream capnometer (150 mL min 1), is that it gives more accurate PetCO2 measurements and better waveforms in neonates and infants with small tidal volumes and high respiratory rates. Furthermore, these low flow capnometers are less likely to aspirate water and secretions into the sampling tubes, resulting in either erroneous PetCO2 values or in total occlusion of sampling tube.
Phases of Capnography
A normal single breath capnogram (time capnogram) is shown in Fig. 29. Time capnogram is the partial pressure of expired CO2 plotted against time on the horizontal axis. This capnogram can be divided into inspiratory (phase 0) and expiratory segments. The expiratory segment, similar to a single breath nitrogen curve or single breath CO2 curve, is divided into phases I, II, and III, and occasionally, phase IV, which represents the terminal rise in CO2 concentration. The angle between phase II and III is the alpha angle. The nearly 908 angle between phase III and the descending limb is the beta angle. Changes in time
Figure 28. Nellcor Microstream ETCO2 breath sampling unit.
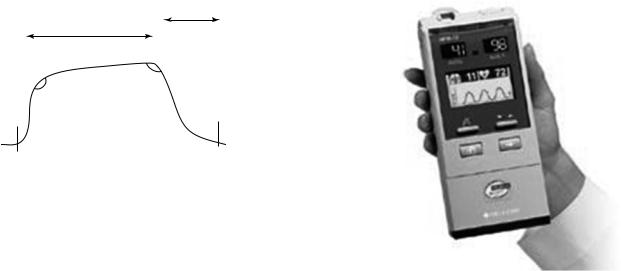
Inspiration
|
|
|
Expiration |
|
|
|
III |
|
|
α |
β |
|
II |
0 |
|
|
|
||
|
|
|
|
I |
|
|
I |
Normal patient
Figure 29. Normal single breath capnogram.
capnogram help to diagnose some of the breathing and ventilation problems, especially during anesthetic management of patients undergoing surgery (e.g., bronchospasm, esophageal intubation, CO2 rebreathing, and even cardiac arrest).
Clinical Uses of Capnography
Capnography and capnometry (52) are safe, noninvasive test, and have few hazards. They are widely used in clinical medicine. Their uses include, but are not limited to (1) evaluating the exhaled CO2, especially end-tidal CO2 in mechanically ventilated patients during anesthesia. (2) Monitoring the severity of pulmonary disease and evaluating response to therapy, especially therapy intended to improve the ratio of dead space to tidal volume (VD/VT) and the matching of ventilation to perfusion (V/Q). (3) Determining that tracheal rather than esophageal intubation has taken place (low or absent cardiac output may negate its use for this indication) (53). Colorimetric CO2 detectors are adequate devices for this purpose. (4) Evaluating the efficiency of mechanical ventilatory support by determination of the difference between the arterial partial pressure for CO2 (PCO2) and the PetCO2. Figure 30 shows a combined handheld capnograph/pulse oximeter.
Limitations
Note that although the capnograph provides valuable information (52) about the efficiency of ventilation, it is not a replacement or substitute for assessing the PCO2. The difference between PCO2 and PetCO2 increases as dead-space volume increases. In fact, the difference between the PCO2 and PetCO2 has been shown to vary within the same patient over time. Alterations in breathing pattern and tidal volume may introduce error into measurements designed to be made during stable, steady-state conditions. Interpretation of results must take into account the stability of physiologic parameters, such as minute ventilation, tidal volume, cardiac output, ventilation/perfusion ratios, and CO2 body stores. Certain situations may affect the reliability of the capnogram. The extent to which the reliability is affected varies somewhat among types of devices (IR, photoacoustic, mass spectrometry, and Raman spectrometry). Furthermore, the composition of the respiratory gas mixture may affect the capnogram (depending on
BLOOD GAS MEASUREMENTS |
481 |
Figure 30. Nellcor OxiMax NBP-75 handheld capnograph/ pulse oximeter.
the measurement technology incorporated). The IR spectrum of CO2 has some similarities to the spectra for both oxygen and nitrous oxide. High concentrations of either or both oxygen or nitrous oxide may affect the capnogram, and, therefore, a correction factor should be incorporated into the calibration of any capnograph used in such a setting. The reporting algorithm of some devices (primarily mass spectrometers) assumes that the only gases present in the sample are those that the device is capable of measuring. When a gas that the mass spectrometer cannot detect (such as helium) is present, the reported values of CO2 are incorrectly elevated in proportion to the concentration of helium in the gas mixture. Moreover, the breathing frequency may affect the capnograph. High breathing frequencies may exceed the response capabilities of the capnograph. In addition, the breathing frequency, > 10 breaths min 1, has been shown to affect devices differently. Contamination of the monitor or sampling system by secretions or condensate, a sample tube of excessive length, a sampling rate that is too high, or obstruction of the sampling chamber, can lead to unreliable results. Use of filters between the patient airway and the sampling line of the capnograph may lead to lowered PetCO2 readings. Inaccurate measurement of expired CO2 may be caused by leaks of gas from the patient–ventilator system preventing collection of expired gases, including, leaks in the ventilator circuit, leaks around tracheal tube cuffs, or uncuffed tracheal tubes.
Sublingual Capnometry
Sublingual capnometry is a method to measure the partial pressure of carbon dioxide under the tongue (PSLCO2). This method is being used mainly in the critical care units to evaluate patients with poor tissue perfusion and multiple organ dysfunction syndrome.
Pathophysiologic Basis. Significant increases in the partial pressure of carbon dioxide (PCO2) in tissue have
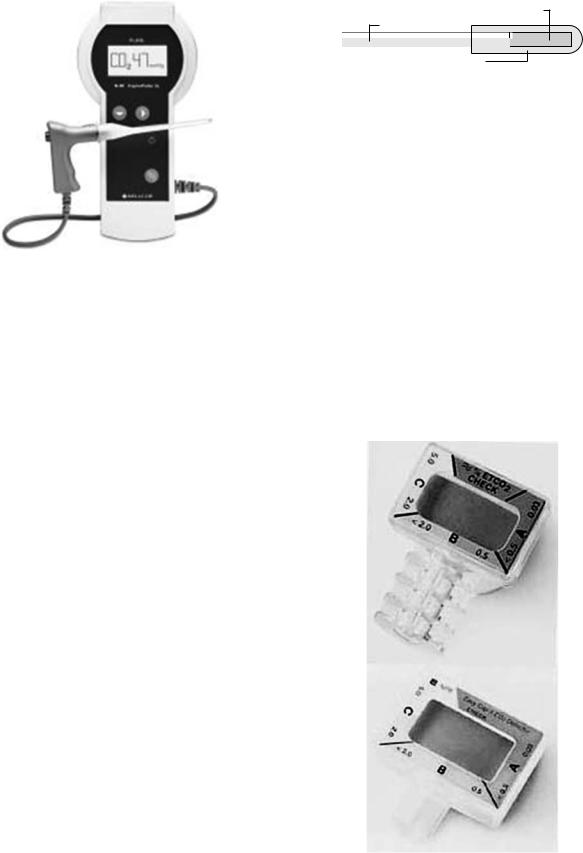
482 BLOOD GAS MEASUREMENTS
Figure 31. Nellcor CapnoProbe Sublingual capnometer.
been associated with hypoperfusion, tissue hypoxia, and multiple organ dysfunction syndrome (54). When perfusion of the intestinal mucosa is compromised, CO2 accumulates in the gut. The high diffusability of CO2 allows for rapid equilibration of PCO2 throughout the entire gastrointestinal (GI) tract. The vasculature of the tongue and the GI tract are controlled by similar neuronal pathways. Thus, the vasculatures of both respond similarly during vasoconstriction (55). Because the tongue is the most proximal part of the GI tract, measurement of PCO2 can be conveniently and noninvasively obtained by placing a sensor under the tongue. Clinical studies have demonstrated that PSLCO2 can be used in the assessment of systemic tissue hypoperfusion and hypercapnia (56).
Capnometer Components and Principle of Operation.
Figure 31 shows a commercially available sublingual capnometer (Nellcor CapnoProbe Sublingual System). This system (25) consists of two components: (1) SLS-l Sublingual Sensor: This sensor contains an optrode (a sensitive analyte detector) consists of an optical fiber capped with a small silicone membrane containing a pH-sensitive solution (Fig. 32). When the optrode is brought into contact with sublingual tissue, CO2 present in the tissue freely diffuses across the silicone membrane into the fluorescent dye solution. No other commonly encountered gases or liquids can pass across the membrane. The CO2 dissolves and forms carbonic acid, which in turn lowers the pH of the solution. The fluorescence intensity of the dye in the solution is directly proportional to pH.
This single use sensor is packaged in a sealed metal canister. Inside the canister, the sensor tip is enclosed in a gas permeable reservoir that contains a buffer solution. The solution prevents the optrode from drying out. The solution also allows calibration just prior to use, as it is in equilibrium with a known concentration of CO2 within the canister. To begin use, the clinician opens the canister and inserts the cable handle into the SLS-l Sublingual Sensor. This action initiates a calibration cycle that allows the
Fluorescent dye
Optical fiber
Silicone membrane
Figure 32. Diagram of Nellcor CapnoProbe sublingual capnometer basic components.
instrument to observe the sensor signal at the known PCO2 of the calibrant (2). The N-80 instrument contains a precision optical component that emits light at two wavelengths in the violet and blue portions of the visible spectrum. The fluorescence intensity generated by the violet wavelength is insensitive to pH, whereas that generated by the blue wavelength is strongly sensitive to pH. The light is launched into an optical fiber and delivered to the tip of the disposable sensor. The green fluorescent light generated in the optrode is directed back to the N-80 instrument through an optical fiber. The light is then ratio metrically quantitated and directly correlated to PSLCO2. When the fluorescence intensity of the optrode has stabilized (within 60–90 s), the N-80 instrument reports the measured value of PSLCO2 on its LCD screen.
Chemical Colorimetric Airway Detector
This is a device (57,58) that uses a pH-sensitive indicator to detect breath-by-breath exhaled carbon dioxide (Fig. 33).
Figure 33. Nellcor Easy Cap II Pedi-Cap chemical colorimetric CO2 detector.
The colorimetric airway detector is interposed between the endotracheal tube (ETT) and the ventilation device. Both adult and pediatric adaptors exist, but they cannot be used in infants who weigh < 1 kg. Because of excessive flow resistance, they are not suited for patients who are able to breathe spontaneously. Excessive humidity will render them inoperative in 15–20 min. The devices can be damaged by mucous, edematous, or gastric contents, and by administration of intratracheal epinephrine. Despite these drawbacks, colorimetric sensors have been found to be useful in guiding prehospital CPR (cardiopulmonary resuscitation) both in intubated patients and those with a laryngeal mask airway.
Role of Capnometry–Capnography in CPR. The relationship between cardiac output and PetCO2 is logarithmic (59). Decreased presentation of CO2 to the lungs is the major rate-limiting determinant of the PetCO2 during low pulmonary blood flow. Capnography can detect the presence of pulmonary blood flow even in the absence of major pulses (pseudoelectromechanical dissociation, EMD) and also can rapidly indicate changes in pulmonary blood flow (cardiac output) caused be alterations in cardiac rhythm. Data suggests that PetCO2 correlates with coronary perfusion pressure, cerebral perfusion pressure, and blood flow during CPR. This correlation between perfusion pressure and PetCO2 is likely to be secondary to the relationship of PetCO2 and cardiac output (60).
SUMMARY
Blood gas measurement methods and instruments have gone through significant improvements and advances in the last few decades. Invasive techniques have moved steadily toward using smaller instruments and closer to the patient’s bed (bedside), which requires smaller blood sample. These improvements have made these devices more convenient, need less personnel to operate them, and more cost-effective. These bedside devices have comparable accuracy and reliability to the traditional central laboratory instruments. Continuous intravascular blood gas monitoring is a new invasive technique that uses miniaturized fiberoptic devices. This method has been used in different clinical settings with good results. However, several limitations and complications still exist. More studies and improvements are needed to know its cost-effectiveness in clinical medicine and to minimize its complications (such as ischemia and thrombosis). Other invasive instruments and methods were discussed in other parts of this encyclopedia. On the other hand, noninvasive blood gas measurement methods and devices improved greatly since its instruction to clinical medicine. These devices have been used extensively during anesthesia administration and in critical care units. Using pulse oximetry is ‘‘standard of care’’ in anesthesia practice. The use of pulse oximeter decreased the risk of hypoxia and its deleterious effect significantly. However, several limitations to its use still exist, especially in low perfusion states, during the presence of dyshemoglobins and motion artifacts. New technologies, such as the Oxi-Max and the Signal Extraction technologies, have been developed to overcome some of these limitations,
BLOOD GAS MEASUREMENTS |
483 |
and to add more features for these instruments (such as scanning the retina as an index of cerebral oxygenation and using Laser Doppler flowmetry–reflection oximetry to measure microcirculatory oxygenation and flow). Other types of pulse oximetry have been introduced to clinical medicine. Intrapartum fetal pulse oximetry is an example of these new pulse oximeters. This device provides a continuous, noninvasive method of monitoring fetal oxygenation, which may help in detecting persistent fetal hypoxemia and improve intrapartum fetal assessment. However, more studies are needed to evaluate its safety, efficacy, and cost issues. Transcutaneous blood gas monitoring is another noninvasive method to measure blood gases. This method is losing ground and popularity against the newer pulse oximeters, which have replaced this method in several situations. Capnometry–capnography has been used extensively in anesthesia practice in the last two decades. New CO2 sampling technique such as microstream technology has been introduced. This method uses a low aspiration rate, making it more accurate than the previous techniques. Moreover, this technique can detect very small amount of CO2. Photoacoustic sepectrography is a new technique has been developed to measure PetCO2. This method is more reliable, accurate, and needs less calibration than the traditional methods. Studies showed an encouraging result and an important role for capnometry–capnography in cardiopulmonary resuscitation, which may lead to widespread use of these devices in CPR, in prehospital and inhospital settings.
BIBLIOGRAPHY
Cited References
1.Cadden K, Norman E, Booth J. Use of ABG in trauma for early recognition of acidosis and hypoxemia (Abstract). Respir Care 2001;46:1106.
2.Levin KP, Hanusa BH, Rotondi A, Singer DE, et al. Arterial blood gas and pulse oximetry in initial management of patients with community-acquired pneumonia. J Gen Intern Med 2001;9:590.
3.Morgan Jr GE, Mikhail MS, Murray MJ. Clinical Anesthesiology. 3rd ed. New York: Lange Medical Books/McGrawHill; 2002. p 124–125.
4.Severinghaus JW, Astrup P, Murray JF. Blood gas analysis and critical care medicine. Am J Resp Crit Care Med 1998;157:S114–S122.
5.Schell RM, Cole DJ. Cerebral monitoring: Jugular venous oximetry. Anesth Analg 2000;90:559.
6.Goodwin ALP. Physics of Gases, Anaesthesia and Intensive Care Medicine. (UK): The Medicine Publishing Company, Ltd.; 2003.
7.Malley WJ. Clinical Blood Gases: Assessment and Intervention. 2nd ed. New York: Elsevier; 2005.
8.West JB. Respiratory Physiology-Essentials. 6th ed. Baltimore: Williams & Wilkins; 2000.
9.Murray JF, Nadel JA. Textbook of Respiratory Medicine. 3rd ed. New York: W. B. Saunders.
10.Severinghaus JW, Astrup PB. History of blood gas analysis. VI: Oximetry. J Clin Monit 1986;2:270–288.
11.Millikan GA, Pappenheimer JR, Rawson AJ, et al. Continuous measurement of oxygen saturation in man. Am J Physiol 1941;133:390.
484BLOOD GAS MEASUREMENTS
12.Adams AP, Hahn CEW. Principles and Practice of Blood Gas Analysis. London: Franklin Scientific Products; 1979.
13.Payne JB, Severinghaus JW. Pulse Oximetry. New York: Springer-Verlag; 1986.
14.Baker SJ, Tremper KK. The effect of carbon monoxide inhalation on pulse oximetry and transcutaneous PO2. Anesthesiology 1987;66:677–679.
15.Baker SJ, Tremper KK, Hyatt J. Effects of methemoglobinemia on pulse oximetry and mixed venous oximetry. Anesthesiology 1989;70:112–117.
16.Severinghaus JW, Honda Y. History of blood gas analysis. VII. Pulse oximetry. J Clin Monit 1987;3:135–138.
17.Severinghaus JW. History and recent developments in pulse oximetry. Scand J Clin Lab Invest 1993;214 (1 Suppl): 105–111.
18.Merrick EB, Hayes TJ. Continuous noninvasive measurements of arterial blood oxygen levels. Hewlett-Packard J 1976;28920:2–9.
19.Aoyagi T, Miyasaka K. Pulse oximetry: its invention, contribution to medicine, and future tasks. Anesth Analg 2002;94(1 Suppl): S1–3.
20.Tremper KK, Barker SJ. Pulse oximetry. Anesthesiology 1989;70:98–108.
21.Welch JP, DeCesare MS, Hess D. Pulse oximetry: Instrumentation and clinical applications. Respir Care 1990;35: 584–601.
22.Robertson F, Hoffman G. Clinical evaluation of Masimo SET and Nellcor N395 oximeters during signal conditions in difficult-to-monitor neonates. Anesthesiology 2002;96:A556.
23.Barker SJ. The performance of six ‘‘motion-resistant’’ pulse oximeters during motion, hypoxemia, and low perfusion in volunteers. Anesthesiology 2001;95:A587.
24.Pologe JA, Tobin RM. Method and apparatus for improved photoplethysmographic perfusion-index monitoring. US patent 5,766,127. 1998.
25.http://www.nellcor.com.
26.Lima AP, Beelen P, Bakker J. Use of peripheral perfusion index derived from the pulse oximetry signal as a noninvasive indicator of perfusion. Crit Care Med 2002;30(6):1210– 1213.
27.Soubani AO. Noninvasive monitoring of oxygen and carbon dioxide. Am J Emerg Med 2001;19(2).
28.Shapiro BA, Harrison RA, Cane RD. Clinical Application of Blood Gases. 4th ed. Chicago: Year Book Medical Publishers, Inc.; 1989.
29.Williams AJ. ABC of oxygen: Assessing and interpreting arterial blood gases and acid–base balance. Br Med J 1998;317(7167): 1213–1216.
30.Poets FC, Southall DP. Noninvasive monitoring of oxygenation in infants and children: Practical considerations and areas of concern. Pediatrics 1994;93(5): 737–746.
31.Severinghaus JW, Naifeh KH, Koh SO. Errors in 14 pulse oximeters during profound hypoxia. J Clin Monit 1989;5: 72–81.
32.Clayton DG, Webb RK, Ralston AC, et al. A comparison of the performance of 20 pulse oximeters under conditions of poor perfusion. Anaesthesia 1991;46:3–10.
33.Sidi A, Paulus DA, Rush W, et al. Methylene blue and indocyanine green artifactually low pulse oximetry readings of oxygen saturation. Studies in dogs. J Clin Monit 1987; 3:249–256.
34.Lynn LA. Interpretive Oximetry: Future Directions for Diagnostic Applications of SpO2 Time-Series. Anesthesia Analgesia 2002;94:S84–S88.
35.Zimmerman JL, Dellinger RP. Initial evaluation of a new intra-arterial blood gas system in humans. Crit Care Med 1993;21:495–500.
36.Ganter M, Zollinger A. Continuous intravascular blood gas monitoring: development, current techniques, and clinical use of a commercial device. Br J Anaesth 2003;91:397– 407.
37.Coule LW, Truemper EJ, Steinhart CM, Lutin WA. Accuracy and utility of a continuous intra-arterial blood gas monitoring system in pediatric patients. Crit Care Med 2001;29(2): 420– 426.
38.Dildy GA. Intrapartum fetal pulse oximetry: past, present, and future. Am J Obstet Gynecol 1996;175(1): 1–9.
39.Dildy GA, Van den Berg PP, Katz M, et al. Intrapartum fetal pulse oximetry: fetal oxygen saturation trends during labor and relation to delivery outcome. Am J Obstet Gynecol 1994; 171:679–684.
40.Papiernik E. Fetal pulse oximetry: correlation between changes in oxygen saturation and neonatal outcome. Eur J Obstet Gynecol Reprod Biol 1994;57:73–77.
41.McNamara H, Chung DC, Lilford R, Johnson N. Do fetal pulse oximetry readings at delivery correlate with cord blood oxygenation and acidaemia. Br J Obstet Gynaecol 1992;99: 735–738.
42.Severinghaus JW. The current status of transcutaneous blood gas analysis and monitoring. Blood Gas News 1998; 9(2).
43.Franklin ML. Transcutaneous measurement of partial pressure of oxygen and carbon dioxide. Respir Care Clin North Am 1995;1:119–131.
44.Padberg FT, Back TL, Thompson PN, et al. Transcutaneous
oxygen (TcPO2) estimates probability of healing in the ischemic extremity. J Surg Res 1996;60:365–369.
45.Rooke TW. The use of transcutaneous oximetry in the noninvasive vascular laboratory. Int Angiol 1992;11(1): 46– 40.
46.Tremper KK, Barker SJ. Fundamental principles of monitoring instrumentation. In: Miller RD, editor. Anesthesia. Vol I, 3rd ed. New York: Churchill Livingstone; 1990. p 957–999.
47.Raemer BD, Philip JH. Monitoring anesthetic and respiratory gases. In: Blitt CE, editor. Monitoring in Anesthesia and Critical Care Medicine. 2nd ed. New York: Churchill Livingstone; 1990. p 373–386.
48.Graybeal JM, Russell GB. Relative agreement between Raman and mass spectrometry for measuring end-tidal carbon dioxide. Respir Care 1994;39:190–194.
49.Mollgaard K. Acoustic gas measurement. Biomed Instr Technol 1989;23:495–497.
50.Block FE, McDonald JS. Sidestream versus mainstream carbon dioxide analyzers. J Clin Monit 1992;8:139–141.
51.Casti A, Gallioli G, Scandroglio G, Passaretta R, Borghi B, Torri G. Accuracy of end-tidal carbon dioxide monitoring using the NBP-75 microstream capnometer. A study in intubated ventilated and spontaneously breathing nonintubated patients. Euro J Anesthesiol 2000;17:622–626.
52.AARC Clinical Practice Guidelines. Capnography/capnometry during mechanical ventilation (2003 update). Respir Care 2003;48:534–539.
53.Shibutani K, Muraoka M, Shirasaki S, Kubal K, Sanchala
VT, Gupte P. Do changes in end-tidal PCO2 quantitatively reflect changes in cardiac output? Anesth Analg 1994;79(5): 829–833.
54.Rackow EC, et al. Sublingual capnometry and indexes of tissue perfusion in patients with circulatory failure. Chest 2001;120:1633–1638.
55.Weil MB, et al. Sublingual capnometry: a new noninvasive measurement for diagnosis and quantitation of severity of circulatory shock. Crit Care Med 1999;27:1225–1229.
56.Marik PE. Sublingual capnography: a clinical validation study. Chest 2001;120:923–927.