


C H A P T E R 1 The Science of Macroeconomics | 15
1-3 How This Book Proceeds
This book has six parts.This chapter and the next make up Part One, the Introduction. Chapter 2 discusses how economists measure economic variables, such as aggregate income, the inflation rate, and the unemployment rate.
Part Two, “Classical Theory: The Economy in the Long Run,” presents the classical model of how the economy works. The key assumption of the classical model is that prices are flexible.That is, with rare exceptions, the classical model assumes that markets clear. Because the assumption of price flexibility describes the economy only in the long run, classical theory is best suited for analyzing a time horizon of at least several years.
Part Three,“Growth Theory:The Economy in the Very Long Run,” builds on the classical model. It maintains the assumptions of price flexibility and market clearing but adds a new emphasis on growth in the capital stock, the labor force, and technological knowledge. Growth theory is designed to explain how the economy evolves over a period of several decades.
Part Four, “Business Cycle Theory: The Economy in the Short Run,” examines the behavior of the economy when prices are sticky. The non-market-clearing model developed here is designed to analyze short-run issues, such as the reasons for economic fluctuations and the influence of government policy on those fluctuations. It is best suited for analyzing the changes in the economy we observe from month to month or from year to year.
Part Five,“Macroeconomic Policy Debates,” builds on the previous analysis to consider what role the government should have in the economy. It considers how, if at all, the government should respond to short-run fluctuations in real GDP and unemployment. It also examines the various views of how government debt affects the economy.
Part Six, “More on the Microeconomics Behind Macroeconomics,” presents some of the microeconomic models that are useful for analyzing macroeconomic issues. For example, it examines the household’s decisions regarding how much to consume and how much money to hold and the firm’s decision regarding how much to invest. These individual decisions together form the larger macroeconomic picture. The goal of studying these microeconomic decisions in detail is to refine our understanding of the aggregate economy.
Summary
1.Macroeconomics is the study of the economy as a whole, including growth in incomes, changes in prices, and the rate of unemployment. Macroeconomists attempt both to explain economic events and to devise policies to improve economic performance.
2.To understand the economy, economists use models—theories that simplify reality in order to reveal how exogenous variables influence endogenous variables.The art in the science of economics is in judging whether a

16 | P A R T I Introduction
model captures the important economic relationships for the matter at hand. Because no single model can answer all questions, macroeconomists use different models to look at different issues.
3.A key feature of a macroeconomic model is whether it assumes that prices are flexible or sticky. According to most macroeconomists, models with flexible prices describe the economy in the long run, whereas models with sticky prices offer a better description of the economy in the short run.
4.Microeconomics is the study of how firms and individuals make decisions and how these decisionmakers interact. Because macroeconomic events arise from many microeconomic interactions, all macroeconomic models must be consistent with microeconomic foundations, even if those foundations are only implicit.
K E Y C O N C E P T S
Macroeconomics |
Recession |
Exogenous variables |
Real GDP |
Depression |
Market clearing |
Inflation and deflation |
Models |
Flexible and sticky prices |
Unemployment |
Endogenous variables |
Microeconomics |
Q U E S T I O N S F O R R E V I E W
1.Explain the difference between macroeconomics and microeconomics. How are these two fields related?
2.Why do economists build models?
3.What is a market-clearing model? When is it appropriate to assume that markets clear?
P R O B L E M S A N D A P P L I C A T I O N S
1.What macroeconomic issues have been in the news lately?
2.What do you think are the defining characteristics of a science? Does the study of the economy have these characteristics? Do you think macroeconomics should be called a science? Why or why not?
3.Use the model of supply and demand to explain how a fall in the price of frozen yogurt would
affect the price of ice cream and the quantity of ice cream sold. In your explanation, identify the exogenous and endogenous variables.
4.How often does the price you pay for a haircut change? What does your answer imply about the usefulness of market-clearing models for analyzing the market for haircuts?

C H A P T E R 2
The Data of Macroeconomics
It is a capital mistake to theorize before one has data. Insensibly one begins to
twist facts to suit theories, instead of theories to fit facts.
—Sherlock Holmes
Scientists, economists, and detectives have much in common: they all want to figure out what’s going on in the world around them. To do this, they rely on theory and observation. They build theories in an attempt to make
sense of what they see happening. They then turn to more systematic observation to evaluate the theories’ validity. Only when theory and evidence come into line do they feel they understand the situation. This chapter discusses the types of observation that economists use to develop and test their theories.
Casual observation is one source of information about what’s happening in the economy. When you go shopping, you see how fast prices are rising. When you look for a job, you learn whether firms are hiring. Because we are all participants in the economy, we get some sense of economic conditions as we go about our lives.
A century ago, economists monitoring the economy had little more to go on than casual observations. Such fragmentary information made economic policymaking all the more difficult. One person’s anecdote would suggest the economy was moving in one direction, while a different person’s anecdote would suggest it was moving in another. Economists needed some way to combine many individual experiences into a coherent whole. There was an obvious solution: as the old quip goes, the plural of “anecdote” is “data.”
Today, economic data offer a systematic and objective source of information, and almost every day the newspaper has a story about some newly released statistic. Most of these statistics are produced by the government.Various government agencies survey households and firms to learn about their economic activity—how much they are earning, what they are buying, what prices they are charging, whether they have a job or are looking for work, and so on. From these surveys, various statistics are computed that summarize the state of the economy. Economists use these statistics to study the economy; policymakers use them to monitor developments and formulate policies.
This chapter focuses on the three statistics that economists and policymakers use most often. Gross domestic product, or GDP, tells us the nation’s total
17

18 | P A R T I Introduction
income and the total expenditure on its output of goods and services. The consumer price index, or CPI, measures the level of prices. The unemployment rate tells us the fraction of workers who are unemployed. In the following pages, we see how these statistics are computed and what they tell us about the economy.
2-1 Measuring the Value of Economic
Activity: Gross Domestic Product
Gross domestic product, or GDP, is often considered the best measure of how well the economy is performing. This statistic is computed every three months by the Bureau of Economic Analysis, a part of the U.S. Department of Commerce, from a large number of primary data sources. The primary sources include both administrative data, which are byproducts of government functions such as tax collection, education programs, defense, and regulation, and statistical data, which come from government surveys of, for example, retail establishments, manufacturing firms, and farm activity. The purpose of GDP is to summarize all these data with a single number representing the dollar value of economic activity in a given period of time.
There are two ways to view this statistic. One way to view GDP is as the total income of everyone in the economy. Another way to view GDP is as the total expenditure on the economy’s output of goods and services. From either viewpoint, it is clear why GDP is a gauge of economic performance. GDP measures something people care about—their incomes. Similarly, an economy with a large output of goods and services can better satisfy the demands of households, firms, and the government.
How can GDP measure both the economy’s income and its expenditure on output? The reason is that these two quantities are really the same: for the economy as a whole, income must equal expenditure. That fact, in turn, follows from an even more fundamental one: because every transaction has a buyer and a seller, every dollar of expenditure by a buyer must become a dollar of income to a seller. When Joe paints Jane’s house for $1,000, that $1,000 is income to Joe and expenditure by Jane. The transaction contributes $1,000 to GDP, regardless of whether we are adding up all income or all expenditure.
To understand the meaning of GDP more fully, we turn to national income accounting, the accounting system used to measure GDP and many related statistics.
Income, Expenditure, and the Circular Flow
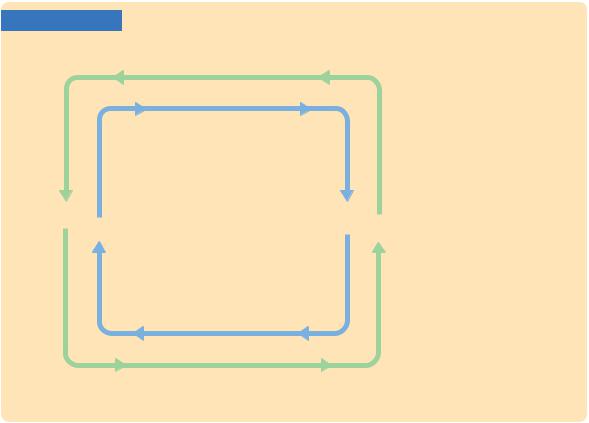
Imagine an economy that produces a single good, bread, from a single input, labor. Figure 2-1 illustrates all the economic transactions that occur between households and firms in this economy.
The inner loop in Figure 2-1 represents the flows of bread and labor. The households sell their labor to the firms. The firms use the labor of their workers
C H A P T E R 2 The Data of Macroeconomics | 19
FIGURE 2-1
|
|
Income ($) |
|
|
The Circular Flow |
|
|
|
|
This figure illustrates |
|
|
|
|
|
|
the flows between firms |
|
|
Labor |
|
|
and households in an |
|
|
|
|
|
economy that produces |
|
|
|
|
|
one good, bread, from |
|
|
|
|
|
one input, labor. The |
|
|
|
|
|
inner loop represents |
|
|
|
|
|
the flows of labor and |
|
|
|
|
|
bread: households sell |
|
|
|
|
|
their labor to firms, |
|
|
|
|
|
and the firms sell the |
|
|
|
|
|
|
|
Households |
|
Firms |
|
bread they produce to |
|
|
|
|
|
households. The outer |
|
|
|
|
|
loop represents the cor- |
|
|
|
|
|
responding flows of |
|
|
|
|
|
dollars: households pay |
|
|
|
|
|
the firms for the bread, |
|
|
|
|
|
and the firms pay |
|
|
Goods (bread) |
|
|
wages and profit to the |
|
|
|
|
|
households. In this |
|
|
Expenditure ($) |
|
|
economy, GDP is both |
|
|
|
|
the total expenditure |
|
|
|
|
|
|
|
|
|
|
|
|
on bread and the total |
|
|
|
|
|
income from the pro- |
|
|
|
|
|
|
|
|
|
|
|
duction of bread. |
to produce bread, which the firms in turn sell to the households. Hence, labor flows from households to firms, and bread flows from firms to households.
The outer loop in Figure 2-1 represents the corresponding flow of dollars. The households buy bread from the firms. The firms use some of the revenue from these sales to pay the wages of their workers, and the remainder is the profit belonging to the owners of the firms (who themselves are part of the household sector). Hence, expenditure on bread flows from households to firms, and income in the form of wages and profit flows from firms to households.
GDP measures the flow of dollars in this economy. We can compute it in two ways. GDP is the total income from the production of bread, which equals the sum of wages and profit—the top half of the circular flow of dollars. GDP is also the total expenditure on purchases of bread—the bottom half of the circular flow of dollars. To compute GDP, we can look at either the flow of dollars from firms to households or the flow of dollars from households to firms.
These two ways of computing GDP must be equal because, by the rules of accounting, the expenditure of buyers on products is income to the sellers of those products. Every transaction that affects expenditure must affect income, and every transaction that affects income must affect expenditure. For example, suppose that a firm produces and sells one more loaf of bread to a household. Clearly this transaction raises total expenditure on bread, but it also has an equal effect