208 | P A R T I I I Growth Theory: The Economy in the Very Long Run
TA B L E 7-3
Finding the Golden Rule Steady State: A Numerical Example
|
Assumptions: |
y = k; d = 0.1 |
|
|
|
|
|
|
|
s |
k* |
y* |
dk* |
c* |
MPK |
MPK − d |
|
0.0 |
0.0 |
0.0 |
0.0 |
0.0 |
|
|
|
|
0.1 |
1.0 |
1.0 |
0.1 |
0.9 |
0.500 |
0.400 |
|
|
0.2 |
4.0 |
2.0 |
0.4 |
1.6 |
0.250 |
0.150 |
|
|
0.3 |
9.0 |
3.0 |
0.9 |
2.1 |
0.167 |
0.067 |
|
|
0.4 |
16.0 |
4.0 |
1.6 |
2.4 |
0.125 |
0.025 |
|
|
0.5 |
25.0 |
5.0 |
2.5 |
2.5 |
0.100 |
0.000 |
|
|
0.6 |
36.0 |
6.0 |
3.6 |
2.4 |
0.083 |
−0.017 |
||
0.7 |
49.0 |
7.0 |
4.9 |
2.1 |
0.071 |
−0.029 |
||
0.8 |
64.0 |
8.0 |
6.4 |
1.6 |
0.062 |
−0.038 |
||
0.9 |
81.0 |
9.0 |
8.1 |
0.9 |
0.056 |
−0.044 |
||
1.0 |
100.0 |
10.0 |
10.0 |
0.0 |
0.050 |
−0.050 |
||
|
|
|
|
|
|
|
|
|
Using this formula, the last two columns of Table 7-3 present the values of MPK and MPK – d in the different steady states. Note that the net marginal product of capital is exactly zero when the saving rate is at its Golden Rule value of 0.5. Because of diminishing marginal product, the net marginal product of capital is greater than zero whenever the economy saves less than this amount, and it is less than zero whenever the economy saves more.
This numerical example confirms that the two ways of finding the Golden Rule steady state—looking at steady-state consumption or looking at the marginal product of capital—give the same answer. If we want to know whether an actual economy is currently at, above, or below its Golden Rule capital stock, the second method is usually more convenient, because it is relatively straightforward to estimate the marginal product of capital. By contrast, evaluating an economy with the first method requires estimates of steady-state consumption at many different saving rates; such information is harder to obtain. Thus, when we apply this kind of analysis to the U.S. economy in the next chapter, we will evaluate U.S. saving by examining the marginal product of capital. Before engaging in that policy analysis, however, we need to proceed further in our development and understanding of the Solow model.
The Transition to the Golden Rule Steady State
Let’s now make our policymaker’s problem more realistic. So far, we have been assuming that the policymaker can simply choose the economy’s steady state and jump there immediately. In this case, the policymaker would choose the steady state with highest consumption—the Golden Rule steady state. But now suppose that the economy has reached a steady state other than the Golden Rule. What
C H A P T E R 7 Economic Growth I: Capital Accumulation and Population Growth | 209
happens to consumption, investment, and capital when the economy makes the transition between steady states? Might the impact of the transition deter the policymaker from trying to achieve the Golden Rule?
We must consider two cases: the economy might begin with more capital than in the Golden Rule steady state, or with less. It turns out that the two cases offer very different problems for policymakers. (As we will see in the next chapter, the second case—too little capital—describes most actual economies, including that of the United States.)
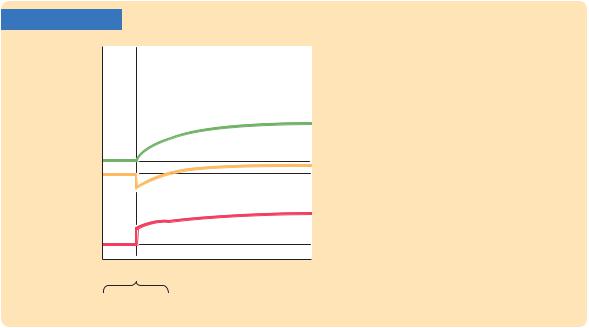
Starting With Too Much Capital We first consider the case in which the economy begins at a steady state with more capital than it would have in the Golden Rule steady state. In this case, the policymaker should pursue policies aimed at reducing the rate of saving in order to reduce the capital stock. Suppose that these policies succeed and that at some point—call it time t0—the saving rate falls to the level that will eventually lead to the Golden Rule steady state.
Figure 7-9 shows what happens to output, consumption, and investment when the saving rate falls. The reduction in the saving rate causes an immediate increase in consumption and a decrease in investment. Because investment and depreciation were equal in the initial steady state, investment will now be less than depreciation, which means the economy is no longer in a steady state. Gradually, the capital stock falls, leading to reductions in output, consumption, and investment. These variables continue to fall until the economy reaches the new steady state. Because we are assuming that the new steady state is the Golden Rule steady state, consumption must be higher than it was before the change in the saving rate, even though output and investment are lower.
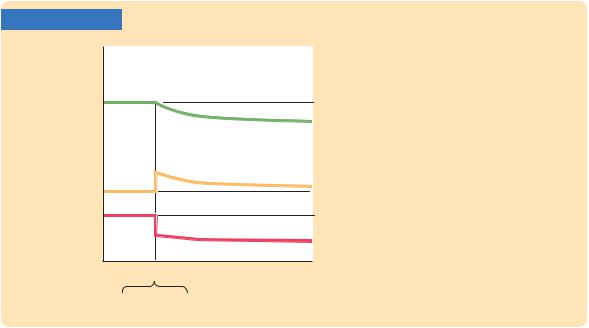
FIGURE 7-9 |
|
Output, y |
|
Consumption, c |
|
Investment, i |
|
t0 |
Time |