


180 | P A R T I I Classical Theory: The Economy in the Long Run
TA B L E 6-3
Alternative Measures of Labor Underutilization
Variable |
Description |
Rate |
U-1 |
Persons unemployed 15 weeks or longer, as a percent of the civilian labor |
2.6% |
|
force (includes only very long-term unemployed) |
|
U-2 |
Job losers and persons who have completed temporary jobs, as a percent of |
3.9 |
|
the civilian labor force (excludes job leavers) |
|
U-3 |
Total unemployed, as a percent of the civilian labor force (official |
6.7 |
|
unemployment rate) |
|
U-4 |
Total unemployed, plus discouraged workers, as a percent of the civilian |
7.0 |
|
labor force plus discouraged workers |
|
U-5 |
Total unemployed plus all marginally attached workers, as a percent of the |
7.8 |
|
civilian labor force plus all marginally attached workers |
|
U-6 |
Total unemployed, plus all marginally attached workers, plus total employed |
12.5 |
|
part time for economic reasons, as a percent of the civilian labor force plus |
|
|
all marginally attached workers |
|
Note: Marginally attached workers are persons who currently are neither working nor looking for work but indicate that they want and are available for a job and have looked for work sometime in the recent past. Discouraged workers, a subset of the marginally attached, have given a job-market-related reason for not currently looking for a job. Persons employed part time for economic reasons are those who want and are available for full-time work but have had to settle for a part-time schedule. Source: U.S. Department of Labor. Data are for November 2008.
Because of these and many other issues that complicate the interpretation of the unemployment data, the Bureau of Labor Statistics calculates several measures of labor underutilization. Table 6-3 gives the definitions and their values as of November 2008. The measures range from 2.6 to 12.5 percent, depending on the characteristics one uses to classify a worker as not fully employed.
6-5 Labor-Market Experience: Europe
Although our discussion has focused largely on the United States, many fascinating and sometimes puzzling phenomena become apparent when economists compare the experiences of Americans in the labor market with those of Europeans.
The Rise in European Unemployment
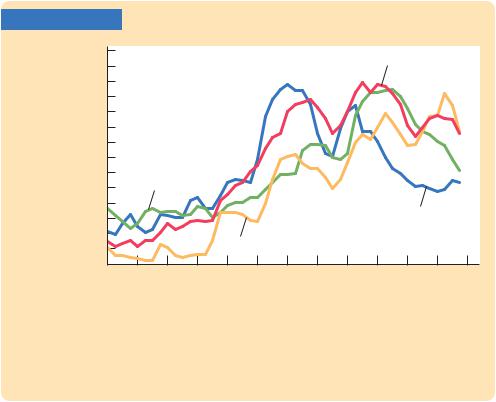
Figure 6-4 shows the rate of unemployment from 1960 to 2007 in the four largest European countries—France, Germany, Italy, and the United Kingdom. As you can see, the rate of unemployment in these countries has risen substantially. For France and Germany, the change is particularly pronounced: unemployment averaged about 2 percent in the 1960s and about 10 percent in recent years.
|
|
C H A P T E R |
6 Unemployment | 181 |
FIGURE 6-4 |
|
|
|
Percent |
14 |
France |
|
Unemployed |
|
|
|
|
|
|
|
|
12 |
|
|
|
10 |
|
|
|
8 |
|
|
|
6 |
Italy |
|
|
|
|
|
|
4 |
United |
|
|
|
|
|
|
2 |
Kingdom |
|
|
Germany |
|
|
|
|
|
|
|
0 |
|
|
|
1960 1964 1968 1972 1976 1980 1984 1988 1992 1996 2000 2004 2008 |
||
|
|
|
Year |
Unemployment in Europe This figure shows the unemployment rate in the four largest nations in Europe. The figure shows that the European unemployment rate has risen substantially over time, especially in France and Germany.
Source: Bureau of Labor Statistics.
What is the cause of rising European unemployment? No one knows for sure, but there is a leading theory. Many economists believe that the problem can be traced to the interaction between a long-standing policy and a more recent shock. The long-standing policy is generous benefits for unemployed workers. The recent shock is a technologically driven fall in the demand for unskilled workers relative to skilled workers.
There is no question that most European countries have generous programs for those without jobs. These programs go by various names: social insurance, the welfare state, or simply “the dole.” Many countries allow the unemployed to collect benefits for years, rather than for only a short period of time as in the United States. In some sense, those living on the dole are really out of the labor force: given the employment opportunities available, taking a job is less attractive than remaining without work. Yet these people are often counted as unemployed in government statistics.
There is also no question that the demand for unskilled workers has fallen relative to the demand for skilled workers. This change in demand is probably due to changes in technology: computers, for example, increase the demand for workers who can use them and reduce the demand for those who cannot. In the United States, this change in demand has been reflected in wages rather than unemployment: over the past two decades, the wages of unskilled workers have fallen substantially relative to the wages of skilled workers. In Europe, however,
182 | P A R T I I Classical Theory: The Economy in the Long Run
the welfare state provides unskilled workers with an alternative to working for low wages. As the wages of unskilled workers fall, more workers view the dole as their best available option. The result is higher unemployment.
This diagnosis of high European unemployment does not suggest an easy remedy. Reducing the magnitude of government benefits for the unemployed would encourage workers to get off the dole and accept low-wage jobs. But it would also exacerbate economic inequality—the very problem that welfare-state policies were designed to address.9
Unemployment Variation Within Europe
Europe is not a single labor market but is, instead, a collection of national labor markets, separated not only by national borders but also by differences in culture and language. Because these countries differ in their labor-market policies and institutions, variation within Europe provides a useful perspective on the causes of unemployment. Many empirical studies have, therefore, focused on these international differences.
The first noteworthy fact is that the unemployment rate varies substantially from country to country. For example, in August 2008, when the unemployment rate was 6.1 percent in the United States, it was 2.4 percent in Switzerland and 11.3 percent in Spain. Although in recent years average unemployment has been higher in Europe than in the United States, about a third of Europeans have been living in nations with unemployment rates lower than the U.S. rate.
A second notable fact is that much of the variation in unemployment rates is attributable to the long-term unemployed. The unemployment rate can be separated into two pieces—the percentage of the labor force that has been unemployed for less than a year and the percentage of the labor force that has been unemployed for more than a year. The long-term unemployment rate exhibits more variability from country to country than does the short-term unemployment rate.
National unemployment rates are correlated with a variety of labor-market policies. Unemployment rates are higher in nations with more generous unemployment insurance, as measured by the replacement rate—the percentage of previous wages that is replaced when a worker loses a job. In addition, nations tend to have higher unemployment, especially higher long-term unemployment, if benefits can be collected for longer periods of time.
Although government spending on unemployment insurance seems to raise unemployment, spending on “active” labor-market policies appears to decrease it. These active labor-market policies include job training, assistance with job search, and subsidized employment. Spain, for instance, has historically had a high rate of unemployment, a fact that can be explained by the combination of generous payments to the unemployed with minimal assistance at helping them find new jobs.
9 For more discussion of these issues, see Paul Krugman, “Past and Prospective Causes of High Unemployment,” in Reducing Unemployment: Current Issues and Policy Options, Federal Reserve Bank of Kansas City, August 1994.

C H A P T E R 6 Unemployment | 183
The role of unions also varies from country to country, as we saw in Table 6-1. This fact also helps explain differences in labor-market outcomes. National unemployment rates are positively correlated with the percentage of the labor force whose wages are set by collective bargaining with unions. The adverse impact of unions on unemployment is smaller, however, in nations where there is substantial coordination among employers in bargaining with unions, perhaps because coordination may moderate the upward pressure on wages.
A word of warning: Correlation does not imply causation, so empirical results such as these should be interpreted with caution. But they do suggest that a nation’s unemployment rate, rather than being immutable, is instead a function of the choices a nation makes.10
CASE STUDY
The Secrets to Happiness
Why are some people more satisfied with their lives than others? This is a deep and difficult question, most often left to philosophers, psychologists, and selfhelp gurus. But part of the answer is macroeconomic. Recent research has shown that people are happier when they are living in a country with low inflation and low unemployment.
From 1975 to 1991, a survey called the Euro-Barometer Survey Series asked 264,710 people living in 12 European countries about their happiness and overall satisfaction with life. One question asked,“On the whole, are you very satisfied, fairly satisfied, not very satisfied, or not at all satisfied with the life you lead?” To see what determines happiness, the answers to this question were correlated with individual and macroeconomic variables. Other things equal, people are more satisfied with their lives if they are rich, educated, married, in school, self-employed, retired, female, or either young or old (as opposed to middle-aged). They are less satisfied if they are unemployed, divorced, or living with adolescent children. (Some of these correlations may reflect the effects, rather than causes, of happiness; for example, a happy person may find it easier than an unhappy one to keep a job and a spouse.)
Beyond these individual characteristics, the economy’s overall rates of unemployment and inflation also play a significant role in explaining reported happiness. An increase in the unemployment rate of 4 percentage points is large enough to move 11 percent of the population down from one life-satisfaction category to another. The overall unemployment rate reduces satisfaction even after controlling for an individual’s employment status. That is, the employed in a high-unemployment nation are less happy than their counterparts in a lowunemployment nation, perhaps because they are more worried about job loss or perhaps out of sympathy with their fellow citizens.
High inflation is also associated with lower life satisfaction, although the effect is not as large. A 1.7-percentage-point increase in inflation reduces happiness by
10 Stephen Nickell, “Unemployment and Labor Market Rigidities: Europe Versus North America,” Journal of Economic Perspectives 11 (September 1997): 55–74.