

34ELECTROCARDIOGRAPHY, COMPUTERS IN
39.Melzack R, Wall PD. Pain mechanism: a new theory. Science 1965;150:971–79.
40. Wall PD. The gate control theory of pain mechanisms. A re-examination and re-statement. Brain 1978;101:1– 18.
41.Sjo¨lund B, Ericson R. Electropuncture and endogenous morphines. Lancet 1975;2:1085.
42.Fox EJ, Melzach. Transcutaneous nerve stimulation and acupuncture. Comparison of treatment for low back pain. Pain 1976;2:141–149.
43.Akil H, et al. Encephaline-like material elevated in ventricular cerebrospinal fluid of pain patient after analgesic focal stimulation. Science 1978;201:463.
44.Henry JL. Substance P and pain: An updating. Trends Neurosc 1980;3:95–97.
45.Le Bars D. Serotonin and pain. In: Osbone NN, Hamon M, editors. Neuronal Serotonin. New York: John Wiley & Sons Ltd.; 1988. Chapt. 7. p 171–229.
46.Bailey PL, et al. Transcutaneous cranial electrical stimulation, experimental pain and plasma b-endorphin in man. Pain 1984;2:S66.
47.Willer JC, Boureau F, Albe-Fessard D. Role of large diameter cutaneous afferents in transmission of nociceptive messages: electrical study in man. Brain Res 1978;132: 358–364.
48.Willer JC, Boureau F, Albe-Fessard D. Human nociceptive reactors; effects of spacial sommation of afferent input from relatively large diameter fibers. Brain Res 1980;201: 465–70.
49.Pederson M, McDonald S, Long DM. An investigation determining the efficacy of TENS and the use of analgesia during labor in groups of women. Pain 1984;2:S69.
50.Melzack R, Stillwell D, Fox E. Trigger points and acupuncture points for pain: Correlations and implications. Pain 1977;3:23–28.
51.Hanai F. Effect of electrical stimulation of peripheral nerves on neuropathic pain. Spine 2000;25:1886–1892.
52.Campbell JN, Long DM. Peripheral nerve stimulation in the treatment of intractable pain. J Neurosurg 1976;45:692– 699.
53.Woolf CJ. Transcutaneous electrical nerve stimulation and the reaction to experimental pain in human subjects. Pain 1979;7:115–127.
54.Kim WS. Clinical study of the management of postoperative pain with transcutaneous electrical nerve stimulation. Pain 1984;2:S73.
55.Park SP, et al. Transcutaneous electrical nerve stimulation. (TENS) for postoperative pain control. Pain 1984;2: S68.
56.Wilson OB, et al. The influence of electrical variables on analgesia produced by low current transcranial electrostimulation of rats. Anesth Analg 1989;68:673–681.
57.Limoge A, Boisgontier MT. Characteristics of electric currents used in human anesthesiology. NATO-ASI Series. In: Rybak B, editor. Advanced Technobiology. Germantown (MD): Sijthoff & Noordhoff; 1979. p 437–446.
58.Debras C, et al. Use of Limoge’s current in human anesthesiology. NATO-ASI Series. In: Rybak B, editor. Advanced technobiology. Germantown (MD): Sijthoff & Noordhoff; 1979. p 447–465.
59.Limoge A, et al. Electrical anesthesia. In: Spiedijk J, Feldman SA, Mattie H, Stanley TH, editors. Developments in Drugs Used in Anesthesia. The Boerhave Series. Leiden: University Press; 1981. p 121–134.
60.Limoge A, Dixmerias-Iskandar F. A personal experience using Limoge’s current during a major surgery. Anesth Analg 2004;99:309.
61.Shealy CN, Mortimer JT, Reswick JB. Electrical inhibition of pain by stimulation of the dorsal columns. Anesth Analg 1967;46:489–91.
62.Burton CV. Safety and clinical efficacy of implanted neuroaugmentive spinal devices for the relief of pain. Appl Neurophysiol 1977;40:175–183.
63.Prieur G, et al. Approche mathe´matique de l’action biologique des courants de Limoge. J Biophys Biomec 1985;9(2):67– 74.
64.Malin DH, et al. Auricular microelectrostimulation: naloxone reversible attenuation of opiate abstinence syndrome. Biol Psychiat 1988;24:886–890.
65.Malin DH, et al. Augmented analgesic effects of enkephalinase inhibitors combined with transcranial electrostimulation. Life Sci 1989;44(19):1371–1376.
66.Stimmesse B, et al. b-endorphines plasmatiques et analge´sie e´lectrique durant l’accouchement. Cahiers d’Anesth 1986;34: 641–642.
67.Schloznikov BM, Kuzin MI, Avroustsky M. Influence de l’E.S.C.T. sur le contenu de b-endorphines dans le liquide ce´phalo-rachidien et dans le plasma sanguin. Nouvell Biol Expe´r 1984;5:515–516.
68.Kuzin MI, Limoge A. Electrischer strom und schmerzausschaltung. Berlin: Wissenschaft und Menschheit; 1985. p 50–57.
69.Kucera H, et al. The effects of electroanalgesia in obstetrics. In: Limoge A, Cara M, Debras Ch, editors. Electrotherapeutic Sleep and Electroanesthesia. Volume IV, Paris: Masson; 1978. p 73–77.
70.Champagne C, et al. Electrostimulation ce´re´brale transcutane´e par les courants de Limoge au cours de l’accouchement. Ann Fr Anesth Re´anim 1984;3:405–413.
71.Lakdja F. (personal communication).
See also ELECTROPHYSIOLOGY; SPINAL CORD STIMULATION; TRANSCUTANEOUS ELECTRICAL NERVE STIMULATION (TENS).
ELECTROCARDIOGRAPHY, COMPUTERS IN
HOMER NAZERAN
The University of Texas
El Paso, Texas
INTRODUCTION
Digital computers have the ability to store tremendous amount of data and retrieve them with amazing speed for further processing and display. These attributes of computers make them extremely useful in a modern clinic or hospital environment. Computers play a central role in medical diagnosis and treatment as well as management of all processes and information in the hospital including patient data. Computers greatly facilitate the recording and retrieval of patient data in a simple way. All areas of hospital including patient admittance and discharge, the wards, all specialty areas, clinical and research laboratories are now interconnected through computer intranet and even nationally or globally connected through computer internet networks. This arrangement provides for better coordination of patient management throughout various hospital departments, and reduces patient waiting
times. Obviously, computers also play a very important role in all aspects of administration and management of the hospital like other sophisticated institutions. Therefore, they greatly facilitate the overall planning and operation of the hospital resulting in improved healthcare services.
As the electrocardiographic (ECG) signal is one of the most, if not the most, measured and monitored vital signs, computers have had a tremendous impact in electrocardiography. One of the most well known areas of application of computers in medical diagnosis is their use in recording, monitoring, analysis and interpretation of ECG signals. Computers reduce interpretation time and ensure improved reliability and consistency of interpretation. Computers assist cardiologists by providing cost-effective and efficient means in ECG interpretation and relieve them from the tedious task of reviewing large numbers of ECG recordings. Computers also increase the diagnostic potential of ECG signals. Of course, cardiologists consider patient history, the details of the morphology of the ECG signals and other pertinent patient data backed by their clinical knowledge and experience to make a complete diagnosis. It should be clearly stated and emphasized that computers do in no way relieve the physicians of forming a complete clinical decision. However, computers provide them with information on the ECG examination in a clearer fashion and save them from the burden of routine, repetitive, and subjective calculations. An additional advantage of using computers in electrocardiography is the ease of storage and retrieval of ECG data for further study and analysis.
Computer processing of ECG signals, which are analogue in nature with amplitudes in low millivolt range and low frequency content (0.05–150 Hz), involves digitization with a typical sampling frequency of 500 Hz and 12 bit resolution in analog-to-digital conversion process. Further processing involves digital filtering, removal of powerline and biological artifacts (like EMG interference), averaging and automatic measurement of amplitudes and durations of different parts of the ECG signal. Computer analysis programs developed based upon the interpretative experience of thousands of experts performed on millions of ECG records, provide important ECG waveform components, such as amplitude, duration, slope, intervals, transform domain features, and interrelationships between individual waves of the ECG signal relative to one another. These parameters are then compared with those derived from normal ECGs to decide whether there is an abnormality in the recordings. There are a wealth of algorithms and methods developed over several decades to assist with computer-aided analysis and interpretation of ECG signals.
Computer-assisted ECG analysis is widely performed in ECG monitoring and interpretation. This method is effectively deployed in routine intensive care monitoring of cardiac patients, where the ECGs of several patients are continuously monitored to detect life-threatening abnormalities. The purpose of monitoring is not only to detect and treat ventricular fibrillation or cardiac arrests, but also to detect the occurrence of less threatening abnormalities like heart blocks and arrhythmias. The occurrence of such episodes and their timely detection helps clinicians to make early diagnostic decisions and take appropriate therapeutic measures. The accurate detection of trends resulting in
ELECTROCARDIOGRAPHY, COMPUTERS IN |
35 |
dangerous cardiac abnormalities by visual inspection of ECG displays or chart recorders is a difficult task. Computer-assisted analysis of ECG signals to extract baselines, amplitudes, slopes, and other important parameters to establish minimum and maximum values for these parameters provides an efficient and accurate means to track the nature of the ECG rhythms.
The ECG acquisition and analysis systems like many other biomedical devices are designed to measure physiological signals of clinical relevance and significance. To design and effectively use appropriate instrumentation to measure and process such signals, an understanding of the origin and properties of these signals are of prime importance. This article starts off with an attempt to present a distilled overview of the origin of bioelectric signals in general, and the electorcardiographic signal in particular. This overview sets the basis to briefly describe the cardiac vector and its projection along specific directions (leads) providing the surface ECG recordings and review the basic instrumentation necessary to record these signals. A detailed description of a high end computer-based 12 lead clinical ECG acquisition and analysis system provides an example to appreciate the role of computers in diagnostic electrocardiography. An overview of the role of computers in high resolution electrocardiography (body surface potential mapping) and other ECG-based diagnostic devices then follows. A brief introduction to computer-based ECG monitoring systems and a block diagram description of a QRS detection algorithm illustrate how computer programming serves as a basis to detect cardiac arrhythmias. The article ends with a webbased ECG telemonitoring system as an example.
REVIEW OF BASIC CONCEPTS
From cellular physiology, we recall that biopotentials are produced as a consequence of chemical activity of excitable or irritable cells. Excitable cells are components of the neural, muscular, glandular as well as many plant tissues. More specifically, biopotentials are generated as a consequence of ionic concentration difference of electrolytes (mainly Naþ, Kþ, Cl ions) across the cellular membrane of excitable cells. Ionic differences are maintained by membrane permeability properties and active transport mechanisms across the cellular membrane (ionic pumps.)
The cellular membrane is a semipermeable lipid bilayer that separates the extracellular and intracellular fluids having different ionic concentrations. As a consequence of semipermeability and differences in concentration of ions, electrochemical gradients are set up across the membrane. Ionic transfer across the membrane by diffusion and active transport mechanisms results in the generation of a voltage difference (membrane potential), which is negative inside. The resting membrane potential is mainly established by the efflux of Kþ ions due to diffusion and is balanced by the consequent inward electric field due to charge displacement. This equilibrium voltage can be estimated by the Nernst equation (1), which results from application of electric field theory and diffusion theory. If we consider the effects of the three main ions, potassium
36 ELECTROCARDIOGRAPHY, COMPUTERS IN
(Kþ), sodium (Naþ), and chloride (Cl ), the Goldman– Hodgkin and Katz equation can be used to calculate the resting membrane potential (1).
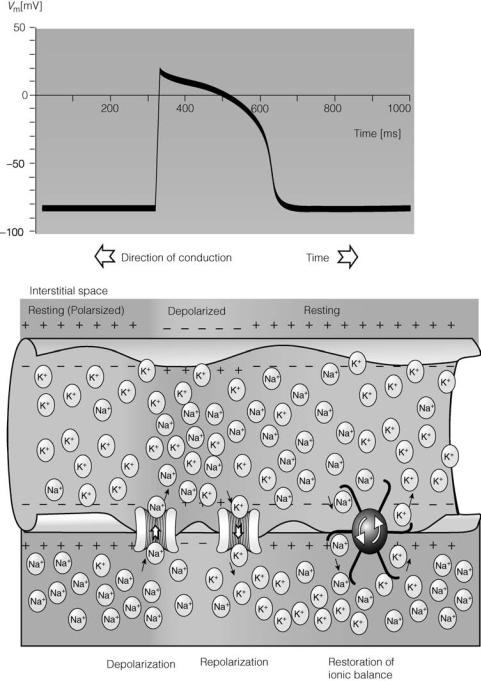
The smallest sources of bioelectric signals (biosources) are single excitable cells. These cells exhibit a quiescent or resting membrane potential across the cellular membrane of several millivolts (mV) ( 90 mV with several hundred milliseconds in duration for ventricular myocytes). When adequately stimulated, the transmembrane potential in excitable cells becomes positive inside with respect to outside (depolarization) and action potentials are generated (at the peak of the action potential in ventricular
myocytes, the membrane potential reaches about þ20 mV). Action potentials are produced by sudden permeability changes of cellular membrane to ions: primarily sodium and potassium ions. Action potentials are all-or-none monophasic waves of depolarization that travel unattenuated with a constant amplitude and speed along the cellular membrane (Fig. 1).
The excitable cells function in large groups as a single unit and the net effect of all stimulated (active) cells produces a time-varying electric field in the tissue surrounding the biosource. The surrounding tissue is called a volume conductor. The electric field spreads in the volume
Figure 1. The monophasic action potential, direction of conduction of the action potential, and movement of ions across the cellular membrane. (Courtesy of Ref. 2.)
conductor and can be detected as small voltages by means of bioelectrodes or simply electrodes placed in the tissue or on the skin. Electrodes are sensors, which convert ionic current flow in the living tissue to electronic current flow in the electromedical instrument.
To understand the origin (electrogenesis) of biopotential signals like ECG, we should consider the following:
1. Electrical activity (bioelectric phenomena) at the cardiac cellular level and the extracellular potentials generated as the result of the electrical activity of single cardiac cells placed in a large homogeneous bathing (conducting) medium with the same composition as body fluids (volume conductor fields of simple bioelectric sources).
2. Extracellular potentials generated as the result of the electrical activity of a large number of myocardial cells (tissues) placed in a large conducting medium with the ionic composition of body fluids (volume conductor fields of complex bioelectric sources).
3. The relationship between these extracellular potentials and the gross electrical activity recorded on the body surface as ECG signals.
A simplified version of the volume conductor problem at the cellular level can be considered as follows. If a single excitable cell is placed in a bathing conductive medium, it acts like a constant current source. When the biosource becomes adequately depolarized, an action potential is generated across its membrane and it injects a current to the surrounding medium. The conductive medium presents as a load with a long range of loading conditions depending on its geometry, temperature, and so on. The lines of current flowing out of the excitable cell into the volume conductor with a specific resistance r, gives rise to an extracellular field potential proportional to the transmembrane current (im) and the medium resistance (r) according to Ohm’s law. Obviously, the extracellular field potential increases with higher values of membrane current or tissue resistance.
There has been considerable debate about the exact relationship between the action potential across the cellular membrane and the shape of the extracellular field potential. However, the work of many researchers with different types of excitable cells has confirmed that the extracellular field potential resembles the second derivative of the transmembrane action potential. This means that a monophasic action potential creates a triphasic extracellular field potential (1). It has also been shown that the extracellular field potential is shorter in duration and much smaller in magnitude (mV compared to mV). Of course, this relationship has been established for cases when the geometry of the biosource and its surrounding environment is simple and the volume conductor is isotropic (uniform in all directions).
More realistically, when a piece of excitable tissue in the living organism becomes electrically active it becomes depolarized, acts like a point current source and injects a current into the anisotropic volume conductor comprised of tissues
ELECTROCARDIOGRAPHY, COMPUTERS IN |
37 |
and body fluids surrounding it with different conductances (resistances). Consequently, the spatial distribution of current will not resemble that of a simple dipole placed in an isotropic volume conductor. However, it has been shown that an active nerve trunk (comprised of thousands of sensory and motor nerve fibers simultaneously stimulated) placed in a large homogeneous volume conductor generates an extracellular field potential which is quite similar in shape to that of a single nerve fiber (1). It is concluded that, the extracellular field potential is formed from the contributions of superimposed electric fields of the component biosources in the nerve trunk. The general form of the extracellular field potential of a nerve trunk in response to electrical stimulation is triphasic, it has amplitude in the microvolt range and it loses both amplitude and high frequency content at large radial distances from the nerve trunk. It is observed that the major contribution to the triphasic extracellular field potential is from the motor nerves in the trunk. It has also been shown that with a change in the volume conductor load (e.g., an increase in the specific resistance of the volume conductor or a decrease in the radial distance from the complex biosource) the amplitude of the recorded extracellular field potential increases (1).
The concepts discussed above are directly applicable to explain the relationship between the extracellular field potentials generated by complex and distributed biosources (current generators) like the cardiac tissue, the muscles, and the brain and their electrical activities recorded on the body surface as ECG, electromyogram (EMG) and electroencephalogram (EEG) signals.
In summary, excitable cells and tissues (biosources), when adequately stimulated, generate monophasic action potentials. These action potentials cause the injection of constant currents into a large bathing medium surrounding the biosource (considered as a point current source). As a result of the current flow in the volume conductor with specific resistance, extracellular field potentials are generated in the medium. These field potentials are triphasic in shape, of shorter duration and smaller amplitude compared to the transmembrane action potential. As the resistivity of the medium increases and the radial distance from the biosource decreases, the field potential increases. These field potentials are recorded as clinically useful signals on the body surface.
The biopotentials most frequently measured and monitored in modern clinics and hospitals are electrocardiogram (ECG: a recording of the electrical activity of the heart), electromyogram (EMG: a recording of the electrical activity of the muscle), electroencephalogram (EEG: a recording of the electrical activity of the brain), and others. Based on the physiological concepts reviewed above, now we present a brief overview of the electrogenesis of the ECG signals that carry a wealth of information about the state of health and disease of the heart. Having done this, we look at basics of electrocardiography.
BASICS OF ELECTROCARDIOGRAPHY
The conduction system of the heart consists of the sinoatrial (SA) node, the internodal tracts, the atrioventricular
38 ELECTROCARDIOGRAPHY, COMPUTERS IN
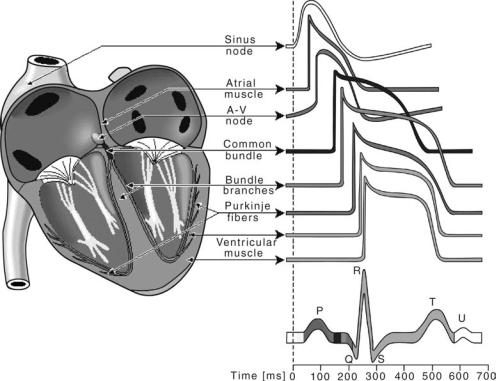
Figure 2. Wavesforms of action potentials in different specialized cells in the conductive pathway of a normal heart and their contribution with color coding to the surface ECG. (Courtesy of Ref. 2.)
(AV) node, the bundle of histidene (His), the right bundle branch (RBB), the left bundle branch (LBB), and the Purkinjie network. The rhythmic electrical activity of the heart (cardiac impulse) originates in the SA node. This node is known as the natural pacemaker of the heart, approximately the size of the tip of a pencil, located at the junction of the superior vena cava and the right atrium. The impulse then propagates through internodal and interatrial (Buchmans’s bundle) tracts. As a consequence, the pacemaker activity reaches the AV node by cell-to-cell atrial conduction and activates the right and left atrium in an organised manner. The pacemaker action potential has a fast activation phase, a very short steady recovery phase, followed by a fairly rapid recovery phase and a characteristic slow depolarization phase leading to self-excitation (Fig. 2). The pacemaker cells of the SA node act as a biological oscillator.
As atria and ventricles are separated by fibrous tissue, direct conduction of cardiac impulse from the atria to the ventricles can not occur and activation must follow a path that starts in the atrium at the AV node. The cardiac impulse is delayed in the AV node for 100 ms. It then proceeds through the bundle of His, the RBB, the LBB, and finally to the terminal Purkinjie fibers that arborize and invaginate the endocardial ventricular tissue. The delay in the AV node is beneficial since electrical activation of cardiac muscle initiates its successive mechanical contraction. This delay allows enough time for completion of atrial contraction and pumping of blood into the ventricles. Once the cardiac impulse reaches the bundle of His, conduction
is very rapid, resulting in the initiation of ventricular activation over a wide range. The subsequent cell-to-cell propagation of electrical activity is highly sequenced and coordinated resulting in a highly synchronous and efficient pumping action by the ventricles.
Essentially, an overall understanding of the genesis of the ECG waveform (cardiac field potentials recorded on the body surface) can be based on a cardiac current dipole model placed in an infinite (extensive) volume conductor. In this model, an active (depolarizing) region of the tissue is considered electronegative with respect to an inactive (repolarizing) region. Therefore, a boundary or separation exists between negative and positive charges. This is regarded as a current dipole: a current source and sink separated by a distance. According to the dipole concept, a traveling excitation region can be considered as a dipole moving with its positive pole facing the direction of propagation. Thus a nearby recording electrode placed in the surrounding volume conductor (referenced to an indifferent electrode placed in a region of zero potential) will detect a positive-going field potential as excitation approaches and a negative-going field potential as it passes away. Repolarization (recovery) is considered as a dipole with its negative pole facing the direction of propagation. Therefore, the propagation of excitation can be considered as the advance of an array of positive charges with negative charges trailing and the recovery could be considered as the approach of negative charges with positive ones trailing. Consequently, an upward deflection in the biopotential recording indicates the approaching of excitation
ELECTROCARDIOGRAPHY, COMPUTERS IN |
39 |
(depolarization) toward the positive (recording) electrode and a downward deflection indicates a recovery (depolarization) in the recorded signal.
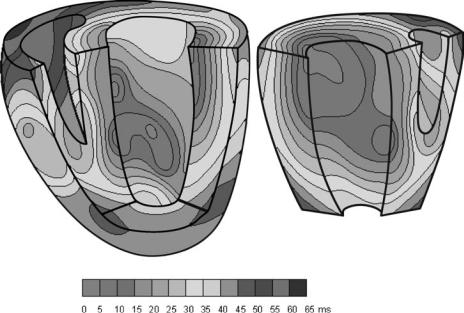
As the wave of excitation (depolarization) spreads throughout the conductive pathways and tissues, specific excitation regions called isochrones are synchronously excited. In the ventricles, these synchronous activation regions propagate in a temporally and spatially orderly fashion from the endocardial to the epicardial direction (Fig. 3.)
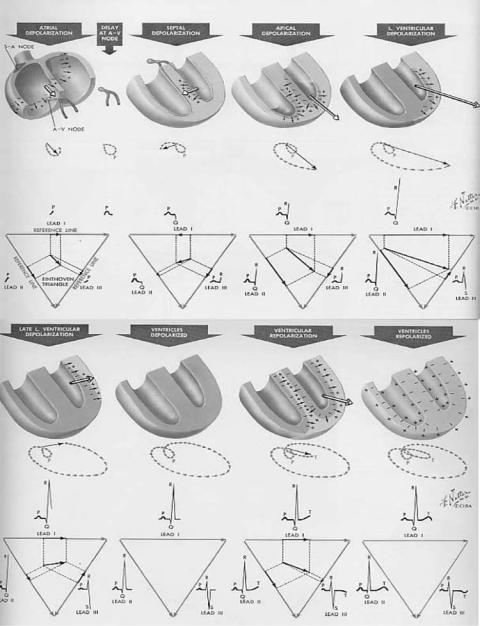
In a localized region of the heart many cells are simultaneously activated because of the high electrical and mechanical coupling (functional syncytium) between the myocardial cells. Each activation region can be viewed as an elementary dipole, and all elementary dipoles could be vectorially added to all others to form a single net dipole. (For more details on simple and multiple dipole models see the section Electrocardiography.) Therefore, at each instant of time, the total cardiac activity can be represented by a net equivalent dipole current source. The electric field produced by this dipole source represents the total electrical activity of the heart and is recorded at the body surface as the ECG signal (Fig. 4). (For quantitative details see chapter 6 in Ref. 2.)
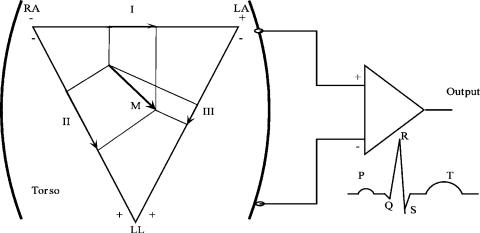
In the early 1900, Einthoven postulated that the cardiac excitation could be viewed as a vector. He drew an equilateral triangle with two vertices at two shoulders and one at the navel (representing the left leg). With the cardiac vector representing the spread of cardiac excitation inside the triangle, the potential difference measured between two vertices of the triangle (known as the limb leads) with respect to right leg, is proportional to the projection of the vector on each side of the triangle (Fig. 5).
In summary, based on the aforementioned concepts, electrocardiographers have developed an oversimplified model to explain the electrical activity of the heart. In this model, the heart is considered as an electric dipole (points of equal positive and negative charges separated from one
Figure 3. Isochrone surfaces in ventricular activation color coded to show spatiotemporal propagation. (Courtesy of Ref. 2.)
another by a distance), denoted by a spatiotemporally changing dipole moment vector M. This dipole moment (amount of charge times distance between positive and negative charges) is called the cardiac vector. As the wave of depolarization spreads throughout the cardiac cycle, the magnitude and orientation of the cardiac vector changes and the resulting bioelectric potentials appear throughout the body and on its surface. The potential differences (ECG signals) are measured by placing electrodes on the body surface and connected to biopotential amplifier. (For details, see the section Bioelectrodes, and Electrocardiographic Monitors.) In making these potential measurements, the amplifier has a very high input impedance to minimally disturb the cardiac electric field that produces the ECG signal. As it was discussed before, when the depolarization wavefront points toward the recording positive electrode (connected to the þ input terminal of the bioamplifier), the output ECG signal will be positive going, and when it points toward the negative electrode, the ECG signal will be negative going. The time varying cardiac vector produces the surface ECG signal with its characteristics P wave, QRS complex, and T wave during the cardiac cycle. These field potentials are measured by using bioelectrodes and biopotential amplifiers to record the ECG tracings.
BASIC INSTRUMENTATION TO RECORD ECG SIGNALS
As the electrical events in the normal heart precede its mechanical function, ECG signals are of great clinical value in diagnosis and monitoring of a wide variety of cardiac abnormalities including myocardial infarction and chamber enlargements. Therefore, ECG signal acquisition systems are widely used in cardiology, cardiac catheterization laboratories, intensive and cardiac care units, and at patient’s bedside, among other areas.
As it was described earlier, the electrical activity of the heart can be best modeled and characterized by vector quantities. However, it is easier to measure scalar
40 ELECTROCARDIOGRAPHY, COMPUTERS IN
Figure 4. The total cardiac electrical activity represented by the net dipole (cardiac vector) during different phases of the cardiac cycle and its projection along the frontal plane electrocardiographic leads (I, II, and III). (Courtesy of Ref. 3.)
quantities, such as potential differences between specified points on the torso known as surface ECGs. These ECG signals have a diagnostically significant frequency content between 0.05 and 150 Hz. To ensure stability of the baseline, a good low frequency response is required. The instabilities in the baseline recordings originate from changes in the electrode–electrolyte interface at the point of contact of the bioelectrode with the skin. (For details see the section Bioelectrodes.) To faithfully record fast changes in the ECG signals and distinguish between other interfering signals of biological origin, adequate high frequency response is necessary. This upper frequency value is a compromise between several factors including limitation of mechanical recording parts of ECG machines using direct writing chart recorders.
To amplify the ECG signals and reject nonbiological (e.g., powerline noise) as well as biological interferences (e.g., EMG), differential amplifiers (DAs) with high gains (typically 1000 or 60 dB) and excellent common mode rejection capabilities must be used. Typically, common mode rejection ratios (CMMRs) in the range of 80– 120 dB with 5 KV imbalance between differential amplifier input leads provide a desirable level of environmental and biological noise and artifact rejection in ECG acquisition systems. In addition to this, in very noisy environments it becomes necessary to engage a notch (band-reject) filter centered at 60 Hz or 50 Hz (in some countries) to reduce powerline noise further. A good review of adaptive filtering method applied to ECG powerline noise removal is given in Adaptive Filter Theory by Simon Haykin (4).
Many modern biomedical instruments use instrumentation amplifiers (IAs). These amplifiers are advanced versions of differential amplifiers enhanced with many additional desirable characteristics such as very high input impedance > 100 MV) to prevent loading the small ECG signals to be picked up from the skin. The final stages of the ECG amplifier module limit the system’s response (band pass filtering) to the desirable range of frequencies for diagnostic (i.e., 0.05–150 Hz) or monitoring (i.e., 0.5– 40 Hz) purposes. A more limited bandwidth in the monitoring mode provides improved signal to noise ratio and removes ECG baseline drift due to half-cell potentials generated at the electrode/electrolyte interface and motion artifacts. Driven right-leg amplifiers improve the CMRR. The amplified and adequately filtered ECG signals are then applied to display, recording or digitization modules of a computer-based ECG acquisition system. Detailed specifications for diagnostic ECGs have been developed by the American National Standards Institute (5). For more detailed specification and design as well as other aspects of ECG instrumentation and measurements, see the Appendix, Bioelectrodes, Electrocardiography, and Electrocardiographic Monitors.
COMPUTER SYSTEMS IN ELECTROCARDIOGRAPHY
Diagnostic Computer-Based ECG Systems
Heart diseases cause a significant mortality rate in the world. Accurate diagnosis of heart abnormalities at an early stage could be the best way to save patients from disability or death. The ECG signal has considerable diagnostic value and ECG monitoring is a very well established and commonly used clinical method. Diagnostic ECG testing is performed in a doctor’s office, in a clinic or hospital as a routine check up. In this test, a full 12-lead ECG (to be described later) is acquired from a resting subject and displayed on a chart recorder or a computer screen to diagnose cardiac diseases. In cardiac care units (CCUs), a patient’s single lead ECG may be continuously acquired and displayed on a cathode ray tube (CRT) or a computer screen for signs of cardiac beat abnormalities. The ECG
ELECTROCARDIOGRAPHY, COMPUTERS IN |
41 |
Figure 5. Einthoven equilateral triangle. The vertices are LA (left arm), RA (right arm), and LL (left leg). The RL (right leg) is used as a reference for potential difference measurements and is not shown. I, II and III represent electrocardiographic frontal limb leads. The þ and – represent connection to the terminals of an ECG (biopotential) amplifier. Lead I is the potential difference between LA and RA. Lead II is the potential difference between LL and RA. Lead III is the potential difference between LL and LA. (The input polarity of the amplifier shown is for recording: III limb.)
monitoring capabilities are now an integral part of a number of other medical devises, such as cardiotachometers, Holter monitors, cardiac pacemakers, and automatic defibrillators.
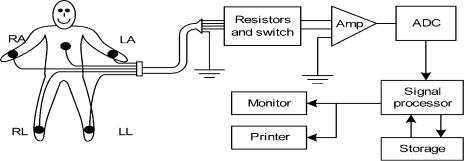
Most of the traditional clinical ECG machines used a single channel amplifier and recording system. The recoding was achieved using a direct writing chart recorder. In modern systems, however, computer memory, display screen and printing capabilities are deployed to record, display and report the ECG data. Traditional single channel systems used a multiposition switch to select the desired lead connection (I, II, III, aVR, aVL, aVF, V1, V2, V3, V4, V5, and V6) and apply it to the biopotential amplifier and chart recorder. Only one ECG lead at a time could be selected and recorded with these machines. The block diagram of a modern single channel computer-based ECG acquisition system is shown in Fig. 6.
Most of the modern ECG machines are multichannel systems. They include several amplifier channels and record several ECG leads simultaneously. This feature enables them to considerably reduce the time required to complete a set of standard clinical ECG recordings. As the ECG leads are recorded simultaneously, they can be shown in their proper temporal relationship with respect to each other. These systems use microprocessors to acquire the cardiac signals from the standard 12-lead configuration by sequencing the lead selector to capture four groups of three lead signals, and switch groups every few seconds. The high end computer-based systems capture all 12-leads simultaneously and are capable of real-time acquisition and display of the standard 12-lead clinical ECG signals (see Example below.)
Modern ECG acquisition systems achieve certain desirable features, such as removal of artifacts, baseline wander, and centering of the ECG tracings by using specialized computer algorithms. These systems perform automatic self-testing on power up and check for lead continuity and polarity and indicate lead fall-off or reversal. They deploy digital filters implemented in software to considerably improve the ECG signal quality and automatically remove baseline drift and reduce excessive powerline and biological noise. Powerful software programs not only minimize
42 ELECTROCARDIOGRAPHY, COMPUTERS IN
Figure 6. Block diagram of a threelead electrocardiograph. The normal locations for surface electrodes are right arm (RA), right leg (RL ¼ ground or reference), left arm (LA), and left leg (LL). In 12-lead electrocardiographs, six electrodes are attached on the chest of the patient as well. (Courtesy of Ref. 6.)
baseline drift without signal distortion during rest, they also produce high quality ECG tracings during patient monitoring, exercise and ambulation.
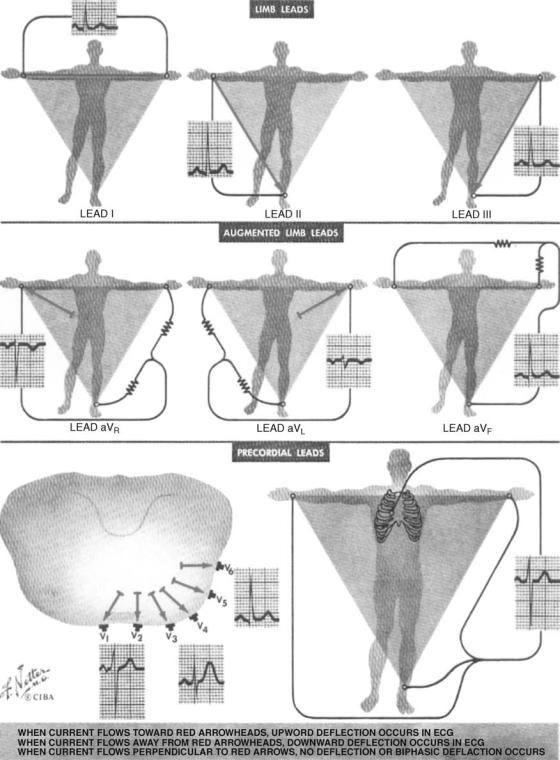
12-Lead Clinical Electrocardiography. The most commonly used or standard clinical ECG system is the 12-lead system. This system is comprised of three bipolar limb leads (I, II, III) connected to the arms and legs; three augmented leads (aVR, aVL, aVF); and six unipolar chest or precordial leads (V1, V2, V3, V4, V5, V6).
The connections to measurement points in the 12-lead system are shown in Fig. 7. Six of these 12 leads are frontal leads (the bipolar and the augmented leads) and six of them are transverse leads (the precordial leads). The frontal leads are derived from three measurement points RA, LA, LL with reference to RL. Therefore, any two of these six leads contain exactly the same information as the other four. The dipole source model can be used to explain the total electrical behaviour of the heart (See the section Electrocardiography and Ref. 2.)
Basically, any two of the three I, II, and III leads could represent the cardiac activity in the frontal plane and only one chest lead could be used to represent the transverse activity. Chest lead V2 is a good representative of electrical activity in the transverse plane as it is approximately orthogonal (perpendicular) to the frontal plane. Overall, as the cardiac electrical activity could be modeled as a dipole, the 12-lead system could be considered to have three independent leads and nine redundant leads. However, since the chest leads also detect unipolar elements of the cardiac activity directed toward the anterior region of the heart, they carry significant diagnostic value in the transverse plane. As such, the 12-lead ECG system can be considered to have eight independent and four redundant leads. Now the question arises why all the 12-leads are recorded then. The main reason is that the 12-lead system enhances pattern recognition and allows cardiologists to compare the projections of the resultant vectors in the two orthogonal planes and at different angles. This facilitates and validates the diagnostic process. Figure 8 shows the surface anatomical positions for the placement of the bioelectrodes in 12-lead electrocardiography.
A Detailed Example: The Philips PageWriter Touch 12-Lead ECG System. Currently, there are a number of highly advanced 12-Lead ECG data acquisition, analysis and interpretative systems on the market. A detailed description and comparison of all these systems are beyond the scope of this chapter (for information on these systems see
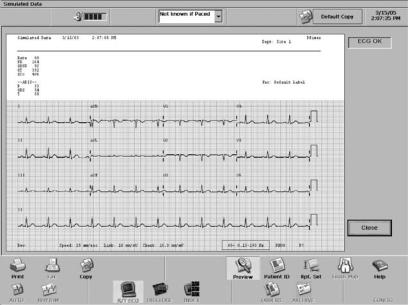
manufacturers web sites). Due to space limitation, only one representative system will be described in detail as an example. The Philips PageWriter Touch (Philips Medical, MA) is an advanced 12-lead ECG acquisition and analysis system with many user-friendly features. It has a compact design and is best suited for busy hospitals and fast-paced clinical environments. It has an intuitive touch screen which is fully configurable and it has a powerful build-in interpretative 12-lead ECG signal analysis algorithm developed for rapid and accurate interpretation of ECG signals (Fig. 9).
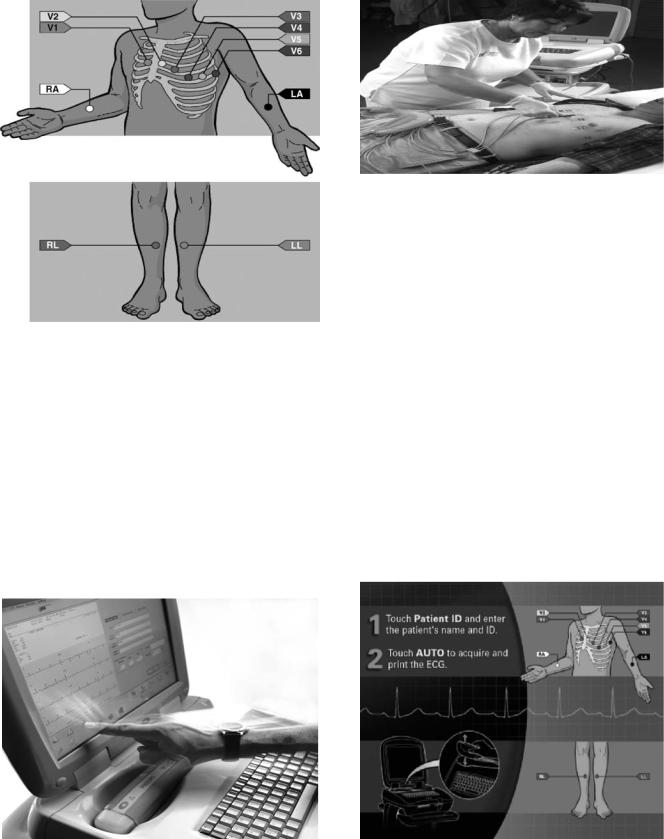
The PageWriter supports a variety of ECG data acquisition modes, display settings and reporting schemes. It provides real-time color-coded ECG signals enabling the user to perform quality control checks on the acquired ECG data. Quality control features include surface anatomical diagrams that alert the user to the location of loose or inoperable electrodes (Fig. 8). It is equipped with a fullscreen preview display of the ECG report before print out. It has an ergonomic design that facilitates ECG data collection from the patient bedside (Fig. 10).
The PageWriter Touch has an alphanumeric keyboard, an optional barcode scanner, and an optional magnetic card reader to increase the speed and accuracy of patient data entry and management. Data handling features include indexed ECG storage and quick transmission of stored ECG data to an ECG data management system. By using indexed thumbnail images of each ECG report the user can instantly view and print the stored reports. Multiple reporting formats may be applied to any saved ECG records.
In brief, the PageWriter Touch features accurate and fast 12-lead ECG signal acquisition and analysis capabilities for both adults and children patients. It has real-time colorcoded display facilities and provides instantaneous snapshots of stored ECG data on the touch screen. It has a variety of ECG data review and printing capabilities. The touch screen provides easy and flexible configurability of features (Fig. 11). (For more details on Technical Specifications of PageWriter Touch see the Appendix.)
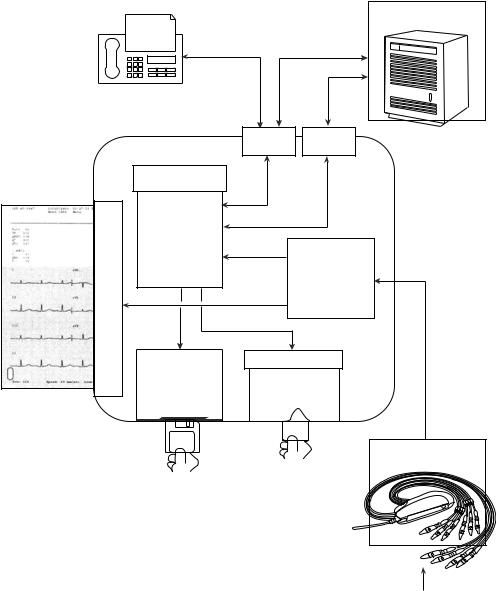
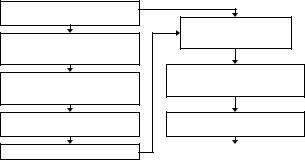
Overview of System Description. The PageWriter Touch electrocardiograph performs acquisition, analysis, presentation, printing, storage, and transfer of ECG signals as well as other patient data. A generalized block diagram of the system is shown in Fig. 12.
The system is comprised of three major subsystems equipped with an LCD display and touch screen module. A brief and high level description of these subsystems is as follows.
ELECTROCARDIOGRAPHY, COMPUTERS IN |
43 |
Figure 7. Lead connections in standard 12-lead electrocardiography. (Courtesy of Ref. 3.)
1. Main Controller Board. This is a single board computer (SBC) with extensive Input–Output facilities, running Windows CE 3.0. The PageWriter application software controlling the overall operation of the electrocardiograph runs on the Main Controller
Board, which includes the display and user-input subsystems. The application software interacts with numerous hardware and software subsystems. The Main Controller Board SBC contains loader software and Windows CE kernel image in its
44 ELECTROCARDIOGRAPHY, COMPUTERS IN
Figure 8. Surface anatomical positions for application of bioelectrodes in the 12-lead ECG system. (Courtesy of Philips Medical Systems, USA.) (Illustration courtesy of Mark Wing, Illustrator.)
internal flash memory (32 MB). At system boot, a system RAM test is performed by the loader (64 MB RAM onboard). The Windows CE kernel loads next. After loading of the CE, the application launcher runs, verifying system and executable images before loading the SierraGUI (Graphical User Interface) application. All interactions with the system operator (user) are implemented through the SierraGUI application. The application software and all ECG archives are stored on a separate 128 MB CompactFlash (CF) card installed on the Main Controller Board (Fig. 12.)
Figure 10. Easy data collection set up at bedside. (Courtesy of Philips Medical Systems, USA.)
2. Printer Controller Board. This is a controller board that provides all the real-time management of the printer. The Printer Controller Board communicates with the Main Controller Board through a USB port. The Printer Controller Board is a micro- processor-based control board for the electrocardiograph thermal printer mechanism. This board is connected by a USB port to the Main Controller Board and is powered by the power circuit of the
Main Controller |
Board. It provides ECG waveform |
rendering and |
basic bitmap imaging operations, |
and uses a PCL-like control language API for page description and feed control. It controls the print head, motor, and detects drawer-open and top-of- form.
3. Patient Input Module (PIM). This is a controller running Windows CE 3.0, coupled with a signal acquisition board employing mixed-signal Application Specific Integrated Circuit (ASIC) technology developed for ECG data acquisition. The PIM communicates with the Main Controller Board through a USB port (Fig. 12.)
Figure 9. PageWriter Touch, a high-end 12-lead electrocardiograph with built-in 12-lead ECG signal interpretation capabilities. (Courtesy of Philips Medical Systems, USA.)
Figure 11. PageWriter Touch electrocardiograph has a userfriendly interface. (Courtesy of Philips Medical Systems, USA.) (Illustration courtesy of Mark Wing, Illustrator.)
ELECTROCARDIOGRAPHY, COMPUTERS IN |
45 |
ONBOARD FLASH 4MB
WinCE 3.0 Kernel Boot Leader
|
|
|
|
|
|
PATIENT |
|
|
|
|
MODEM PC CARD |
INTERFACE |
|||
|
|
|
MODULE (PIM) |
||||
|
|
|
|
FLASH OR |
|||
|
|
|
|
SA1110 16MB RAM |
|||
|
|
|
|
WIRELESS NIC |
|||
|
|
|
|
|
|
||
|
|
|
|
PCMCIA |
|
|
|
|
COTROLLER BOARD |
SLOT |
|
|
|
||
|
|
|
|
|
|||
|
SA1110/1111 64MB RAM |
|
|
|
|
||
MAGNETIC |
|
|
|
|
USB |
|
INTERNAL |
CARD |
|
|
|
|
|
||
READER |
|
|
ONBOARD FLASH |
|
0 |
|
FLOPPY DRIVE |
|
|
|
|
|
|||
|
|
|
32MB |
|
|
|
|
|
RS232 |
|
|
|
USB |
|
|
|
0 |
|
WinCE 3.0 kernel |
|
1 |
|
|
|
|
|
ADS Startup Files |
|
|
|
|
INTERNAL |
RS232 |
|
|
|
USB |
|
|
DEBUG PORT |
1 |
|
COMPACT FLASH |
|
2 |
|
|
|
|
|
|
|
|
|
|
EXTERNAL |
|
|
128MB |
EPROM |
|
|
|
RS232 |
(non-user removable) |
USB |
|
EXTERNAL |
|||
DB9 |
2 |
|
|
128K |
3 |
|
(SPARE) |
|
|
|
Application Files |
Boot Leader |
|
|
|
EXTERNAL |
|
|
ECG Data Storage |
|
|
||
ANALOG |
|
|
ETHERNET EXTERNAL |
||||
|
Non-volatile Config. |
|
|||||
PHONO JACK |
ECG SYNC |
|
|
10/100 |
RJ45 |
||
|
|
|
|||||
|
DISPLAY |
BATTERY |
PS/2 |
PS/2 |
|
|
|
|
1/0 |
|
1/0 |
0 |
1 |
|
|
XGA 16 BIT COLOR |
|
|
|
|
|
|
|
ACTIVE MATRIX |
|
|
|
|
|
|
|
LCD DISPLAY |
|
|
|
|
|
|
PRINTER CONTROLLER |
|
|
|
|
|
|
|
|
|
|
|
|
|
|
|
MCF5272 8MB RAM |
TOUCH SCREEN |
|
|
|
|
|
|
ONBOARD |
|
|
|
|
|
BARCODE |
|
FLASH512K |
|
|
|
|
|
READER |
|
MONITOR/OS |
|
|
|
|
|
|
|
Boot Leader |
LITHIUM ION BATTERIES (2) |
KEYBOARD |
THERMAL PRINTER |
Figure 12. A generalized block diagram for PageWriter Touch. (Courtesy Philips Medical Systems, USA.)
The LCD display module for the PageWriter Touch electrocardiograph is an extended graphic array or XGA-compatible, full-color with backlight and overlaid touch screen (Fig. 9.) It is driven by the Main Controller Board using a graphics accelerator chip and dedicated touch screen support hardware. The touch screen provides finger-tap input substituting for the normal Win32 mouseclick input.
ECG Data Flow and Storage in PageWriter Touch. The ECG data flow and storage in the PageWriter Touch electrocardiograph is shown in Fig. 13.
The ECG signals are picked up at the body surface using electrodes attached to properly prepared skin at specified anatomical sites. The ECG data stream is then routed in real-time to the Main Controller Board, where it is written into the application buffers in RAM. These buffers are used to present the ECG data stream on the LCD screen in realtime. When the user initiates an AUTO report print, presses the ACTION button on the Patient Input Module or the Snapshot button on the display, or uses the Timed ECG acquisition, the corresponding 10 s segments of the ECG data are then copied to the temporary ECG storage in RAM. These 10 s segments are named ECG reports that
46 ELECTROCARDIOGRAPHY, COMPUTERS IN
|
FAX RENDERED |
|
ECG |
|
||
|
ECG REPORT |
|
DATA |
|
||
|
FAX |
|
(XML) |
ECG |
||
|
|
|
|
|||
|
|
|
|
|
DATA |
|
|
|
|
|
|
(XML) |
|
|
|
FAX/ |
ETHERNET |
|||
Page Writer Touch |
MODEM |
|||||
|
|
|||||
|
|
|
|
|||
|
CF SOCKET |
|
|
|
|
|
RENDERED ECG |
(non-user accessible) |
|
|
|
|
|
|
|
|
|
|
||
REPORT PRINT |
|
|
|
|
|
|
|
INTERNAL MAIN |
|
|
|
|
|
|
ARCHIVE & REMOTE |
|
|
|
|
|
PRINTER |
RETRIEVED ARCHIVE |
|
|
|
|
|
(128 MB) |
ECG DATA |
|
BUFFERS & |
|||
|
INTERNAL |
|
|
APPLICATION |
||
|
COMPACT FLASH |
|
|
|||
|
|
|
|
|
||
THERMAL |
|
(XML) |
|
TEMPORARY |
||
|
|
|
ECG STORAGE |
|||
|
|
|
|
|||
|
|
|
|
MEMORY (RAM) |
||
INTERNAL |
3.5 IN. FLOPPY |
PC CARD SOCKET |
|
|||
|
|
|||||
|
|
|
|
|
||
|
DISK DRIVE |
EXTERNAL PC CARD |
||||
|
(1.44 MB DOS |
(PCMIA) FLASH CARD |
||||
|
FORMATTED DISKS) |
|
(128 MB) |
|
||
EXTERNAL
REMOTE ARCHIVE
TRACEMASTER ECG MANAGMENT SYSTEM
ECG
SIGNAL
DATA
PATIENT INTERFACE
MODULE (PIM)
EXTERNAL FLOPPY
EXTERNAL
ARCHIVE
PC CARD
ECG DATA (XML)
ARCHIVE
ECG DATA (XML)
PATIENT SIGNAL DATA
Figure 13. The ECG data flow and storage in PageWriter Touch electrocardiograph. (Courtesy of Philips Medical systems, USA.)
can be previewed and printed. In AUTO mode, the ECG report may be automatically printed after copying to storage. An ECG report contains waveforms, analysis information, patient demographics, and acquisition information, along with operator and device information. Figure 14 shows a rendered ECG report print sample.
The PageWriter Touch 12-Lead ECG Data Analysis Program. This program analyzes up to 12 simultaneously acquired ECG waveforms over a 10 s period using interpretive criteria by patient-specific information. For examples of ECG diagnostic criteria see Ref. (7). The analysis algorithm analyzes ECG data and produces an interpretive report to assist the clinician make more informed patient
assessment in a broad range of clinical settings. The analysis program is developed to allow clinicians read and interpret ECG findings more quickly and efficiently, provide accurate, validated ECG measurements to facilitate physician overreading and improve treatment decision making, generate detailed findings that highlight areas of interest for physicians review, provide high levels of reproducibility for more consistent ECG interpretation.
The algorithm monitors the quality of the ECG waveforms acquired from 10 electrodes (12 leads), recognizes patterns, and performs basic rhythm analysis. Using advanced digital signal processing techniques, the algorithm removes biological and non-biological noise and artifacts while minimizing distortion of the ECG waveforms
ELECTROCARDIOGRAPHY, COMPUTERS IN |
47 |
and preserving their diagnostic quality. By using a set of diagnostic criteria, the 12-lead ECG analysis program generates interpretative statements, summarizes the findings for the ECG signals, and highlights key areas of concern for physician review. The analysis program has a built-in pacemaker pulse detector and paced rhythm classification routine. The program distinguishes a variety of atrial, ventricular and atrioventricular (AV) sequential pacing modes to recognize asynchronous pacing typically seen with a magnet in place. In addition to automated detection capabilities, the algorithm provides user selected configuration of ‘‘pacemaker patient’’ or ‘‘non-pacemaker patient’’ for more accurate analysis.
The 12-lead analysis program also incorporates factors, such as age and gender that impact a patient’s risk for developing specific forms of cardiac disease. It uses genderspecific interpretation criteria to take into account key physiological differences between males and females. For example, it applies gender-specific evaluation of Q waves for improved detection of Acute Myocardial Infarction (AMI), which is often missed in female patients. It also uses more gender-specific criteria for detection of axis deviation, Left Ventricular Hypertrophy (LVH), and prolonged QT segment.
The 12-lead algorithm also includes an advanced Pediatric Criteria Program, which uses age to select clinically relevant interpretative statements related to cardiac rhythm and morphology. If a patient’s age is < 16 years, the algorithm automatically uses pediatric ECG interpretation criteria, which accounts for higher rates and narrower QRS complexes in this patient population. The Pediatric Criteria Program recognizes 12 distinct age groups to ensure most relevant-age interpretation criteria are applied for analyzing the ECG data. In fact, patient age is used to define normal limits in heart rate, axis deviation, ECG segment time intervals, voltage values for interpretation accuracy in tachycardia, bradycardia, prolongation or shortening of PR and QT intervals, hypertrophy, early
Figure 14. A 12-lead ECG report sample for printing or copying. (Courtesy of Philips Medical systems, USA.)
repolarization, myocardial ischemia and infarct, as well as other cardiac conditions. The pacemaker detection and classification algorithm built into the Pediatric Analysis Program has the ability to reliably distinguish pacemaker pulses from the very narrow QRS complexes often produced by neonatal and pediatric patients. It also reduces the likelihood of false diagnosis in non-paced patients, while enabling more accurate paced rhythm analysis for the pediatric age group.
To improve on the classification accuracy of a diagnostic dilemma in pediatrics to distinguish between mild Right Ventricular Hypertrophy (RVH) and Incomplete Right Bundle Branch Block (IRBBB), the algorithm combines 12-lead synthesized vectorcardiogram transverse plane measurements with scalar ECG measurements. In addition, the pediatric analysis program provides improved QT measurements in pediatric patients.
The ST segment elevation in ECG tracings is an effective indicator of acute myocardial infraction. The PageWriter Touch 12-Lead ECG Analysis Program provides advanced software for detection of ST Elevation Acute Myocardial Infarction (STEMI). This software feature provides clinicians with a valuable decision support tool when working with patients presenting symptoms that suggest accurate coronary syndromes.
Other cardiac conditions, such as benign early repolarization and acute pericarditis, tend to mimic the ECG diagnosis of STEMI, and degrade algorithm detection accuracy. To address this difficulty, the ECG Analysis Program separates the confounders by examining the patterns of ST elevation. Improved measurements in ST deviation enables the algorithm to achieve both high sensitivity and specificity in more accurate detection of STEMI condition.
Exercise (Stress) Electrocardiography. Exercise (Stress or Treadmill) electrocardiography is a valuable diagnostic and screening procedure primarily used to diagnose
48 ELECTROCARDIOGRAPHY, COMPUTERS IN
coronary artery disease (CAD). Exercise on treadmill may induce ischemia that is not present at rest. Exercise electrocardiography is usually performed to screen for the presence of undiagnosed CAD, to evaluate an individual with chest pain, to clarify abnormalities found on a resting ECG test, and to assess the severity of known CAD.
Accurate interpretation of stress ECG is dependent on a number of factors including a detailed knowledge of any prior medical condition, presence of chest pain and other coronary risk factors. A modern exercise ECG system includes a 12-lead ECG diagnostic system with accurate and advanced ECG signal processing capabilities. It also includes appropriate interfaces for treadmills, ergometers as well as motion-tolerant noninvasive blood pressure (NIBP) monitors.
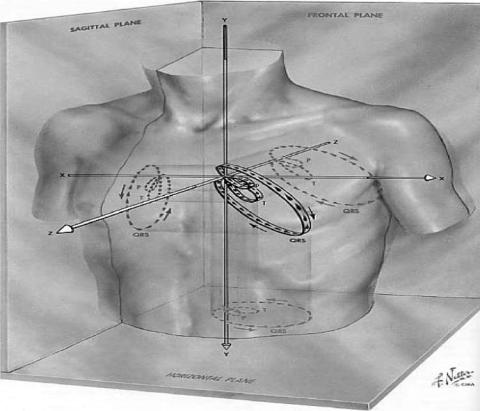
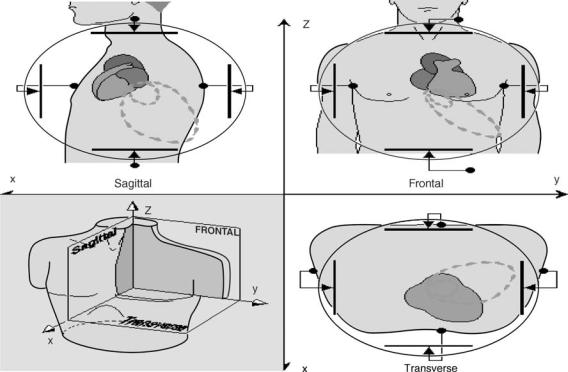
Vectorcardiography. In 12-lead clinical electrocardiography described above, the scalar ECG signals are recorded from 10 electrodes placed on specific sites on the body surface. These tracings show detailed projections of the cardiac vector as a function of time. However, they do not show the underlying cardiac vector. Vectorcardiography is a method in which the cardiac electrical activity along three orthogonal axes (x, y, z) in the principal planes (frontal, transverse, sagittal) are recorded and the activity of any two of the three is displayed on a CRT. This display is a closed loop showing the locus of the tip of the cardiac vector during the evolution of atrioventricular depolarization–repolarization phases in one cardiac cycle (Fig. 4.) These closed loops are known as vectorcardiogram
(VCG). Figure 15 shows the 3D representation of the cardiac electrical activity and its projections onto the principal planes recorded as vectorcardiogram. Figure 16 shows the basic principles of vectorcardiography and the VCG.
In contrast to ECG tracings that show the detailed morphology of the electrical activity of the heart in any one single lead direction, the VCG is the simultaneous plot of the same electrical events in two perpendicular (orthogonal) lead directions. This gives a detailed representation of the cardiac vector and produces loop-type patterns on the CRT. The magnitude and orientation of the P, QRS, and T loops are then determined from the VCG. The VCG plots provide a clear indication of the cardiac axis and its deviation from normal. Each VCG exhibits three loops, showing the vector orientation of the P waves, the QRS complex and the T wave during the cardiac cycle. The high amplitude of the QRS complex loop predominates the VCG recordings and sensitivity adjustments need to be made to adequately display the loops resulting from the P and T waves.
The VCG is superior to the clinical 12-lead scalar ECG in recognition of undetected atrial and ventricular hypertrophy and some cases of myocardial infarction and the capability to diagnose multiple infarctions in the presence of bundle branch blocks. For example, in most infarcts the cardiac vector orientation moves away from the area of infarction. The advantage of VCG is that it only requires three orthogonal leads to provide full information on cardiac electrical activity. This translates into simpler algorithms and less computation. However, the full 12-lead
Figure 15. The three-dimensional (3D) representation of the evolution of the cardiac vector for P, QRS, and T loops during one cardiac cycle and their projections onto the three principal planes. (Courtesy of Ref. 3.)
ELECTROCARDIOGRAPHY, COMPUTERS IN |
49 |
Figure 16. Vectorcardiography based on mutually orthogonal uniform lead fields set up by parallel electrode arrangements on opposite sides of the torso in three principal planes. (Courtesy of Ref. 2.)
scalar ECG provides detailed time plots of the ECG signals and highlights the changes in waveform morphology. Decades of clinical experience has made the 12-lead electrocardiography the standard method of practice in diagnosis of heart disease and favors that method over vecorcardiography. For a comprehensive and detailed description of Vectorcardiography see Refs. 2 and 8.
High Resolution Electrocardiography (Body Surface Potential Mapping). The electrical activity of the heart triggering its pumping action is a spatiotemporally distributed process. As discussed above, electrocardiography provides temporal information on timing of cardiac cycle. It can provide information on chamber enlargement and is an established tool for diagnosis of cardiac arrhythmias. Exercise testing using 12-lead clinical electrocardiography is the most common means of clinical investigation in evaluation of patients with chest pain. Even though clinical 12-lead ECG provides excellent temporal resolution in assisting clinical diagnosis of heart disease, it is limited in providing spatial information on the evolution of the electrical activity during the cardiac cycle.
The 12-lead ECG is now a standard diagnostic tool in clinical practice, but it is limited in detecting some cardiac abnormalities due to it sparse spatial sampling of the cardiac vector. Cardiac electrical imaging or enhanced electrocardiography alleviates this limitation by acquiring more information through deployment of a larger array (hundreds) of electrodes installed in a jacket to record more spatial samples of cardiac electrical activity.
As discussed in the sections above, the heart is a spatially and temporally distributed biosource embedded in an irregularly shaped volume conductor with conductivity inhomogenities. In standard electrocardiography one can measure heart rate and detect arrhythmias, determine the location of cardiac ischemia and infarction, localize some sites of conduction disorders between atria and ventricles or areas of transient ischemia or even detect chamber hypertrophy or congenital heart defect. However, standard ECG is specifically limited in the following: accurate detection of events in the non-anterior regions of the heart, underestimation of the deflections of the ST segment during ischemia if they are weak or nonexistent on the regions of the torso sampled by the ECG leads, inaccuracy of ECG amplitudes in reflecting the extend of physiological alterations due to the spatial integration effects of many simultaneous events, some of which partially cancel so that small defects can result in large changes in the ECG signal or vice versa.
Simply stated, standard ECG is limited in spatial resolution as it is used to describe the complex cardiac fields generated by the electrical activity of a spatiotemporally distributed biosource like the heart. Therefore, the need for enhanced resolution electrocardiography exists. Recent developments in cardiac imaging techniques have been largely driven by this need. A number of active research centers around the world are dedicated to the development of this technology (9–12). As with other imaging methods used in medicine, recent developments in cardiac electrical imaging have greatly benefited from better data

50 ELECTROCARDIOGRAPHY, COMPUTERS IN
Figure 17. Color-coded BSPMs and computed potential distributions at the surface of the heart during the peak of the QRS complex using 120 ECG electrodes. The surface on the right shows the computed potential distribution on the surface of the heart at the same instant. The relative size of the two surfaces is distorted but their orientations are aligned as in the geometric model used for the inverse calculation. The scaling and isopotential contours are local to teach surface. Scale bars on both sides indicate the voltage (in microvolt) to color mapping. (Courtesy of Dr. Robert MacLeod, Scientific and Imaging Institute, University of Utah, Ref. 9.)
acquisition capabilities and advancements in electronics and computer hardware and software capabilities. Figure 17 shows color-coded BSPMs and computed potential distributions at the surface of the heart during the peak of the QRS complex using 120 ECG electrodes as an example of how advanced computing methods can improve the spatial resolution of electrocardiography.
In summary, a popular modern approach to extend the capabilities of the standard 12-lead ECG system in mapping the electrical activity of the heart is high resolution electrocardiography or body surface potential mapping (BSPM). This approach attempts to provide spatial information by including a larger number of recording electrodes covering the entire torso. The BSPM facilitates the spatial visualization of the cardiac electrical activity. It has been shown that BSPM is superior to 12-lead electrocardiography in detection and localization of acute and remote myocardial infarction (MI). However, the full capability of BSPM to localize acute MI is as yet, not established.
Computers play a central role in fast acquisition and real-time processing of a large number of ECG signal channels, as well as in modeling and visualization of the electrical images of the heart and eventual construction of 3D animated representations of body surface potential maps. These topics are active areas of research and deserve separate chapters in their own right.
Computer-Based Monitoring ECG Systems
All modern diagnostic and monitoring ECG acquisition and analysis systems are equipped with state-of-the-art computer technology. ECG monitoring devices constitute an essential part of the patient monitoring systems. Patient monitoring systems are used to continuously or intermittently measure the vital signs (generally
ECG, heart rate, pulse rate, blood pressure, and temperature) and perform automatic analysis on them. Monitoring is carried out at the bedside, or a central station. Bedside monitors are now widely used in intensive care, cardiac care and operating rooms. Computer-based bedside monitors perform ECG analysis and generate alarms if life-threatening arrhythmias occur. The ECG monitoring systems can be networked to share common computing and analysis resources. Telecommunication technologies are now used to transmit ECG signals back and forth between computing facilities. For a detailed discussion of ECG-based monitoring systems see Ambulatory (Holter) Monitoring and Electrocardiographic Monitors.
Computer-Based Heart Beat Detection. Computer-based arrhythmia detectors that provide accurate detection of prevalent heart diseases could greatly help cardiologists in early and efficient diagnosis of cardiac diseases. Such devices now constitute an integral part of computer-based cardiac monitoring systems. The morphologic and rhythmic character of the ECG signal can be interpreted from its patterns, which normally have periodic waveforms such as PQRSTU-waves. Rhythmical patterns deviating from normal ECG (cardiac arrhythmias) have correlation with heart injuries or its malfunction in pumping the blood, such as premature beats, flutter and fibrillation patterns. The most serious pattern is ventricular fibrillation, which may be life threatening due to deficient supply of oxygen by the blood to the vital organs, including the heart itself. Considering other factors influencing the ECG patterns such as medications taken by patients, their physiological and psychological condition as well as their health records, an accurate diagnosis can be made based on cardiac arrhythmia classification.
Accurate determination of the QRS complex and more specifically, reliable detection of the R-wave peak plays a central role in computer-based ECG signal analysis, Holter data analysis and robust calculation of beat-to-beat heart rate variability (13). Fluctuations in the ECG signal baseline drift, motion artifact due to electrode movement and electromyographic (EMG) interference due to muscular activity frequently contaminate the ECG signal. In addition, morphological variations in the ECG waveform and the high degree of heterogeneity in the QRS complexes make it difficult to distinguish them from tall peaked P and T waves.
Many techniques have therefore been developed to improve the performance of QRS detection algorithms. These techniques are mainly based on band pass filtering, differentiation techniques, template matching and others. Recently, it has been shown that the first differential of the ECG signal and its Hilbert Transform can be used to effectively distinguish the R-waves from large, peaked T and P waves with a high degree of accuracy (14). Even though this method provides excellent R peak detection performance, it lacks automatic missing-R-peak correction capability and has not been tested on pediatric ECG data. Manual correction of missing R peaks in the ECG signal is time consuming and tedious and could play a critical role in error-free derivation of HRV signal. Figure 18 shows the block diagram for an Enhanced Hilbert Transform-based (EHT) method with automatic missing-R-peak correction capability for error-free detection of QRS complexes in the ECG signals.
In this algorithm, filtered ECG signals are differentiated first to reduce baseline drift and motion artifacts. This step sets the ECG peaks to zero. Hilbert Transform of the differentiated signal is then calculated and the conjugate of the Hilbert Transform is obtained. With this operation, the zero crossings in the differentiated signal becomes prominent peaks in the Hilbert transformed conjugate of the differentiated signal. A threshold is then selected based upon the normalized RMS value (as it gives a measure of the noise content in the signal) of the Hilbert transformed ECG signal. The time instants for which the signal amplitude is greater than the threshold value are stored in an array. Peak detection is performed on the original signal. The peak values and the time at which they occur are stored in separate arrays. The R–R intervals are
Filtered ECG signal
First order differentiation
Hilbert transform conjugate
Threshold selector
Peak ranges
Peak detection in ECG signal
Automatic missing-R-peak correction
R-peaks in ECG signals
QRS complexes
Figure 18. Block diagram for the Enhanced Hilbert Transformbased (EHT) QRS detection algorithm with automatic built-in missing R-peak correction capability. (Courtesy of Ref. 13.)
ELECTROCARDIOGRAPHY, COMPUTERS IN |
51 |
then calculated. If an R–R interval is >130% of the previous R–R interval, then the algorithm is considered to have missed an R-peak from the ECG signal. Hence a correction for the missing beat is made based upon an updated moving average of the previous R–R intervals. The amplitude of the missing peak is estimated as the average of the two previous R-peaks adjacent to it (13).
ECG Signal Telemonitoring
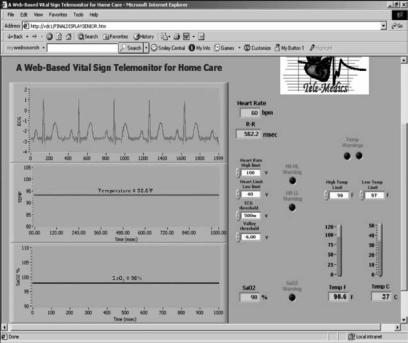
With advancements in bioinstrumentation, computer, and telecommunications technologies now it is feasible to design vital sign telemonitoring systems to acquire, record, display, and transmit physiological signals (e.g., ECG) from the human body to any location. At the same time, it has become more practical and convenient for medical and paramedical personnel to monitor vital signs from any computer connected to the Internet.
Telemonitoring can improve the quality, increase the efficiency, and expand access of the healthcare delivery system to the under-staffed, remote, hard-to-access, or under-privileged areas where there is a paucity of medical practitioners and facilities. It seems reasonable to envision that a telemonitoring facility could significantly impact areas where there are needs for uniform healthcare access such as under-served populations of rural areas, developing countries, space flights, remote military bases, combat zones, and security healthcare facilities. Mobile patient telemonitoring (i.e., emergency medicine), posthospital patient monitoring, home care monitoring, patient education and continuing medical education all will benefit from telemonitoring. Figure 19 shows the graphical user interface of a Web-based vital sign telemonitor accessed from a client site (15).
APPENDIX
The PageWriter Touch Technical Specifications. (Courtesy of Philips Medical Systems, USA.)
ECG Acquisition
R/T (real-time) ECG (12 leads)
AUTO (12 leads)
RHYTHM (up to 12 leads)
DISCLOSE (1–3 leads)
Keyboard
Full alphanumeric
Touch Screen Display
1024 768 pixel resolution
30.4 22.8 cm (15 in. diagonal) color liquid crystal touch screen display with backlight
Patient Module
Action button allows user to take ECG snapshots from the bedside
52 ELECTROCARDIOGRAPHY, COMPUTERS IN
Figure 19. The graphical user interface of a webbased telemonitor. (Courtesy of Ref. 15.)
Signal Processing/Acquisition
Sampling Rate
1000 samples per second per electrode/lead
12 bit A/D conversion provides 5 mV resolution
Auto Frequency Response
0.05–150 Hz, 0.15–150 Hz, 0.5–150 Hz, 0.05–100 Hz, 0.15–100 Hz, 0.5–100 Hz, 0.05–40 Hz, 0.15–40 Hz, 0.5–40 Hz
Rhythm Frequency Response
0.05–150 Hz, 0.15–150 Hz, 0.05–100 Hz, 0.15–100 Hz, 0.05–40 Hz, 0.15–40 Hz
Filters
AC noise
Baseline wander
Artifact
Printer
Printer Resolution
High resolution, digital-array printer using thermalsensitive paper
200 dpi (voltage axis) by 500 dpi (time axis)
Report Formats
3 4 (1R, 3R)
6 2
Panoramic 12 (Cabrera) 12 1
Rhythm (up to 12 selected leads) Extended Measurements
One Minute Disclose (1 lead)
Full disclosure (5 min, 1 to s selected leads)
Battery Operation
Capacity
Typically 50 ECGs and copies on a single charge or 40 min of continuous rhythm recording
Recharge
Seven hours in standby mode to >90% capacity (typical)
Network Connections
10/100 Base-T IEEE 802.3 Ethernet Via RJ45 connector (standard)
Optional software required for Proxim Range LAN 27410 CE PC card wireless LAN connection
FAX Capability (optional)
Group 3, Class 1 or 2 fax
Modem (optional for USA & Canada)
V.90, K56 flex, enhanced V.34, V32 bits, V.32, V.22 bits and below
Barcode Reader (optional)
Reads Code 39 (standard and full ASCII)
Magnetic Card Stripe Reader (optional)
Reads cards adhering to ISO 7810, 7811-1, -2, -3, -4, and JIS X6301 and X6302