

- •VOLUME 3
- •CONTRIBUTOR LIST
- •PREFACE
- •LIST OF ARTICLES
- •ABBREVIATIONS AND ACRONYMS
- •CONVERSION FACTORS AND UNIT SYMBOLS
- •EDUCATION, COMPUTERS IN.
- •ELECTROANALGESIA, SYSTEMIC
- •ELECTROCARDIOGRAPHY, COMPUTERS IN
- •ELECTROCONVULSIVE THERAPHY
- •ELECTRODES.
- •ELECTROENCEPHALOGRAPHY
- •ELECTROGASTROGRAM
- •ELECTROMAGNETIC FLOWMETER.
- •ELECTROMYOGRAPHY
- •ELECTRON MICROSCOPY.
- •ELECTRONEUROGRAPHY
- •ELECTROPHORESIS
- •ELECTROPHYSIOLOGY
- •ELECTRORETINOGRAPHY
- •ELECTROSHOCK THERAPY.
- •ELECTROSTIMULATION OF SPINAL CORD.
- •ELECTROSURGICAL UNIT (ESU)
- •EMERGENCY MEDICAL CARE.
- •ENDOSCOPES
- •ENGINEERED TISSUE
- •ENVIRONMENTAL CONTROL
- •EQUIPMENT ACQUISITION
- •EQUIPMENT MAINTENANCE, BIOMEDICAL
- •ERGONOMICS.
- •ESOPHAGEAL MANOMETRY
- •EVENT-RELATED POTENTIALS.
- •EVOKED POTENTIALS
- •EXERCISE FITNESS, BIOMECHANICS OF.
- •EXERCISE, THERAPEUTIC.
- •EXERCISE STRESS TESTING
- •EYE MOVEMENT, MEASUREMENT TECHNIQUES FOR
- •FETAL MONITORING
- •FETAL SURGERY.
- •FEVER THERAPY.
- •FIBER OPTICS IN MEDICINE
- •FICK TECHNIQUE.
- •FITNESS TECHNOLOGY.
- •FIXATION OF ORTHOPEDIC PROSTHESES.
- •FLAME ATOMIC EMISSON SPECTROMETRY AND ATOMIC ABSORPTION SPECTROMETRY
- •FLAME PHOTOMETRY.
- •FLOWMETERS
- •FLOWMETERS, RESPIRATORY.
- •FLUORESCENCE MEASUREMENTS
- •FLUORESCENCE MICROSCOPY.
- •FLUORESCENCE SPECTROSCOPY.
- •FLUORIMETRY.
- •FRACTURE, ELECTRICAL TREATMENT OF.
- •FUNCTIONAL ELECTRICAL STIMULATION
- •GAMMA CAMERA.
- •GAMMA KNIFE
- •GAS AND VACUUM SYSTEMS, CENTRALLY PIPED MEDICAL
- •GAS EXCHANGE.
- •GASTROINTESTINAL HEMORRHAGE
- •GEL FILTRATION CHROMATOGRAPHY.
- •GLUCOSE SENSORS
- •HBO THERAPY.
- •HEARING IMPAIRMENT.
- •HEART RATE, FETAL, MONITORING OF.
- •HEART VALVE PROSTHESES
- •HEART VALVE PROSTHESES, IN VITRO FLOW DYNAMICS OF
- •HEART VALVES, PROSTHETIC
- •HEART VIBRATION.
- •HEART, ARTIFICIAL
- •HEART–LUNG MACHINES
- •HEAT AND COLD, THERAPEUTIC
- •HEAVY ION RADIOTHERAPY.
- •HEMODYNAMICS
- •HEMODYNAMIC MONITORING.
- •HIGH FREQUENCY VENTILATION
- •HIP JOINTS, ARTIFICIAL
- •HIP REPLACEMENT, TOTAL.
- •HOLTER MONITORING.
- •HOME HEALTH CARE DEVICES
- •HOSPITAL SAFETY PROGRAM.
- •HUMAN FACTORS IN MEDICAL DEVICES
- •HUMAN SPINE, BIOMECHANICS OF
physiological hip joint simulator. Biomed Mat Eng 2001; 11:143–157.
63.Germain MA. Biological reactions to cobalt chrome wear particles, Ph.D. dissertation, University of Leeds, 2002.
64.Tipper JL, Hatton A, Nevelos JE, Ingham E, Doyle C, Streicher R, Nevelos AA, Fisher J. Alumina-alumina artificial hip jointsPart II: Characterisation of the wear debris from in vitro hip joint simulations. Biomaterials 2002;23: 3441–3448.
65.Hatton A, Nevelos JE, Nevelos AA, Banks RE, Fisher J, Ingham E. Alumina-alumina artificial hip jointsPart I: a histological analysis and characterization of wear debris by laser capture microdissection of tissues retrieved at revision. Biomaterials 2002;23:3429–3440.
66.Scholes SC, Unsworth A. Comparison of friction and lubrication of different hip prostheses. Proc Inst Mech Eng J Eng Med 2000;214(1):49–57.
67.Ingham E, Fisher J. Biological reactions to wear debris in total joint replacement. Proc Inst Mech Eng J Eng Med 2000;214(H1):21–37.
68.Galvin AL, Tipper J, Stone M, Ingham E, Fisher J. Reduction in wear of crosslinked polyethylene under different tribological conditions. Proc Int Conf Eng Surg Joined Hip, IMechE 2002; C601/005.
69.Galvin AL, Endo MM, Tipper JL, Ingham E, Fisher J. Functional biological activity and osteolytic potential of non-cross- linked and cross-linked UHMWPE hip joint prostheses. Trans 7th World Biomat Cong 2004. p 145.
70.Jin ZM, Dowson D, Fisher J. Analysis of fluid film lubrication in artificial hip joint replacements with surfaces of high elastic modulus. Proc Inst Mech Eng J Eng Med 1997;211: 247–256.
71.Chan FW, Bobyn JD, Medley JB, Krygier JJ, Tanzer M. The Otto Aufranc Award-Wear and lubrication of metal-on-metal hip implants. Clin Orthopaed Rel Res 1999;369:10–24.
72.Firkins PJ, Tipper JL, Ingham E, Stone MH, Farrar R, Fisher J. Influence of simulator kinematics on the wear of metal-on- metal hip prostheses. Proc Inst Mech Eng J Eng Med 2001a;215(H1):119–121.
73.Scholes SC, Green SM, Unsworth A. The wear of metal-on- metal total hip prostheses measured in a hip simulator. Proc Inst Mech Eng J Eng Med 2001;215(H6):523–530.
74.Williams S, Stewart TD, Ingham E, Stone MH, Fisher J. Metal-on-metal bearing wear with different swing phase loads. J Biomed Mater Res 2004;15:70B(2):233–9.
75.Liu F, Jin ZM, Grigoris P, Hirt F, Rieker C. Contact Mechanics of Metal-on-Metal Hip Implants Employing a Metallic Cup With an UHMWPE Backing, Journal of Engineering in Medicine. Proc Inst Mech Eng 2003;217:207–213.
76.Liu F, Jin ZM, Grigoris P, Hirt F, Rieker C. Elastohydrodynamic Lubrication Analysis of a Metal-on-Metal Hip Implant Employing a Metallic Cup With an UHMWPE Backing Under Steady-State Conditions. J Eng Med Proc Inst Mech Eng 2004;218:261–270.
77.Smith SL, Dowson D, Goldsmith AAJ. The lubrication of metal-on-metal total hip joints: a slide down the Stribeck curve. Proc Inst Mech Eng J Eng Tribol 2001;215(J5):483–493.
78.Rieker CB, et al.In vitro tribology of large metal-on-metal implants. Proc 50th Trans Orthopaed Res Soc 2004; 0123.
79.Ingham E, Fisher J. Can metal particles (Theoretically) cause osteolysis? Proceedings of the Second International Conference on Metal-Metal Hip Prostheses: Past Performance and Future Directions, Montreal, Canada, 2003.
80.Nevelos JE, Ingham E, Doyle C, Streicher R, Nevelos AB, Walter W, Fisher J. Micro-separation of the centres of alumina–alumina artificial hip joints during simulator testing produces clinically relevant wear rates and patterns. J Arthroplasty 2000;15(6):793–795.
HOME HEALTH CARE DEVICES |
525 |
81.Muratoglu OK, Bragdon CR, O’Connor D, Jasty M, Harris WH, Gul R, McGarry F. Unified wear model for highly cross-linked ultra-high molecular weight polyethylene (UHMWPE). Biomaterials 1999;20:1463–1470.
82.McKellop H, Shen FW, Lu B, Campbell P, Salovey R. Development of an extremely wear-resistant ultra high molecular weight polyethylene for total hip replacements. J Orthop Res 1999;17:157–167.
83.Bradford L, Baker DA, Graham J, Chawan A, Ries MD, Pruitt LA. Wear and surface cracking in early retrieved highly cross-linked polyethylene acetabular liners. J Bone Joint Surg 2004;86A:1271–1282.
84.Firkins PJ, Tipper JL, InghamE, Stone MH, Farrar R, Fisher J. A novel low wearing differential hardness, ceramic-on-metal hip joint prosthesis. J Biomech 2001;34(10):1291–1298.
85.McMinn D, Treacy R, Lin K, Pynsent P. Metal on metal surface replacement of the hip. Experience of the McMinn prosthesis. Clin Orthop 1996;329:S89–98.
86.Hu XQ, Isaac GH, Fisher J. Changes in the contact area during the bedding-in wear of different sizes of metal on metal hip prostheses. J Biomed Mater Eng 2004;14(2):145–149.
87.Dowson D, Hardaker C, Flett M, Isaac GH. A hip joint simulator study of the performance of metal-on-metal joints: Part II: Design. J Arthroplasty 2004;19(8 Suppl 1):124–130.
88.Fisher J,Hu XQ, TipperJL, StewartTD, WilliamsS,Stone MH, Davies C, Hatto P, Bolton J, Riley M, Hardaker C, Isaac GH, Berry G, Ingham E. An in vitro study of the reduction in wear of metal-on-metal hip prostheses using surface-engineered femoral heads. Proc Inst Mech Eng [H] 2002; 216(4):219–230.
89.Fisher J, Hu XQ, Stewart TD, Williams S, Tipper JL, Ingham E, Stone MH, Davies C, Hatto P, Bolton J, Riley M, Hardaker C, Isaac GH, Berry G. Wear of surface engineered metal-on-metal hip prostheses. J Mater Sci Mater Med 2004;15(3):225–235.
90.Bigsby RJ, Auger DD, Jin ZM, Dowson D, Hardaker CS, Fisher J. A comparative tribological study of the wear of composite cushion cups in a physiological hip joint simulator. J Biomech 1998;31(4):363–369.
91.Jennings LM, Fisher J. A biomechanical and tribological investigation of a novel compliant all polyurethane acetabular resurfacing system. Proceedings of the International Conference of Engineers and Surgeons Joined at the Hip, IMechE 2002; C601/032.
See also ALLOYS, SHAPE MEMORY; BIOMATERIALS, CORROSION AND WEAR OF; JOINTS, BIOMECHANICS OF; ORTHOPEDICS, PROSTHESIS FIXATION FOR.
HIP REPLACEMENT, TOTAL. See MATERIALS AND
DESIGN FOR ORTHOPEDIC DEVICES.
HOLTER MONITORING. See AMBULATORY
MONITORING.
HOME HEALTH CARE DEVICES
TOSHIYO TAMURA
Chiba University School of
Engineering
Chiba, Japan
INTRODUCTION
The increase in the size of the elderly population and the importance of preventing life-related diseases, such as

526 HOME HEALTH CARE DEVICES
cancer, hypertension, and diabetes, all emphasize the importance of home healthcare. Generally, the purpose of home healthcare is to reduce the distance the patient must travel to receive care and to reduce the number of hospital admissions.
The devices used in home healthcare must be simple to use, safe, inexpensive, and noninvasive or minimum invasive so that they excessively disturb normal daily activities. Recent developments in home healthcare devices meet most of these specifications, but some still pose a problem in that they disturb the activities of normal daily life and the effectiveness of some other devices in monitoring particular health-related parameters has been questioned.
The requirements for the devices used in home healthcare depend on both their purpose and the subject’s condition. Monitoring vital signs, such as heart rate, blood pressure, and respiration, is routinely done for elderly individuals and for patients with chronic disease or who are under terminal care. These cases require simple, noninvasive monitors. When patients are discharged from the hospital and continue to need these parameters monitored at home, the devices used are essentially no different from those used in the hospital.
For health management and the prevention of disease, an automatic health monitoring system has been considered. The onset of lifestyle-related diseases, such as hypertension, arteriosclerosis, and diabetes, is highly correlated with daily activities, such as physical exercise, including walking, as well as other habits, such as sleep and smoking. To prevent such diseases, daily monitoring will be important for achieving healthy living and improving the quality of life. Although the monitoring of daily activities is not well established in evidenced-based health research, there have been many attempts at installing sensors and transducers and monitoring daily life at home.
Evidenced-based health research directed at finding correlations between daily activity monitoring and the onset of disease, and identifying risk factors, is a major subject of epidemiology. In general, large population studies of daily living activities, including daily food intake, based on the history using interviews or questionnaires are required. If an automatic monitoring system can be applied, more reliable and objective data can be obtained.
Recently, many new home healthcare devices have been developed because many individuals have become motivated to maintain their health. This article discusses recently developed homecare devices, as well as expected laboratory-based devices.
BLOOD PRESSURE
Blood pressure is one of the most important physiological parameters to monitor. Blood pressure varies considerably throughout the day and frequent blood pressure monitoring is required in many home healthcare situations. Usually, a blood pressure reading just before the patient wakes in the morning is required. The success of home blood pressure readings is highly dependent on the patient’s motivation. Blood pressure readings at home are also recommended because many patients have elevated
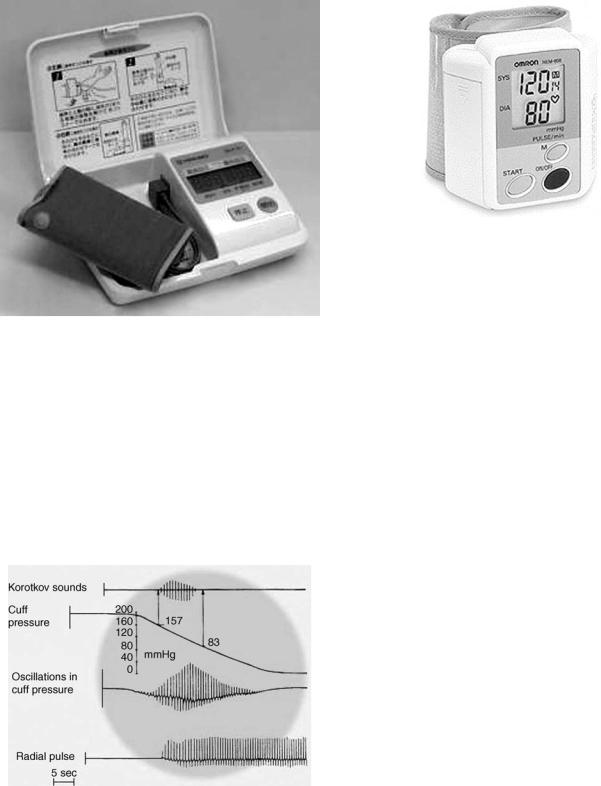
Figure 1. The standard blood pressure monitor. The device includes an inflatable cuff, a manometer, and a stethoscope. The bladder is inflated until the cuff compresses the artery in the arm; since no blood passes, the stethoscope detects no noise. Then, the cuff is deflated slowly, blood passes though the artery again, and the stethoscope perceives a noise, which is defined as the systolic pressure. The cuff continues to deflate and finally the stethoscope perceives no noise, defined as the diastolic pressure.
blood pressure readings in a clinical setting, the so-called ‘‘white-coat hypertension’’.
Medical doctors and nurses usually measure blood pressure using the auscultatory method as shown in Fig. 1, in which a pressure cuff is attached to the upper arm and inflated to compress the brachial artery to a value above the systolic pressure. Then, the cuff is gradually deflated while listening to the Korotkoff sounds though a stethoscope placed on the brachial artery distal to the cuff. The systolic and diastolic pressures are determined by reading the manometer when the sounds begin and end, respectively. However, this technique requires skill and it is difficult to measure blood pressure on some obese individuals using this method.
For home blood pressure monitoring, convenient automatic devices have been developed and are commercially available. The measurement sites are the upper arm, wrist, and finger.
The most common method is to attach the cuff to the upper arm, and the systolic and diastolic pressures are determined automatically (Fig. 2). The cuff is inflated by an electric pump and deflated by a pressure-released valve. To determine the pressures, two different methods are used: Korotkoff sounds and an oscillometric method.
A microphone installed beneath the cuff detects the Korotkoff sounds and when the systolic and diastolic pressures are detected, a pressure sensor measures the obtained sounds and pressure at the critical points. The advantage of this method is that this measurement principle follows the standard auscultatory method. When the cuff is attached correctly, a reliable reading can be obtained.
The size of the cuff is important. The cuff should accurately transmit pressure down to the tissue surrounding
HOME HEALTH CARE DEVICES |
527 |
Figure 2. Automatic blood pressure monitor using both auscultatory and oscillometric methods.
the brachial artery. A narrow cuff results in a larger error in pressure transmission. The effect of cuff size on blood pressure accuracy for the Korotkoff method has been studied experimentally (1).
The oscillometric method detects the pulsatile components of the cuff pressure as shown in Fig. 3. When the cuff pressure is reduced slowly, pulses appear in the systolic pressure and the amplitude of the pulses increases and then decreases again. The amplitude of these pulses is always maximal when the cuff pressure equals the mean arterial pressure. However, it is difficult to determine the diastolic pressure from the signal measured from the
Figure 3. Principle of the oscillometric method. The pulsations induced by the artery differ when the artery is compressed. Initially, no pulsation occurs, and then the pulsation starts. As the pressure decreases in the cuff, the oscillation becomes more significant, until the maximum amplitude of the oscillations defines the average blood pressure. Then, the oscillations decrease with the cuff pressure until they disappear.
Figure 4. Wrist-type home blood pressure monitor. The measurement site is the wrist and during the measurement, the wrist must be at heart level.
cuff pressure. In general, the diastolic pressure is determined indirectly in commercial devices. One simple method that is often used is to calculate the diastolic pressure from the mean arterial pressure and systolic pressure (2). Several algorithms for this calculation have been used in commercial blood pressure monitors. The oscillometric method can only measure the cuff pressure.
Blood pressure measurement is not restricted to the upper arm. It is possible to measure blood pressure at the wrist and on a finger. However, if the measurement site is changed from the upper arm, the errors due to gravitational force and the peripheral condition increase. Wristtype blood pressure monitors are now common in home use (Fig. 4).
Home blood pressure monitors are tested for accuracy against two protocols: the Association for the Advancement of Medical Instruments (AAMI) and the International Protocol of the European Society of Hypertension. Reports of the accuracy of home blood pressure monitors have been published (3). In addition, a 24 h home blood pressure monitor has been evaluated (4).
A home blood pressure monitor using the pulse wave transit time has also been studied. The principle used in this approach is that the arterial pulse wave transit time depends on the elasticity of the arterial vessel wall and the elasticity depends on the arterial pressure. Therefore, arterial pressure affects the pulse wave transit time. However, vascular elasticity is also affected by vasomotor activities, which depend on external circumstances; so this method is not reliable. Even so, with intermittent calibration we can estimate the blood pressure from the pulse wave transit time (5). The pulse wave transit time can be noninvasively determined from the arrival time of the arterial pulse at the beginning of cardiac contraction, which is determined from the QRS complex in an electrocardiogram.
ELECTROCARDIOGRAM
The electrocardiogram (ECG) gives important cardiac information. Recording the ECG at home can assist physicians to make a diagnosis. When monitoring the ECG at home
528 HOME HEALTH CARE DEVICES
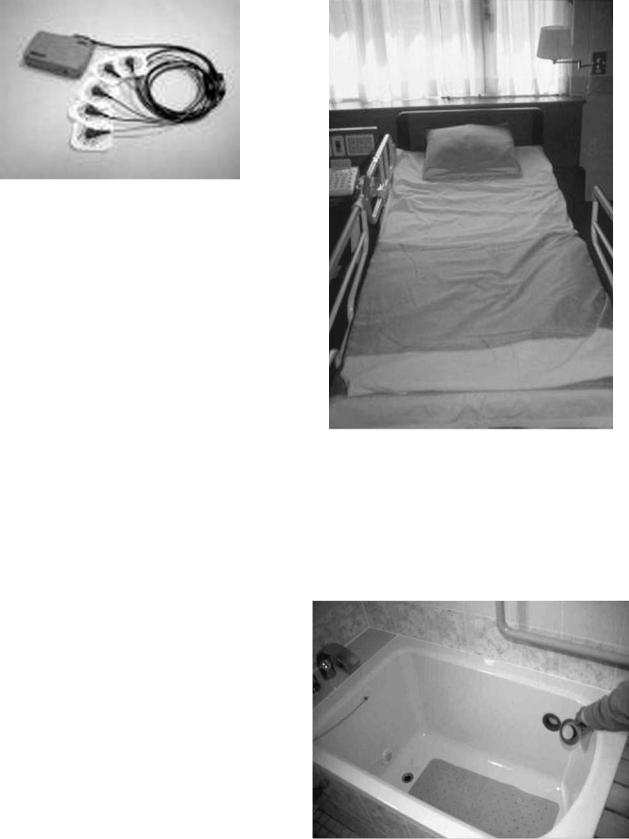
Figure 5. Holter ECG recorder. The Holter recorder is used for 24 h ECG monitoring and a digital Holter recorder is commonly used.
during either recovery from an acute disease or when the patient has a chronic disease, long-term recording is essential in order to detect rarely occurring abnormalities.
The Holter ECG recorder as shown in Fig. 5, has been widely used. It is a portable recorder that records the ECG on two or more channels for 24 or 48 h, on either an ordinary audiocassette tape or in a digital memory, such as solid-state flash memory. Most Holter recorders are lightweight, typically weighing 300 g or less, including the battery. The ECG must be recorded on the chest and electrodes need to be attached by clinical staff. A physician should also be available to monitor the ECG. Aside from these limitations, the Holter recorder can be used without obstructing a patient’s daily life.
There are some special ECG recordings that can be taken in the home. The ECG can be recorded automatically during sleep and bathing.
In bed, the ECG can be recorded from a pillow and sheets or beneath the leg using electroconductive textiles (Fig. 6) (6). Since the contact between the textile electrodes and the skin is not always secure, large artifacts occur with body movements. In our estimation, 70–80% of ECGs during sleep can be monitored.
The ECG can also be recorded while bathing. If electrodes are installed on the inside wall of the bathtub as shown in Fig. 7, an ECG can be recorded through the water (7,8). The amplitude of the ECG signal depends on the conductivity of the tap water. If the conductivity is high, the water makes a short circuit with the body, which serves as the voltage source, and consequently the amplitude is reduced. If the water conductivity is low, however, the signal amplitude remains at levels similar to those taken on the skin surface. Fortunately, the electrical conductivity of ordinary tap water is on the order of 10 2 S m 1, which is within the acceptable range for measurement using a conventional ECG amplifier. However, such an ECG signal cannot be used for diagnostic purposes because of the attenuation of the signal at lower frequencies.
HEART AND PULSE RATES
The heart rate (HR) is a simple indicator of cardiac function during daily life and exercise. The HR is the number of
Figure 6. The ECG recorded from the bed. Electrodes are placed on the pillow and the lower part of the bed. An ECG signal can be obtained during sleep.
contractions of the heart per minute, and the pulse rate is defined as the number of arterial pulses per minute. Usually, both rates are the same. When there is an arrhythmia, some contractions of the heart do not produce effective ejection of blood into the arteries and this gives a lower pulse rate.
Figure 7. The ECG recorded from a bathtub. Silver–silver chloride electrodes are placed in the bathtub and the ECG signal can be obtained though the water.
The heart rate can be determined by counting the QRS complexes in an ECG or measuring the R–R interval when the cardiac rhythm is regular. In patients with an arrhythmia, the ECG waveforms are abnormal, and in this case detection algorithms with filtering are used. For accurate heart rate monitoring, electrodes are attached to the chest. Instead of surface electrodes, a chest strap is also available (Polar, Lake Success, NY)
The pulse rate can be obtained by detecting the arterial pulses using a photoplethysmograph, mechanical force measurements, vibration measurements, or an impedance plethysmograph. In photoplethysmograpy, the change in light absorption caused by the pulsatile change in the arterial volume in the tissue is detected. To monitor the pulse rate using photoplethysmography, the finger is commonly used. Light sources with wavelengths in the infrared (IR) region 800 nm are adequate for this purpose, because tissue absorbance is low and the absorbance of hemoglobin at this wavelength does not change with oxygen saturation.
The pulse oximeter, described below, can monitor both oxygen saturation and pulse rate. The pulsatile component of light absorption is detected and the pulse rate can be determined from the signal directly. The ring-type pulse oximeter is the most commonly used type of pulse oximeter.
A wristwatch type pulse rate meter is also available. It consists of a reflection-type photoplethysmograph. To measure pulse rate, the subject puts their fingertip on the sensor. A flashing icon on the display indicates a detected pulse, and the rate is displayed within 5 s.
The pulse rate can also be monitored in bed. In this case, the pulse rate is obtained directly from an electroconductive sheet. Vibration of the bed is detected by a thin flexible electric film (BioMatt, Deinze, Belgium) or an air mattress with a pneumatic sensor. In either case, the pulse rate is obtained through signal processing.
BODY TEMPERATURE
Body temperature has been checked at home for many years to detect fever. Frequent body temperature measurements are required for homecare in many chronic diseases. Basal body temperature measurement is also required when monitoring the menstrual cycle.
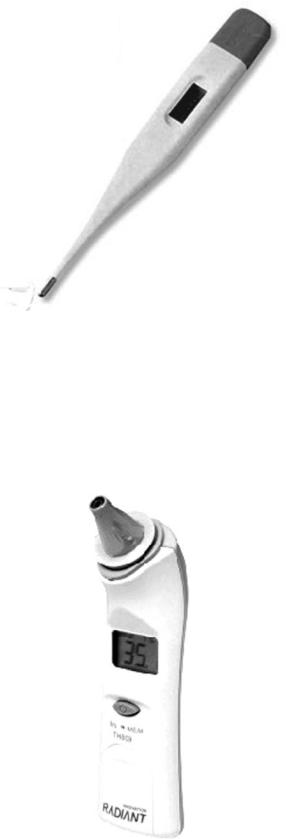
Stand-alone mercury-in-glass clinical thermometers have long been used both in clinical practice and at home, although they have recently been replaced by electronic thermometers because mercury contamination can occur if they are broken (Fig. 8). The ordinary electronic clinical thermometer uses a thermistor as a temperature sensor. The body temperature is displayed digitally. There are two types of clinical thermometer: the prediction and the real-time type. The real-time type waits until a stable temperature value is obtained. The prediction type attempts to predict the steady-state temperature using an algorithm involving exponential interpolation. The response time of a real-time electronic thermometer is 3 min and the response time of a prediction-type electronic thermometer is < 1 min, when both are placed in the mouth.
HOME HEALTH CARE DEVICES |
529 |
Figure 8. The electric thermometer contains a thermistor. Both predicting and real-time types are sold.
The tympanic thermometer as shown in Fig. 9, has become popular for monitoring the body temperature in children and the elderly because of its fast response. The device operates on the principle of IR radiation. The sensor is either a thermopile or pyroelectric sensor and is installed
Figure 9. The tympanic thermometer. Either a thermopile or a pyroelectric sensor is used as the temperature sensor. This device has a faster response than an electric thermometer.
530 HOME HEALTH CARE DEVICES
Disposable probe cover
Tympanic membrane
External auditory canal
Tympanic thermometer probe
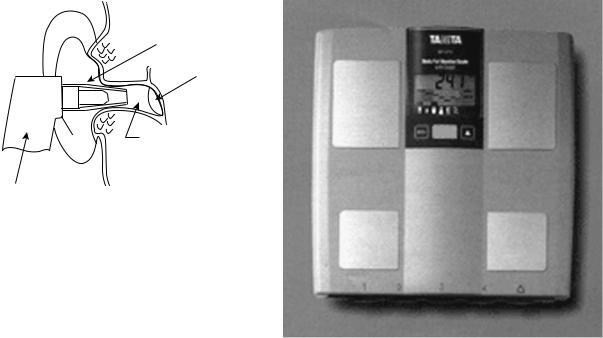
Figure 10. The principle of the tympanic thermometer. The sensor tip is inserted into the ear canal and the thermal distribution of tympanum is measured.
near the probe tip, as shown in Fig. 10. The probe tip is inserted into the auditory canal and the radiation from the tympanic membrane and surrounding tissue is detected. The tympanic temperature is close to the deep body temperature and the measurement can be made within a few seconds. Many studies have shown that when used properly, a tympanic thermometry is very accurate. However, IR tympanic thermometers produced measurements that were both less accurate and less reproducible when used by nurses who routinely used them in clinical practice (9,10).
A strip thermometer is sometimes used to monitor an acute fever. It is designed to be used once only and then discarded. It contains strips of thermosensitive liquid crystal that change color to indicate skin temperature, not body temperature. The color change is nonreversible. The strip is placed on the forehead and then read after 1 min. If a strip thermometer shows a high temperature, one should recheck the temperature with another type of thermometer.
BODY FAT
Body composition and body fat have both been proposed as indicators of the risk of chronic disease.
Body fat percentage is the proportion of fat in a person’s body. Excess body fat was previously determined by measuring weight and comparing that value with height. Body fat is not always visible and cannot be measured on an ordinary scale. Obesity, which indicates a high degree of excess body fat, has been linked to high blood pressure, heart disease, diabetes, cancer, and other disabling conditions. To estimate the percentage of body fat, it is commonly derived from body density. The following equation gives an estimate of body density (D), which is then converted into the percent body fat (%BF) using the Siri equation:
%BF ¼ ð495=DÞ 450
Body density, measured by weighting an individual while immersed in a tank of water, is based on Archimedes’ principle and is a standard technique. However, this is not
Figure 11. A scale with bioelectrical impedance analysis. This is a simple version of body impedance analysis using leg-to-leg bioimpedance analysis. The precision electronic scale has two footpad electrodes incorporated into its platform. The measurement is taken while the subject’s bare feet are on the electrodes. The body fat percentage can be obtained from equations based on weight, height, and gender.
a convenient method for measurement in the home. Body volume can be determined from the air volume in an airtight chamber with the body inside by measuring the compliance of the air in the chamber (Bod Pod, Life Measurement Instruments, Concord, CA).
Body fat scales use the bioelectrical impedance analysis (BIA) technique. This method measures body composition using four electrodes, in which a constant alternating current (ac) of 50–100 kHz and 0.1–1 mA is applied between the outer electrode pair, and the alternating voltage developed between the inner electrode pair is detected (Fig. 11). Alternating current is applied between the toes of both feet, and the voltage developed between the electrodes at both feet is detected. The current passes freely through the fluids contained in muscle tissue, but encounters difficulty–resistance when it passes through fat tissue. This means that electrical impedance is different in different body tissues. This resistance of the fat tissue to the current is called bioelectrical impedance, and is accurately measured by body fat scales. Using a person’s height and weight, the scales can then compute the body fat percentage. Recently, new commercial BIA instruments, such as the body segmental BIA analyzer, multifrequency BIA analyzer, lower body BIA analyzer, upper body BIA analyzer, and laboratory-designed BIA analyzers, have greatly expended the utility of this method (11). However, body composition differs by gender and race. Nevertheless, the impedance technique is highly reproducible for estimating the lean body mass (12).

The use of near-IR spectral data to determine body composition has also been studied (13). Basic data suggest that the absorption spectra of fat and lean tissues differ. The FUTREX-5000 (Zelcore, Hagerstown, MD) illuminates the body with near-IR light at very precise wavelengths (938 and 948 nm). Body fat absorbs the light, while lean body mass reflects the light. The intensity of back-scattered light is measured. This measurement provides an estimation of the distribution of body fat and lean body mass.
BLOOD COMPONENTS
In a typical clinical examination, the analysis of blood components is important. Medical laboratory generally use automatic blood analyzers for blood analysis. Usually, an invasive method is required to obtain a blood sample. Therefore, in a home healthcare setting, the monitoring and analysis of blood is uncommon, except for diabetic patients. In this section, we focus on the blood glucose monitor.
There are several commercial home blood glucose monitors. Self-monitoring of blood glucose (SMBG) is recommended for all people with diabetes, especially for those who take insulin. The role of SMBG has not been defined for people with stable type 2 diabetes treated with diet only. As a general rule, the American Diabetes Association (ADA) recommends that most patients with type 1 diabetes test glucose three or more times daily. Blood glucose is commonly measured at home using a glucose meter and a drop of blood taken from the finger (Fig. 12). A lancet device, which contains a steel needle that is pushed into the skin by a small spring, is used to obtain a blood sample. A small amount of blood is drawn into the lumen of the needle. The needle diameter is from 0.3 (30 G) to 0.8 (21 G) mm. In addition, laser lancing devices, which use a laser beam to produce a small hole by vaporizing the skin tissue, are available.
Once a small amount of blood is obtained, blood glucose can be analyzed using either a test strip or a glucose meter.
HOME HEALTH CARE DEVICES |
531 |
The blood glucose level can be estimated approximately by matching the color of the strip to a color chart. In electrochemical glucose meters for homecare, a drop of blood of 10 mL or less is placed in the sensor chip. The blood glucose is measured by an enzyme-based biosensor. Most glucose meters can read glucose levels over a broad range of values, from as low as 0 to as high as 600 mg dL. Since the range differs among meters, it is important to interpret very high or low values carefully. Glucose readings are not linear over their entire range.
Home blood glucose meters measure the glucose in whole blood, while most lab tests measure the glucose in plasma. Glucose levels in plasma are generally 10–15% higher than glucose measurements in whole blood (and this difference is even larger after a person has eaten). Many commercial meters now give results as the ‘‘plasma equivalent’’. This allows patients to compare their glucose measurements from lab tests with the values taken at home.
Minimally invasive and noninvasive blood glucose measurement devices are also sold. One of these uses near-IR spectroscopy to measure glucose. It is painless. There are increasing numbers of reports in the scientific literature on the challenges, strengths, and weaknesses of this and other new approaches to testing glucose without fingersticks (14,15).
The U.S. Food and Drug Administration (FDA) has approved minimally invasive meters and noninvasive glucose meters, but neither of these should replace standard glucose testing. They are used to obtain additional glucose values between fingerstick tests. Both devices require daily calibration using standard fingerstick glucose measurements.
The MiniMed system (Medtronic, Minneapolis, MN) consists of a small plastic catheter (a very small tube) inserted just under the skin. The catheter collects small amounts of liquid, which are passed through a biosensor to measure the amount of glucose present. The MiniMed is intended for occasional use and to discover trends in glucose levels during the day. Since it does not give readings for individual tests, it cannot be used for typical day-to-day
Figure 12. Glucose meter. This is used for selfmonitoring blood glucose. The blood is taken from the fingertip and analyzed using a test strip.
532 |
HOME HEALTH CARE DEVICES |
|
|
|
|
|
|
||||||||
|
|
|
|
|
|
|
Constant current source |
||||||||
|
Active |
|
|
|
|
|
|
|
Return |
||||||
|
electrode |
|
|
|
|
|
|
|
|
|
|||||
|
|
|
|
|
|
|
|
|
|
|
|
|
|
|
electrode |
|
|
|
|
|
|
|
|
|
|
|
|
|
|
|
|
|
|
|
Drug |
Buffer ions |
|||||||||||
|
|
reservoir |
|
|
|
|
|
|
|||||||
|
D+ A |
|
|
|
|
|
H+ A |
||||||||
|
|
|
|
||||||||||||
|
|
|
|
|
|
|
|
|
|
|
|
|
|
|
Stratum corneum |
|
|
|
|
|
|
|
|
|
|
|
|
|
|
|
Epidermis |
|
|
|
|
|
|
|
|
|
|
|
|
|
|
|
|
Skin |
|
|
|
|
|
|
Blood (buffer) |
|
|
|
|
|
Dermis |
||
|
|
|
|
|
|
|
|
|
|
||||||
|
|
|
|
|
|
|
|
|
|
|
|
|
|||
|
|
|
|
|
|
|
|
|
|
|
|
|
|||
Figure 13. Glucowatch device (1) and principle of iontophoresis (2). This device provides noninvasive monitoring of glucose and uses reverse iontophoresis to extract glucose from the skin to monitor glucose. A low electric current is applied, which draws interstitial fluid through the skin. The glucose in this fluid is collected in a gel. A chemical process occurs, which generates an electrical signal that is converted into a glucose measurement.
monitoring. The device collects measurements over a 72 h period and then the stored values must be downloaded by the patient or healthcare provider.
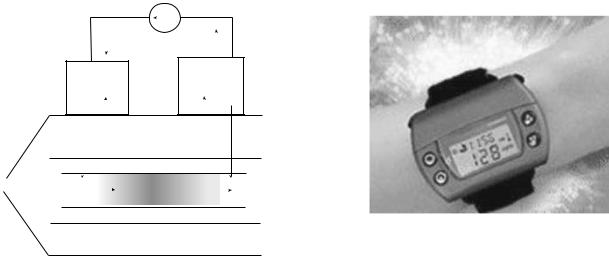
GlucoWatch (Cygnus, Redwood City, CA) is worn on the arm like a wristwatch (Fig. 13). It pulls small amounts of interstitial fluid from the skin by iontophoresis and measures the glucose in the fluid without puncturing the skin. The device requires 3 h to warm up after it is put on the wrist. After this, it can measure glucose up to three times per hour for 12 h. The GlucoWatch displays results that can be read by the wearer, although like the MiniMed device, these readings are not meant to be used as replacements for fingerstick-based tests. The results are meant to show trends and patterns in glucose levels, rather than report any one result alone. It is useful for detecting and evaluating episodes of hyperglycemia and hypoglycemia. However, the values obtained must be confirmed by tests with a standard glucose meter before any corrective action is taken.
An elevated cholesterol level is one of the most important risk factors for coronary heart diseases. For home healthcare, a blood cholesterol test device is available. The test requires that a few drops of blood obtained from a finger stick sample be applied to the cholesterol strip, which contains cholesterol esterase and cholesterol oxidize. Total cholesterol, that is, the sum of free and esterified cholesterol, can be accurately and conveniently measured enzymatically using cholesterol oxidize and cholesterol esterase. The total amount of cholesterol is measured, and the results are obtained in 3–15 min.
URINE COMPONENTS
The analysis of urine components provides important diagnostic information for clinicians. Urine glucose and ketones
indicate diabetes and urine protein indicates kidney disease. However, the only tool available for such testing is the urine test strip. A urine test can be done using a test strip without pain or discomfort. No fully automatic urine test system available, but there have been some attempts to monitor urine components at home with minimum disturbance. The instrument shown in Fig. 14 has been developed. It can be installed in the toilet and measures the urine glucose after a button is pushed (TOTO, Tokyo). The urine collector protrudes, collects urine automatically from the urine stream, and analyzes urine glucose within 1 min using an enzyme glucose sensor. The sensor must be replaced every 4 months and a calibration solution must be replenished every 3 months. This system is useful for monitoring the urine glucose level in diabetic patients.
BODY WEIGHT
Body weight monitored at home is an essential parameter for health management. To use body weight for health management, data must be taken regularly and stored. A digital scale connected to a laptop computer, together with temperature and blood pressure monitors, and a bedsensor system has been developed (16).
A device to weigh the body automatically for health monitoring based on measurements on the toilet seat has been developed (17). A precision load cell system was installed in the floor of the toilet, and the seat was supported so that the weight on the seat was transferred to the load cell. This system also allows the measurement of urine and feces volume, urine flow rate, and the number and times of urination and evacuation.
For health management, the body mass index is commonly used. This is defined as the weight divided by the

Figure 14. Urine glucose monitor installed in the toilet. A small nozzle collects urine and then a biosensor analyzes urine glucose automatically.
square of the height. Excess body weight increases the risk of death from cardiovascular disease and other causes in adults between 30 and 74 years of age. The relative risk associated with greater body weight is higher among younger subjects (18).
NUTRITION
To prevent cardiac disease, diabetes, and some cancers, it is important to control body weight. The most accurate method that currently exists is to weigh foods before they are eaten. Like many other methods, however, this method can be inaccurate, time-consuming, and expensive. There are two basic ways to monitor nutrition. One is to monitor food intake.
Food consumed is photographed using a digital camera and the intake calories are calculated from the photographs (19,20). Digital photography and direct visual estimation methods, estimates of the portion sizes for food selection, plate waste, and food intake are all highly correlated with weighed foods.
The resting metabolism rate (RMR) is an important parameter for controlling body weight. The RMR repre-
HOME HEALTH CARE DEVICES |
533 |
sents the calories the body burns in order to maintain vital body functions (heart rate, brain function, and breathing). It equals the number of calories a person would burn if they were awake, but at rest all day. The RMR can represent up to 75% of a person’s total metabolism if they are inactive or lead a sedentary lifestyle. Since the RMR accounts for up to 75% of the total calories we need each day, it is a critical piece of information for establishing appropriate daily calorie needs, whether one is trying to lose or maintain weight. Most healthcare and fitness professionals recognize that metabolism is affected by a variety of characteristics, such as fever, illness, high fitness, obesity, and active weight loss. When managing a subject’s nutritional needs and calorie requirements, knowledge of their RMR is critical. Since metabolism differs individually, estimating the RMR value can lead to errors, and inaccurate calorie budgets. Consequently, individuals can be unsuccessful at reaching their personal goals, due to overor undereating. As technology advances, professionals must reassess their practices. Caloric needs are assessed most accurately by measuring oxygen consumption and determining individual metabolism. Oxygen consumption estimates are obtained from the oxygen gas concentration and flow. Since it usually requires wearing a mask or mouthpiece, this measurement is difficult for some individuals. The BodyGem and MedGem (HealtheTech, Golden, CO) are devices that provide information vital for determining a personalized calorie budget, based on individual metabolism (Fig. 15). The BodyGem and MedGem consist of an ultrasound flow meter and fluorescence oxygen sensor with a blue LED excitation source, but the measurements are limited to an RMR monitor only. The RMR has been mentioned in the text.
We can also estimate the body’s energy consumption from heat flow and acceleration measurements taken while an individual exercises (Body Media inc. Pittsburg, PA). For diabetes control, a pedometer with an accelerometer has been used and the energy consumption estimated using several algorithms.
Figure 15. A simple oxygen-uptake monitor. The subject wears the mask and a small ultrasonic flow meter measures the respiratory volume and a fluorescence oxygen monitor measures the oxygen concentration. This device is only used for measuring basal metabolism.
534 HOME HEALTH CARE DEVICES
DAILY ACTIVITY
From the standpoint of health management, both the physical and mental health of an individual are reflected in their daily physical activities. The amount of daily physical activity can be estimated from the number of walking steps in a day, which are measured by a pedometer attached to the belt or waistband. To improve physical fitness 10,000 steps per day or more are recommended. For more precise measurement of physical activity, an accelerometer has been used. Behavior patterns, such as changes in posture and walking or running can be classified. The metabolic rate can be estimated from body acceleration patterns. The algorithms for calculating energy consumption differ for different pedometers. Each manufacturer has a different algorithm, and these have not been made public. However, the energy is likely evaluated using total body weight and walking time (21). This measurement requires attaching a device to the body, and requires continual motivation. An accelerometer equipped with a global positioning sensor has been developed and can monitor the distance and speed of daily activity (22).
There have been attempts to monitor daily activities at home without attaching any devices to the body. Infrared sensors can be installed in a house to detect the IR radiation from the body so that the presence or absence of a subject can be monitored, to estimate the daily activity at home, at least when the subject is living alone.
Other simple sensors, such as photointerrupters, electric touch sensors, and magnetic switches, can also be used to detect activities of daily living (23–25). The use of room lights, air conditioning, water taps, and electric appliances, such as a refrigerator, TV, or microwave oven, can be detected and used as information related to daily living. Habits and health conditions have correlated with these data to some extent, but further studies are required to give stronger evidence of correlations between sensor output and daily health conditions.
SLEEP
Sleep maintains the body’s health. Unfortunately, in most modern industrial countries the process of sleep is disturbed by many factors, including psychological stress, noise, sleeping room temperature, and the general environment surrounding the bedroom. Insufficient sleep and poor sleeping habits can lead to insomnia. Another sleep problem is sleep apnea syndrome. In the laboratory, sleep studies aimed at the diagnosis of sleep apnea syndrome include polysomnography (PSG), electroencephalography (EEG), ECG, electromyography (EMG) pulse oximetry, and require chest and abdomen impedance belts. In the home, simple devices are required to evaluate sleep to determine if more detailed laboratory tests are needed.
A physical activity monitor actigraph (AMI, Ardsley, NY) can be used as a sleep detector. It is easy to wear and detects the acceleration of the wrist using a piezoelectric sensor. The wrist acceleration recorded by the actigraph accurately showed when the wearer was asleep (26).
Body movements during sleep can be measured without attaching sensors and transducers to the body using a pressure-sensitive sheet (BioMatt, VTT Electronics, Tampere, Finland). It consists of a 50 mm thick pressuresen- sitive film, which can be installed under the mattress. This film is quite sensitive and not only detects body motions, but also respiration and heart rate. Therefore, it can be used as a sleep monitor for detecting insomnia and sleep disorders and as a patient monitor for detecting sleep apnea, heart dysfunctions, and even coughing and teeth grinding (27–29).
Body motion during sleep can also be monitored using a thermistor array installed on the bed surface at the waist or thigh level (30,31). The changes in temperatures show the body movement and sleep condition.
RESPIRATION THERAPY AND OXYGEN THERAPY
Respiration is the function of gas exchange between the air and blood in the body, and it consists of ventilation of the lung and gas transfer between the alveolar air and the blood in the pulmonary circulatory system. Lung ventilation can be monitored by either measuring the flow rate of the ventilated air or the volume change of the lung. Gas transfer is monitored by arterial blood oxygenation. Frequent respiratory monitoring is required for respiratory therapy at home.
Furthermore, many individuals have developed breathing difficulties as a consequence of increasing pollution, combined with an aging population.
For therapy, we use two types of respiration aid. One is for respiration related to cellular gas exchange. The other is for breathing difficulty, such as sleep apnea.
Reparatory therapy is included in the training of individuals involved in rehabilitation after thoracoabdominal surgery, in paraplegic or quadriplegic patients, and for patients requiring some form of mechanical ventilation. The fundamental parameters that must be monitored are the respiratory rate, respiratory amplitude, and respiratory resistance. Respiratory amplitude can be monitored using either airflow or lung movement.
For continuous monitoring of respiration in a home setting, it is inconvenient to use a mask or mouthpiece. Lung ventilation can be estimated by practice and from abdominal displacement. Inductance plethysmography has been used (32,33). This consists of two elastic bands placed at the rib cage and abdomen. Each band contains a zigzag coil and the inductance of this coil changes with its cross-sectional area. This system, Respitrace (NonInvasive Monitoring Systems, North Bay Village, FL), gives the changes in volume of the rib cage and abdomen, tidal volume, and breathing rate. Respitrace was rated as the best noninvasive technology for the diagnosis of sleeprelated breathing disorders by the American Academy of Sleep Medicine Task Force (1999).
Oxygen therapy, intermittent positive pressure breathing (IPPB) therapy, and respiratory assistance using a respirator can also be performed at home. In these situations, the arterial blood oxygenation must be monitored. Actually, there is a change in optical absorbance on the
HOME HEALTH CARE DEVICES |
535 |
venous side that reflects changes in intrathoracic pressure due to breathing. Blood oxygenation is commonly monitored using a pulse oximeter, which can measure the oxygen saturation of arterial blood noninvasively from the light that is transmitted through a finger (Fig. 16).
The pulse oximeter is based on the principle that the pulsatile component in the transmitted light intensity is caused by the changes in the absorption of arterial blood in the light path while the absorption of the venous blood and tissue remains unchanged. The absorption spectrum of the blood changes with oxygen saturation, so the oxygen saturation of the arterial blood can be determined from the time-varying spectral components in the transmitted light. The oximeter contains two light-emitting diodes (LEDs), which emit light at two different wavelengths, and a photodiode to detect absorption changes at the two different wavelengths (Fig. 17). The measuring site is usually at a finger. However, a probe with a cable can sometimes disrupt the activities of daily life. A reflectiontype probe that can be attached to any part of the body might be more convenient. Unfortunately, reflection-type probes are less reliable than transmission probes (34). A finger-clip probe without a cable (Onyx, Nonin Medical, Plymouth, MN) and a ring-type probe (35) are also available.
Recent advanced home healthcare devices are reviewed. These devices can be used effectively, not only for the elderly, but also for the middle-aged population and to establish home healthcare and telecare. Telecare and telemedicine are now popular for monitoring patients with chronic diseases and elderly people who live alone. The devices are placed in their homes and the data are transmitted to the hospital or a healthcare provider, who can check their clients’ condition once every 12–24 h. Success-
Figure 16. Pulse oximeter. A pulse oximeter is a simple noninvasive method of monitoring the percentage of hemoglobin (Hb) saturated with oxygen. It consists of a probe attached to the subject’s finger. The device displays the percentage of Hb with oxygen together with an audible signal for each pulse beat and the calculated heart rate.
ful application has been reported for oxygen therapy and respiratory therapy.
We have solved several problems for more practical use. The major problems are the standardization of these devices and the agreement between medical use and home healthcare. Standardization of monitoring is important. For example, the principle of body impedance analysis differs for each manufacturer. Therefore, the values differ for different devices. This confuses customers, who then think that the devices are not reliable; hence, nobody uses such devices. There are similar problems with pedometers. Pedometers use either a mechanical pendulum or an accelerometer. The manufacturers should mention their limitations and reliability briefly, although most customers find this information difficult to understand.
The next problem is more serious. Some home healthcare devices have not been approved by health organizations, such as the FDA. For blood pressure monitors, a physician still needs to measure blood pressure during clinical practice even if the subject measures blood pressure at home. If the home healthcare device was sufficiently reliable, the physician would be able to trust the blood pressure values. Both researchers and members of industry must consider ways to solve this problem in the near future. There are additional social problems, such as insurance coverage of home healthcare devices, costs, handling, and interface design. The development of home heathcare devices must also consider the psychological and environmental factors that affect users. In the future, preventative medicine will play an important role in medical diagnosis. Hopefully, more sophisticated, high quality home healthcare devices will be developed. Technology must solve the remaining problems in order to provide people with good devices.
|
Photo cell |
|
|
|
|
|
|
|
|
|
|
|
LED 1 |
|
|
|
|
|
|
|
|
|
|
||
I1 |
|
|
|
|
|
|
|
|
|
|
|
|
Logarithmic |
|
|
|
Demultiplexer |
|
|
Bandpass |
|
||||
|
|
|
|
|
|
|
|
|||||
|
|
amplifier |
|
|
|
|
|
|
filter |
|
||
|
|
|
|
|
|
|
|
|
|
|
||
I1 |
|
|
|
|
|
|
|
|
|
|
|
|
|
|
|
|
|
|
|
|
|
|
|
||
LED 2 |
|
|
|
|
|
|
|
|
|
|
||
|
|
|
|
|
|
|
|
|
|
|
|
|
|
|
|
|
|
|
|
|
|
|
|
|
|
|
|
|
|
|
|
|
∆log l1 |
|
|
|
SpO2 |
|
|
|
|
|
|
|
|
∆log l2 |
|
|
|
||
|
|
|
|
|
|
|
|
|
|
|||
|
|
|
|
|
|
|
|
|
|
|
|
|
|
|
|
|
|
|
|
|
|
|
|
|
|
Figure 17. The principle of the oximeter. Hemoglobin absorbs light and the amount depends on whether it is saturated with oxygen. The absorption at two wavelengths (650 and 805 nm) is measured and used to calculate the proportion of hemoglobin that is oxygenated.