

- •VOLUME 3
- •CONTRIBUTOR LIST
- •PREFACE
- •LIST OF ARTICLES
- •ABBREVIATIONS AND ACRONYMS
- •CONVERSION FACTORS AND UNIT SYMBOLS
- •EDUCATION, COMPUTERS IN.
- •ELECTROANALGESIA, SYSTEMIC
- •ELECTROCARDIOGRAPHY, COMPUTERS IN
- •ELECTROCONVULSIVE THERAPHY
- •ELECTRODES.
- •ELECTROENCEPHALOGRAPHY
- •ELECTROGASTROGRAM
- •ELECTROMAGNETIC FLOWMETER.
- •ELECTROMYOGRAPHY
- •ELECTRON MICROSCOPY.
- •ELECTRONEUROGRAPHY
- •ELECTROPHORESIS
- •ELECTROPHYSIOLOGY
- •ELECTRORETINOGRAPHY
- •ELECTROSHOCK THERAPY.
- •ELECTROSTIMULATION OF SPINAL CORD.
- •ELECTROSURGICAL UNIT (ESU)
- •EMERGENCY MEDICAL CARE.
- •ENDOSCOPES
- •ENGINEERED TISSUE
- •ENVIRONMENTAL CONTROL
- •EQUIPMENT ACQUISITION
- •EQUIPMENT MAINTENANCE, BIOMEDICAL
- •ERGONOMICS.
- •ESOPHAGEAL MANOMETRY
- •EVENT-RELATED POTENTIALS.
- •EVOKED POTENTIALS
- •EXERCISE FITNESS, BIOMECHANICS OF.
- •EXERCISE, THERAPEUTIC.
- •EXERCISE STRESS TESTING
- •EYE MOVEMENT, MEASUREMENT TECHNIQUES FOR
- •FETAL MONITORING
- •FETAL SURGERY.
- •FEVER THERAPY.
- •FIBER OPTICS IN MEDICINE
- •FICK TECHNIQUE.
- •FITNESS TECHNOLOGY.
- •FIXATION OF ORTHOPEDIC PROSTHESES.
- •FLAME ATOMIC EMISSON SPECTROMETRY AND ATOMIC ABSORPTION SPECTROMETRY
- •FLAME PHOTOMETRY.
- •FLOWMETERS
- •FLOWMETERS, RESPIRATORY.
- •FLUORESCENCE MEASUREMENTS
- •FLUORESCENCE MICROSCOPY.
- •FLUORESCENCE SPECTROSCOPY.
- •FLUORIMETRY.
- •FRACTURE, ELECTRICAL TREATMENT OF.
- •FUNCTIONAL ELECTRICAL STIMULATION
- •GAMMA CAMERA.
- •GAMMA KNIFE
- •GAS AND VACUUM SYSTEMS, CENTRALLY PIPED MEDICAL
- •GAS EXCHANGE.
- •GASTROINTESTINAL HEMORRHAGE
- •GEL FILTRATION CHROMATOGRAPHY.
- •GLUCOSE SENSORS
- •HBO THERAPY.
- •HEARING IMPAIRMENT.
- •HEART RATE, FETAL, MONITORING OF.
- •HEART VALVE PROSTHESES
- •HEART VALVE PROSTHESES, IN VITRO FLOW DYNAMICS OF
- •HEART VALVES, PROSTHETIC
- •HEART VIBRATION.
- •HEART, ARTIFICIAL
- •HEART–LUNG MACHINES
- •HEAT AND COLD, THERAPEUTIC
- •HEAVY ION RADIOTHERAPY.
- •HEMODYNAMICS
- •HEMODYNAMIC MONITORING.
- •HIGH FREQUENCY VENTILATION
- •HIP JOINTS, ARTIFICIAL
- •HIP REPLACEMENT, TOTAL.
- •HOLTER MONITORING.
- •HOME HEALTH CARE DEVICES
- •HOSPITAL SAFETY PROGRAM.
- •HUMAN FACTORS IN MEDICAL DEVICES
- •HUMAN SPINE, BIOMECHANICS OF
FLAME ATOMIC EMISSON SPECTROMETRY AND ATOMIC ABSORPTION SPECTROMETRY |
315 |
31.Korman LY. Digital imaging in endoscopy. Gastrointest Endosc 1998;48:318-326.
32.Nelson DB. Ultrathin endoscopes esophagogastroduodenoscopy. Gastrointest Endosc 2000;51:786–789.
33.Lipson SG, Lipson HS, Tannhauser DS. Optical Physics. New York: Cambridge University Press; 1995.
34.Sawatari T, Kapany NS. Statistical evaluation of transfer properties in fiber assemblies. SPIE Proc 1970;21:23.
35.Marhie ME, Schacham SE, Epstein M. Misalignment of imaging multifibers. Appl Opt 1978;17:3503.
36.OptiScan Pty, Ltd. [Online], Investor Presentation, October 2003. Available at http://www.optiscan.com.
37.Gu M, Sheppard CJR, Gan X. Image formation in a fiberoptical confocal scanning microscope. J Opt Soc Am A 8(11): 1755 (November 1991).
38.Huang D, et al. Optical coherence tomography. Science 1991;254:1178–1181.
39.Kiesslich R, et al. Confocal laser endoscopy for diagnosing intraepithelial neoplasias and colorectal cancer in vivo. Gastroenterology 2004;127:706–713.
40.Morgner U, et al. Spectroscopic optical coherence tomography. Opt Lett 2000;25:111–113.
41.Wax A, Yang C, Izatt JA. Fourier-domain low-coherence interferometry for light-scattering spectroscopy. Opt Lett 2003;28:1230–1232.
42.Vakhtin AB, Peterson KA, Wood WR, Kane DJ. Differential spectral interferometry: an imaging technique for biomedical applications. Opt Lett 2003;28:1332–1334.
43.Jiao S, Yu W, Stoica G, Wang LV. Optical -fiber-based Mueller optical coherence tomography. Opt Lett 2003;28:1206–1208.
44.Tearney GJ, et al. Scanning singlemode fiber optic catheterendoscope for optical coherence tomography. Opt Lett 1996;21:543–545.
45.Gelikonov FI, Gelikonov VM. Design of OCT Scanners. Bouma BE, Tearney GJ, editors. Handbook of Optical Coherence Tomography. New York: Marcel Dekker; 2001. pp 125–142.
46.Liu X, Cobb MJ, Chen Y, Li X. Miniature lateral priority scanning endoscope for real-time forward-imaging optical coherence tomography. OSA Biomed Top Meeting Tech Dig SE6 2004.
47.Zara JM, et al. Electrostatic micromachine scanning mirror for optical coherence tomography. Opt Lett 2003;28:628–630.
48.Zara JM, Smith SW. Optical scanner using a MEMS actuator. Sens Actuators A 2002;102:176–184.
49.Piyawattanametha W, et al. Two-dimensional endoscopic MEMS scanner for high resolution optical coherence tomography. Tech Digest Ser Conf Lasers Electro-Optics (CLEO) CWS 2 2004.
50.Pan Y, Xie H, Fedder GK. Endoscopic optical coherence tomography based on a microelectromechanical mirror. Opt Lett 2001;26:1966–1968.
51.Xie H, Pan Y, Fedder GK. Endoscopic optical coherence tomographic imaging with a CMOS-MEMS micromirror. Sens Actuators A 2003;103:237–241.
52.Pan Y, Fedder GK, Xie H. Endoscopic imaging system. U.S. Pat. Appl. US2003/0142934, 2003.
53.Tran PH, Mukai DS, Brenner M, Chen Z. In vivo endoscopic optical coherence tomography by use of a rotational microelectromechanical system probe. Opt Lett 2004;29:1236–1238.
54.Qi B, et al. Dynamic focus control in high-speed optical coherence tomography based on a microelectromechanical mirror. Opt Commun 2004;232:123–128.
55.Brand S, et al. Optical coherence tomography in the gastrointestinal tract. Endoscopy 2000;32:796–803.
56.Seitz U, et al. First in vivo optical coherence tomography in the human bile duct. Endoscopy 2001;33:1018–1021.
57.Zonios G, et al. Diffuse reflectance spectroscopy of human adenomatous colon polyps in vivo. Appl Opt 1999;38:6628–6637.
58.Perelman LT, et al. Observation of Periodic Fine Structure in Reflectance from Biological Tissue: A New Technique for Measuring Nuclear Size Distribution. Phys Rev Lett 1998;80:627–630.
59.Wallace MB, et al. Endoscopic Detection of Dysplasia in Patients with Barrett’s Esophagus using Light Scattering Spectroscopy. Gastroenterology 2000;119:677–682.
60.Perelman LT, Backman V. Light scattering spectroscopy of epithelial tissues: principles and applications. In: Tuchin VV, editor. Handbook on Optical Biomedical Diagnostics. Bellingham: SPIE Press; 2002.
61.Backman V, et al. Diagnosing cancers using spectroscopy. Nature (London) 2000;405:35–36.
62.Utzinger U, Richards-Kortum RR. Fiber optic probes for biomedical optical spectroscopy. J Biomed Opt 2003;8:121–147.
63.Matsuura Y, Miyagi M. Er:YAG, CO, and CO2 laser delivery by ZnS-coated Ag hollow waveguides. Appl Opt 1993;32:6598–6601.
64.Solarization Resistant Optical Fiber, SolarGuide 193 [online], Fiberguide Industries, Inc, Stirling, N.J. Available at www.fiberguide.com.
65.Dougherty TJ, et al. Photodynamic Therapy. J Nat Cancer Inst 1998;90:889–905.
66.Panjehpour M, Overholt DF, Haydek JM. Light sources and delivery devices for photodynamic therapy in the gastrointestinal tract. Gastrointest Endosc Clin N Am 2000;10:513– 532.
67.Brown SB, Brown EA, Walker I. The present and future role of photodynamic therapy in cancer treatment. The Lancet 2004;5:497–508.
See also ENDOSCOPES; OPTICAL SENSORS.
FICK TECHNIQUE. See CARDIAC OUTPUT, FICK
TECHNIQUE FOR.
FIELD-EFFECT TRANSISTORS, ION-
SENSITIVE. See ION-SENSITIVE FIELD-EFFECT TRANSISTORS.
FITNESS TECHNOLOGY. See BIOMECHANICS OF
EXERCISE FITNESS.
FIXATION OF ORTHOPEDIC PROSTHESES. See
ORTHOPEDICS, PROSTHESIS FIXATION FOR.
FLAME ATOMIC EMISSON SPECTROMETRY AND ATOMIC ABSORPTION SPECTROMETRY
ANDREW W. LYON
MARTHA E. LYON
University of Calgary
Calgary, Canada
INTRODUCTION
The observation that atoms of each element can emit and absorb light at specific wavelengths is a fundamental property of matter that fostered the study of chemistry and development of structural models of atoms during the past century. The interaction of light and matter can be traced to use of the lens of Aristophanes 423 BC, and to studies of mirrors by Euclid (300 BC) and Hero (100 BC). Seneca (40 AD) observed the ability of prisms to scatter
316 FLAME ATOMIC EMISSON SPECTROMETRY AND ATOMIC ABSORPTION SPECTROMETRY
Table 1. Selected Wavelengths and Excitation Energies for Alkali and Alkaline Earth Elements
|
Wavelength, nm |
Excitation |
Element |
Light Emission |
Energy, eV |
|
|
|
Lithium |
670.7 |
1.85 |
Sodium |
589.0/589.6 |
2.1 |
Magnesium |
285.2 |
4.34 |
Potassium |
766.5/769.9 |
1.61 |
Calcium |
422.7 |
2.93 |
Manganese |
403.1/403.3/403.4 |
3.07 |
Rubidium |
780.0/794.8/ |
1.56/1.59/ |
|
420.2/421.6 |
2.95/2.94 |
Strontium |
460.7 |
2.69 |
Cesium |
894.3/852.1/ |
1.39/1.45/ |
|
455.5/459.3 |
2.72/2.69 |
Barium |
553.6 |
2.24 |
|
|
|
light and Ptolemy (100 AD) studied angles of incidence and refraction. Sir Isaac Newton (1642–1727) performed many experiments to separate light into its component spectrum described in the 1718 volume Opticks: or, a treatise of the reflections, refractions, inflections and colours of light (sic).
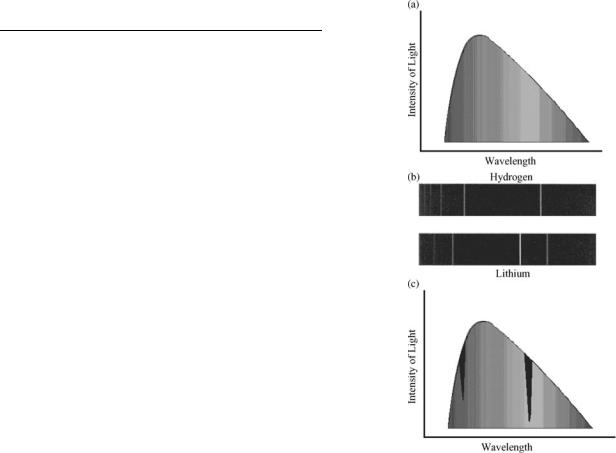
The scientific basis of flame emission spectrometry (also called flame photometry) arose from studies of the light emitting and absorbing behaviors of matter when introduced into a flame. Observations can be traced to Thomas Melvill (1752), who observed the change of color and intensity of light when different materials were introduced into flames (1). Wollaston (1802) separated candlelight by a prism and noted that it contained a bright yellow line (2). The term line spectra is used to describe spectra composed of discontinuous narrow bands of light wavelengths or lines of different colors. Herschel (1822) observed different spectral diagrams for different salts and Talbot suggested that the yellow light indicated the presence of soda (various forms of sodium carbonate) (3,4). In 1860, Kirchhoff and Bunsen reported the correlation of spectral lines with specific elements by introducing solutions into a Bunsen burner using a platinum wire or hydrogen spray (5). This body of work is Table 1 is depicted in Fig. 1 and summarized by Kirchhoff’s laws of spectroscopy that describe emission and absorption of light by matter. Kirchhoff’s laws are a hot solid, liquid, or gas, under high pressure, gives off a continuous spectrum; a hot gas, under low pressure, produces a bright line or emission line spectrum; a dark line or absorption line spectrum is seen when a source of continuous spectrum is viewed behind a cool gas at low pressure.
In 1930, Lundegardh developed the first practical method for quantitative spectrochemical analysis by showing that the intensity of light emitted at specific wavelengths represented the concentration of an element being introduced into a flame (6,7). Flame emission methods were rapidly developed to determine alkali and alkaline earth metals. With the introduction of interference filters by Leyton and Ivanov in the 1950s to select narrow bands of wavelengths of light, multichannel flame emission photometers were developed that allow quantification of several elements simultaneously (potassium, sodium, lithium) from a single flame (8,9).
Figure 1. Emission and absorption spectra: (a) A continuous spectrum emitted from a hot solid, liquid, or gas under pressure.
(b) A line spectrum emitted from a low pressure hot gas. (c) A dark line or absorption spectrum observed when a continuous spectrum is viewed behind a cool gas at low pressure.
Following the development of commercial flame emission photometers, clinical laboratories used the analyzers to measure sodium and potassium concentrations in body fluids from the mid-1950s until the mid-1970s, when potentiometric technologies largely replaced this technology. Flame emission photometers were initially retained in clinical laboratories to allow monitoring of serum lithium in patients treated with oral lithium salts as a therapy for manic depressive disorders. The rugged and reliable flame emission photometers are still used in specialized clinical laboratories to analyze fluid matrices that can render potentiometric analyses unstable (e.g., the analysis of stool electrolyte concentrations).
In addition to flame, other energy sources can be used to produce atomic emission spectra in the ultraviolet (UV) and visible regions including electric arc, electric spark, or inductively coupled plasma. The use of higher temperature energy sources to induce emission allows this technology to assess quantitative elemental composition of materials. These high energy instruments are used to support analysis of specimens for geology, manufacturing, and clinical toxicology.
FLAME ATOMIC EMISSON SPECTROMETRY AND ATOMIC ABSORPTION SPECTROMETRY |
317 |
Kirchhoff’s third law describes the absorption of specific wavelengths of light by cool gases, the basis of atomic absorption spectrometry. In the 1950s, Walsh (10) and Alkemade and Milatz (11) independently reported the analytical potential of light absorption by atoms in a flame, extending the observation that Woodson (12) reported for determination of mercury in air. The temperature of the flame is sufficient to disperse atoms in a low density gaseous phase, enabling the atoms of individual elements to absorb light at specific wavelengths. An intermittent external light source is used to assess light absorption by atoms in the flame while the continuous light emission from the flame is measured and subtracted. Hollow cathode lamps were subsequently developed that enabled atomic absorption methods to achieve both greater sensitivity and selectivity than flame emission photometry and many more analytical applications. The development of electrothermal atomic absorption spectrometers and preanalytical derivitization of chemicals into compounds that minimize interference during analysis make this technology a valuable part of analytical laboratories. Clinical laboratories continue to use atomic absorption spectrometric methods to evaluate the concentration of lead, copper, zinc, and other trace metal elements in body fluids.
THEORY: FLAME ATOMIC EMISSION SPECTROMETRY
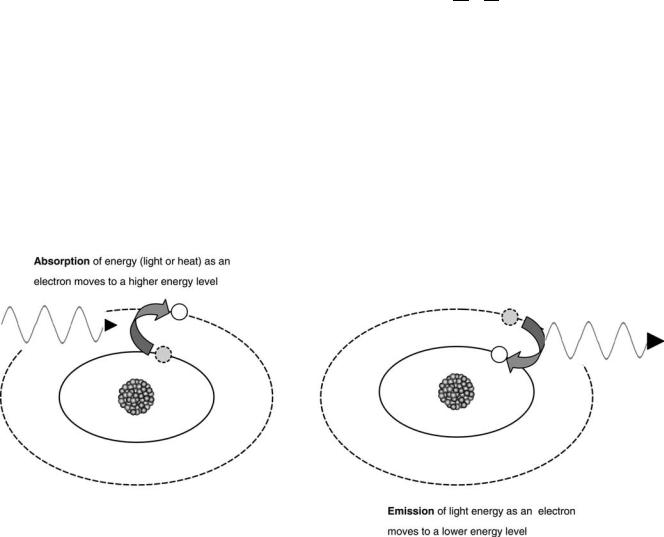
A theoretical basis for flame emission spectrometry can be described using a model of the atom, where the atom is composed of a nucleus surrounded by a cloud of electrons that fluctuate between different energy levels. The temperature of a solution of salt is rapidly elevated when the solution is introduced into a flame. The solvent evaporates and most metallic ions are reduced to the elemental neutral atom state by free electrons in the flame. A small propor-
tion of monatomic ions are also formed. The temperature of the flame can confer sufficient quantum energy to excite electrons in a low energy level to a higher energy state, however, the higher energy state is inherently unstable. When the unstable high energy electron returns to the ground state, energy is released from the atom in the form of monochromatic light; a spectral line that is characteristic of that atom and energy transition. The analysis of the intensity and wavelengths of the line spectra emitted from materials in high temperature sources is the basis of flame atomic emission spectrometry, Fig. 2.
The intensity of light in the line spectra is related to the number of atoms with electrons in the higher energy level. The relationship between number of atoms in each energy state (N0: ground state or N1 elevated energy state) is dependent on the temperature: T, and the size of the energy interval between the ground state and elevated energy state: E1–E0. This relationship is depicted by the Boltzmann equation:
N1 ¼ P1 eðE1 E0Þ=kT
N0 P0
The important features of this equation are that the ratio of atoms in each energy state (N1/N0) is dependent on the magnitude of the quantity (E1 E0)/kT. As temperature increases, the number of atoms in the high energy state increases in an exponential manner. The values P1 and P0 are the quantum mechanical properties called statistical weights and represent the number of ways in which an atom can be arranged in a given state.
The Boltzmann equation describes the proportion of atoms with electrons in an excited or high energy state at specific temperatures. As electrons decay from excited states to lower energy states, light energy is released in discrete energy intervals associated with the line spectrum for that element. The relationship between the light energy
Figure 2. A model of the atom depicting (left panel) the absorption of energy associated with an electron moving to a higher energy state or (right panel) the emission of light energy associated with an electron moving to a lower energy state.

318 FLAME ATOMIC EMISSON SPECTROMETRY AND ATOMIC ABSORPTION SPECTROMETRY
released and the wavelength or color of light emitted is described by Planck’s law: E: Energy of electron transition (J), h: Planck’s constant (J s), c: speed of light (m/s), l: wavelength of light (m 1).
E ¼ hc=l
Atoms can have electrons at many different energy levels and this results in line spectra emissions at many different wavelengths. When a flame has limited energy and the atoms are at low density, only a small fraction of atoms are excited and only a simple line spectrum of low energy wavelengths is observed. Line spectra are characteristic of each element allowing analysts to measure emitted light to determine the chemical composition of solutions in a flame or the chemical composition of a star, based on starlight Table 1 (13). For example, the line spectrum of sodium is characterized by an intense doublet of yellow lines at 589 and 589.6 nm. The intensity of light at 588–590 nm can be measured in a flame photometer to measure the concentration of sodium in a fluid. Other alkali metals have low excitation energy that results in emission of light at longer wavelengths. Lithium and rubidium produce a red color and potassium a red-violet color when introduced into a flame. Higher energy associated with higher temperatures is required for many other elements to emit light in the visible or UV regions. To achieve the higher temperatures, electrical arc, spark, ionized gases or plasmas are used to induce light emission instead of a cooler conventional flame. The inductively coupled plasma atomic emission spectrometer (ICP–AES) (also called an inductively coupled plasma optical emission spectrometer, ICP–OES) devices are versatile instruments capable of measuring elemental composition with high sensitivity and accuracy and are currently used to detect trace elements and heavy metals in human urine or serum. The ICP–AES devices use temperatures in excess of 5000 8C and can achieve resolution of 0.0075–0.024 nm.
The line spectra of pure elements often contains doublets, triplets, or multiplets of emission lines. Planck’s law implies there is very little difference in energy level associated with spectral lines that have similar wavelengths. Spectral line splitting is attributed to the quality of electron spin that can have two quantum values of slightly different energy. Doublets are observed from atoms with a single outer electron (with two possible electron spin values), triplets from atoms with two outer electrons and multiplets from atoms with several outer electrons. High resolution instruments are required to distinguish some of the multiplet lines. With use of high temperature flames or ICP source and high resolution instruments, the spectra of atoms, ions, and molecules can be observed. Alkaline earth metals can become ionized and the resulting cations can generate emission spectra. Oxides and hydroxides of alkaline earth metals can be present in samples or generated in the flame and can also generate emission spectra. In practice, an emission wavelength used to measure an element is selected when the line provides sufficient intensity to provide adequate sensitivity and the line is free from interference from other lines near the selected wavelength. The amount of light emitted at a specific emission wavelength may not be sufficient for analysis. For this reason, flame
emission spectrometry methods may not be applicable and alternate methods, such as atomic absorption spectrometry or inductively coupled plasma mass spectrometry, may be preferred.
THEORY: ATOMIC ABSORPTION SPECTROMETRY
Atomic absorption spectrometry developed from the observations used to establish Kirchhoff’s third law: ‘That a dark line or absorption line spectrum is seen when a source of continuous spectrum is viewed behind a cool gas under pressure’ (Fig. 1). When a sample is introduced into a flame, only a small fraction of the atoms are in an excited or high energy state (according to the Boltzmann equation) and most atoms of the element remain in the unexcited or ground state and are capable of absorbing energy. If light energy is provided as a continuous spectrum, ground-state atoms will selectively absorb wavelengths of light that correspond with the energy intervals required to excite electrons from low energy to higher energy levels. The wavelengths of light that are absorbed as electrons are excited from groundstate tohigherenergylevelsareanalogoustothe wavelengths of light emitted as high energy electrons return to the ground state. The advantage of atomic absorption spectrometry is that most of the atoms in a flame remain in the unexcited ground state and are capable of light absorption, allowing this method to be 100-fold more sensitive than flame emission spectrometry.
Atomic absorption of light is described by an equation analogous to the Lambert–Beer law. The absorbance of light, A, is defined as the logarithm of the ratio of initial light beam intensity I0 to the intensity of the beam after light absorption, I. The absorbance of light is directly proportional to the concentration of absorbing atoms c and the path length of the light beam in the atoms d. The value k is a constant referred to as the absorptivity constant.
A ¼ log I0 ¼ kcd I
The emission of characteristic wavelengths or colors of light from materials in a flame was initially observed by the unaided human eye and preceded the measurement of atomic absorption that required instrumentation. To observe atomic absorption of light, a beam of light was passed through atoms introduced to a flame and the ratio of initial and postabsorption light beams was determined. However, the light beam emitted from the flame also contains light derived from the combustion of materials in the flame that was not present in the initial light beam. To measure the atomic absorption of light, the intensity of background light emitted from the flame itself must be subtracted from the postabsorption light beam intensity prior to calculating the absorbance. Electrothermal atomic absorption (also called flameless atomic absorption or graphite furnace atomic absorption) uses an electrically heated furnace to atomize the sample. By design, the electrothermal instruments have greater sensitivity and lower detection limits because analyte atoms can achieve higher gaseous
|
FLAME ATOMIC EMISSON SPECTROMETRY AND ATOMIC ABSORPTION SPECTROMETRY |
319 |
||
|
Slit |
|
Readout |
|
|
|
|
system |
|
Premix |
|
|
|
|
burner |
|
|
|
|
Nebulizer |
Diffraction grating |
Detector |
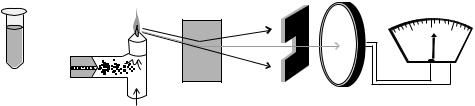
Figure 3. Components of a flame |
|
|
||||
|
|
|
||
|
Fuel+O2 |
|
atomic emission spectrometer. |
|
concentrations and residence time in the light beam and there is less background light emission.
The sensitivity of atomic absorption methods was improved by using light sources that generated wavelengths of light that exactly matched the wavelength of maximum absorption by the element undergoing analysis. The light sources are referred to as hollow cathode lamps. These lamps heat a small amount of the element of interest and generate line spectra emission for the light beam at wavelengths that exactly match the wavelengths maximally absorbed by atoms of that element in the ground state in the flame. Often hollow cathode lamps contain a single element, however, multielement lamp sources with six or more elements are commercially available.
EQUIPMENT
Flame Atomic Emission Spectrometry
The components of a flame photometer are illustrated schematically in Fig. 3 and consist of a nebulizer within a spray chamber, a premix burner, flame, monochromator, detector, and readout system. The monochromator, detector, and readout systems are similar to those used in a spectrophotometer: monochromatic light is obtained by means of an interference filter or diffraction grating, a detector consisting of a photomultiplier tube, result display (visual meter, digital display, or data capture a computer system), and the flame serves as a light source and sample compartment.
Each of the basic components of the instrument contributes to the analytical process. Various combinations of combustible gases and oxidants can be used to create flames with different temperatures (e.g., acetylene, propane, natural gas, oxygen, compressed air). The nebulizer is an important component responsible for mixing the analyte liquid with compressed air and converting it into a fine mist that enters the flame. For precise analytical measurements, the nebulizer must create a mist of consistent composition (10–15% of the aspirated sample) and mix the mist into the gases that combust to create a consistent flame. Within the spray chamber, large droplets settle out and are drained to waste, and only a fine mist enters the flame. A wetting agent (e.g., a nonionic detergent) may be added to standards and samples to minimize changes in nebulizer flow rates that result from differences in the viscosity or matrix of samples.
The intensity of emitted line spectra from atoms excited in the flame must be discriminated from other light in the flame. Less sophisticated instruments (e.g., flame photo-
meters) rely on filters with narrow bandpass to eliminate background light emitted from the flame. Diffraction gratings are used as monochromators in more sophisticated instruments with a slit to limit the bandwidth of light being detected.
To improve the reliability, an internal standard may be used when designing a method. Usually an element not present in the sample is introduced into the calibration standards, quality control, and unknown solutions. In biological applications, lithium or cesium is frequently used for this purpose. By measuring the ratio of emission light intensity of the target element to the internal standard, there is compensation for small variation in nebulization rate, flame stability and solution viscosity, and methods perform with greater precision. Addition of either lithium or cesium to all solutions can also prevent interference by acting as an ionization buffer (previously referred to as a radiation buffer). A relatively high concentration of an alkali metal ion in the solutions creates a buffer mixture of its ionic and atomic species and free electrons in the flame. The elevated free-electron concentration in the flame represses and stabilizes the degree of ionization of analyte atoms and improves the atomic emission signal.
Inductively coupled plasma emission spectrometers have similar components. The sample is nebulized into argon gas that is heated to extreme temperatures (>5000 8C) that efficiently breaks molecular bonds to generate gaseous atoms. Because few molecules exist at these temperatures, ICP–AES has few chemical interferences compared to flame techniques, however, because of the high temperature and large proportion of atoms and ions that emit light, ICP–AES methods are more prone to spectral interferences associated with inadequate resolution of spectral lines.
Atomic Absorption Spectrometry
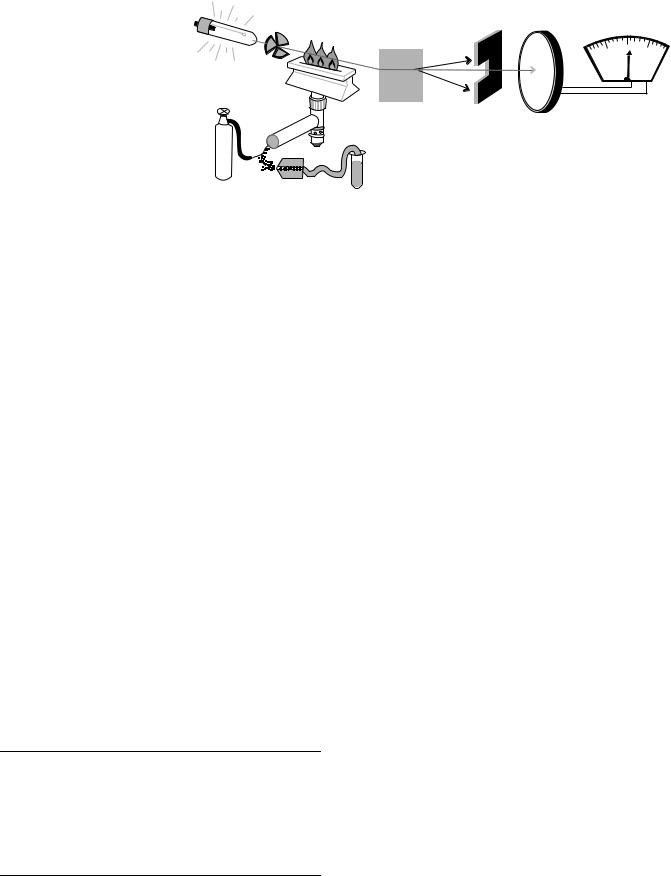
The components of a flame atomic absorption spectrometer are illustrated schematically in Fig. 4 and consist of a nebulizer, premix burner, hollow cathode lamp, modulation system or beam chopper, flame, monochromator, detector, and readout system. The monochromator, detector, and readout systems are similar to those used in a spectrophotometer. Monochromatic light is obtained by isolating a single spectral line emitted from a hollow cathode lamp using an interference filter. The detector is a photomultiplier tube and the results can be displayed by a visual meter, digital display, or captured by a computer system. The flame serves as a sample compartment and
320 FLAME ATOMIC EMISSON SPECTROMETRY AND ATOMIC ABSORPTION SPECTROMETRY
Beam |
Readout |
|
chopper |
||
system |
||
|
||
|
Flame |
|
|
Slit |
Hollow cathode lamp
Difraction grating |
Detector |
Sample
Figure 4. Components of a flame |
Fuel |
atomic absorption spectrometer. |
Nebulizer |
+ O2 |
light from the hollow cathode lamp is passed through the flame to measure absorption. Electronic modulation or a mechanical beam chopper is used to interrupt the light from the hollow cathode lamp into pulses so the extraneous light emitted from the flame alone can be measured and subtracted prior to measuring atomic absorption.
Electrothermal atomic absorption instruments typically use a graphite furnace to rapidly heat a sample in a uniform manner to 2600 8C. Samples are typically introduced into the furnace on a carbon rod. As the temperature is raised, the samples are dried, charred, rendered to ash, and atomized (e.g., Table 2). Hollow cathode lamps are used as a source of monochromatic light to determine atomic absorption. In contrast to flame-based methods that rapidly dilute and disperse analyte atoms, electrothermal methods retain atoms at higher concentrations with longer residence time in the light beam. In addition, there is less extraneous background light. These advantages allow electrothermal atomic absorption instruments to measure many trace elements and heavy metals not capable of measurement with flame atomic absorption instruments (15).
There are four categories of interference that can occur with atomic absorption spectrometry: chemical, spectral, ionization, and matrix. The element undergoing analysis may exist or form stable molecules within the flame. The atoms in the stable molecules do not generate line spectra at the characteristic wavelengths of the free atoms and this chemical interference results in a negative analytic bias for the method. Spectral interference can occur when there is nonspecific absorption of light by material in the sample. Nonspecific absorption of light can be caused by solids or
Table 2. Graphite Furnace Settings for Blood Lead Determinationa
|
|
Ramp |
Hold |
Gas flow, |
Stage |
Temperature, 8C |
Time, s |
Time, s |
L min 1 |
Dry |
120 |
5 |
15 |
300 |
Preash |
260 |
1 |
5 |
300 |
Ash |
800 |
5 |
27 |
300 |
Cool |
20 |
1 |
4 |
300 |
Atomize |
1600 |
0 |
5 |
0 |
Clean |
2700 |
1 |
2 |
300 |
aSee Ref. 14.
particles in the flame. Spectral interference can often be reduced by performing maintenance on the burner head to remove residues and assure a steady flame is maintained. Emission of light from other components in the flame can interfere with analysis and can often be removed with a background correction method. Ionization interference occurs when atoms in the flame are converted to ions that will not absorb the line spectra at the characteristic wavelengths for the atoms. Ionization interference can be reduced by an ionization buffer or by lowering flame temperature to reduce the extent of ionization. Matrix interferences occur when the calibration standards have a different composition than the samples (e.g., viscosity, salt concentration or composition, pH, or presence of colloids, e.g., protein). Matrix interferences can be avoided in the method design by assuring calibrator solutions have similar composition to the samples or that samples are highly diluted so they acquire a matrix similar to the calibrator solutions.
Several methods have been developed to improve the sensitivity of atomic absorption by reducing background radiation spectral interference. Electronically modulated light beams or mechanical beam choppers have been used to generate pulsed light so the background emission of light from the flame can be distinguished, measured and subtracted. Analogous to molecular absorption spectrophotometers, atomic absorption spectrometers can have a single beam design (Fig. 4) or a split double-beam design where the beam modulator acts as a beam splitter to create the light beam that passes through the sample and a second beam that acts as a reference. Split double-beam instrumentation has an advantage of compensating for variation in light intensity from the lamp or variation of detector sensitivity.
In electrothermal atomic absorption methods, the rapid heating of samples can cause the release of smoke or nonspecific vapor that blocks some light from reaching the detector. To correct for this nonspecific light scatter, in addition to the beam from a hollow cathode lamp, a beam from a deuterium continuum lamp can be direct through the sample chamber and light intensity measured at a wavelength other than that used for the assay to assess the extent of light scatter.
A third method of background correction is based on the Zeeman effect. When atoms are placed in a strong magnetic
FLAME ATOMIC EMISSON SPECTROMETRY AND ATOMIC ABSORPTION SPECTROMETRY |
321 |
field, the emission and absorption line spectra are dramatically altered as the single line spectra are split into triplets or more complex patterns. Splitting of a spectral line into two different wavelengths implies that the electrons involved have slightly different energy levels, according to Planck’s law. The small difference in the energy levels is attributed to slightly different quantum numbers for the electrons involved and this difference in energy level can only be detected in the presence of the magnetic field. In the absence of the magnetic field, slight differences in energy levels are not apparent and a single wavelength of absorption or emission is observed. By turning the magnetic field off and on during atomic absorption spectrometry, the population of atoms being tested is modulated from a uniform population to discrete populations with different quantum numbers. By measuring the element-specific difference in atomic absorption as the magnetic field is modulated, nonspecific background absorption or emission can be accurately subtracted. Implementation of instruments with Zeeman correction is complex, expensive, and requires optimization of the magnetic field for each element. Consequently, Zeeman correction approaches are usually reserved for methods involving strong background interferences.
MEDICAL APPLICATIONS
Flame emission spectrometry and atomic absorption spectrometry are sophisticated methods of elemental analyses that are robust and flexible techniques that have been applied to the analysis of many different types of biological or clinical samples. In the 1950s and 1960s, use of flame photometers provided state-of-the-art accurate and precise determinations of serum, sodium, and potassium. Stable, reliable, and inexpensive potentiometric methods for determination of electrolyte concentrations were developed and replaced flame photometric methods for most medical applications. The hardy reliable nature of flame photometers is still used for some analysis (e.g., the determination of stool electrolytes). While flame emission photometric methods can be applied to determine the concentration of trace elements or heavy metals in biological specimens, many clinical laboratories use electrothermal atomic absorption spectrometry or inductively coupled plasma mass spectrometry that offer greater specificity, sensitivity, precision, and adaptability.
Flame emission spectrometric determinations are prone to negative bias when biological samples undergoing analysis have high concentrations of lipid or protein (16). Biological samples are mixed with a diluent to create a mist in the nebulizer and the mist is created by mixing constant proportions of each fluid. However, when a biological fluid has a high concentration of lipid or protein, the constant volume of sample fluid has a reduced amount of aqueous dissolved ions because lipid particles suspended in the fluid occupy volume and reduce the volume of water available to dissolve the ions. In a similar manner, proteins bind water molecules creating a hydration shell and at high concentration in an aqueous solution, the proteins occupy volume in the sample and reduce the volume of water available to dissolve ions. This negative bias is known as
Flame AA
|
|
|
|
|
|
ICP-AES |
|
|
|
|
|
|
|
|
|
|
|
GFAA |
|
|
|
|
|
|
|
|
|
|
|
|
|
|
|
||
|
|
ICP-MS |
|
|
|
|
|
|
|
|
|
|
|
|
|
|
|
100 |
10 |
|
1 |
0.1 |
0.01 |
|
0.001 |
|
|
|
Detection Limit Ranges (ppb or g L–1) |
|
|||||
Figure 5. Typical detection limit ranges for major spectrometry techniques. Flame atomic absorption, inductively coupled plasmaatomic emission spectrometry, graphite furnace atomic absorption, inductively coupled plasma–mass spectrometry (19).
the volume exclusion effect. The term pseudohyponatremia is used to describe the misleading low serum sodium concentrations attributed to this bias. This volume exclusion effect was initially characterized with flame photometers and it remains a concern with potentiometric instruments that use indirect electrodes and rely on sample dilution (17).
The use of atomic absorption spectrometers in clinical laboratories for the determination of calcium, magnesium, and other metal cations reached a peak in the 1970s. In the following decades, potentiometric methods became commercially available for the most common tests (e.g., calcium, magnesium, sodium, and potassium) and atomic absorption spectrometers were not commonly used in each hospital laboratory. A concise review of the history of atomic absorption spectrometry application in clinical chemistry was published in 1993 (18). The atomic absorption spectrometer remained an important platform for the determination of serum zinc, copper, and lead. Medical laboratory services have often been consolidated, and infrequent tests (e.g., serum zinc, copper, lead, trace elements, and heavy metals) are shipped to reference laboratories for analyses. While inductively coupled plasma mass spectrometry offers greater sensitivity and flexibility of analysis, flame and electrothermal atomic absorption spectroscopic methods remain cost-effective, precise analytic methods, widely used in clinical reference laboratories to support the evaluation of serum or blood concentrations of zinc, copper, aluminum, chromium, cadmium, mercury and lead (Fig. 5).
BIBLIOGRAPHY
Cited References
1.Melvill T. Observations on light and colors, Essays Observ. Phys Lit Edinburgh 1756;2:12–90.
2.Wollaston WH. A method of examining refractive and dispersive powers. Philos Trans R Soc London 1802;92:365–380.
3.Herschel JFW. On the absorption of light by coloured media. Trans R Soc Edinburgh 1823;9:445–460.
4.Talbot HF. Some experiments on colored flames. Edinburgh J Sci 1826;5:77–81.
5.Kirchhoff G, Bunsen R. Chemical analyses by means of spectral observations. Ann Phy (Leipzig) 1860;110(2):160–189.