

150 ELECTRORETINOGRAPHY
ELECTRORETINOGRAPHY
GRAHAM E. HOLDER
Moorfields Eye Hospital
London, United Kingdom
INTRODUCTION
The retina, situated at the back of the eye, is highly complex, consisting of different layers and containing many different cell types. It serves to encode images of the outside world into a suitable form for transmission to the brain for interpretation and the process of ‘‘seeing’’. It is possible to view the retina in situ using ophthalmoscopic techniques, and although this may reveal anatomical abnormalities, it may not reveal either the extent or nature of retinal dysfunction. The principal challenge for electroretinography is to provide information regarding retinal function to facilitate patient care.
In essence, a controlled light stimulus is used to stimulate the retina, which responds by generating very small electrical signals that can be recorded, with suitable amplification, using electrodes situated in relation to the eye, usually contacting the cornea. These electrical signals, the electroretinogram (ERG), have defined parameters (timing, shape, size) in normal individuals, and are altered in a predictable manner in disease. In general, the brighter the stimulus, the higher is the amplitude and the shorter the peak time of the ERG. Modification of the adaptive state of the eye (dark adapted or scotopic; light adapted or photopic) facilitate the separation of different cell types and layers within the retina. The objective information provided by electrophysiological examination has a significant effect both on diagnosis and patient management (1).
TECHNIQUES
The main tests of retinal function are the ERG, the massed retinal responses to full-field luminance stimulation, which reflects the function of the photoreceptor and inner nuclear layers of the retina, and the pattern electroretinogram (PERG), which, in addition to being ‘‘driven’’ by the macular photoreceptors, largely arises in relation to retinal ganglion cell function. Knowledge of this latter response can also be particularly useful in improved interpretation of an abnormal cortical visual evoked potential (VEP), but that topic is beyond the remit of this contribution, and the reader is referred elsewhere for a full discussion of the interrelationships between PERG and ERG, and PERG and VEP (2). Brief reference will also be made to the electrooculogram (EOG), which examines the function of the retinal pigment epithelium (RPE) and the interaction between the RPE and the (rod) photoreceptors, and is often used in conjunction with the ERG.
Electrophysiological recordings are affected not only by stimulus and recording parameters, but also by the adaptive state of the eye, and standardization is mandatory for meaningful scientific and clinical communication between laboratories. The International Society for Clinical Electrophysiology of Vision (ISCEV) has published Standards
for EOG (3), ERG (4), PERG (5), and the VEP (6). Readers are strongly encouraged not only to adhere to the recommendations of those documents, but also to consider that the Standards are intended as minimum data sets, and that recording protocols in excess of the Standards may be necessary to accurately establish the diagnosis in some disorders. Typical normal traces appear in Fig. 1.
A brief description of each test follows, with emphasis on response generation. Referencing has been restricted; the reader is referred to standard texts for further details (7,8). The multifocal ERG (mfERG) is a relatively recent addition to the diagnostic armamentarium, and although currently more of a research application than a mainstream clinical tool, this is likely to change in the future as more knowledge is gained of the clinical applications and underlying mechanisms. The ISCEV has published guidelines for mfERG, to which the reader is referred (9).
THE ELECTROOCULOGRAM
The EOG enables assessment of the function of the RPE, and the interaction between the RPE and the retinal photoreceptors. The patient makes fixed 308 lateral eye movements during a period of 20 min progressive dark adaptation, followed by a 12–15 min period of progressive light adaptation. The eye movements are made every 1–2 s for 10 s each minute. The amplitude of the signal recorded between electrodes positioned at medial and lateral canthi reaches a minimum during dark adaptation, known as the dark trough, and a maximum during light adaptation, the light peak. The development of a normal light peak requires normally functioning photoreceptors in contact with a normally functioning RPE, and reflects progressive depolarization of the basal membrane of the RPE. The EOG is quantified by calculating the size of the light peak in relation to the dark trough as a percentage, the Arden index. A normal EOG light rise is >175% for most laboratories.
THE ELECTRORETINOGRAM
The functional properties of the retinal photoreceptors underpin the principles of ERG recording. The retinal rod system, with 120,000,000 rod photoreceptors, is sensitive under dim lighting conditions, has coarse spatial and poor temporal resolution. The rods adapt slowly to changes in lighting conditions. They do not enable color vision. They have a peak spectral sensitivity in the region of 500 nm. There are three types of retinal cone. (1) Short wavelength (S-cone), (2) medium (M-cone), and (3) long wavelength (L-cone). In the past, they have been referred to as blue, green, and red, respectively. There are perhaps 7,000,000 M- and L-cones and 800,000 S-cones. The relative proportion of L- versus M-cones varies from individual to individual, but approximates to 50% over a population. They are sensitive under bright lighting conditions; their high spatial resolution enables fine visual acuity; they adapt rapidly to changes in lighting conditions and can follow a fast flicker (L- and M-cones). The overall maximum spectral sensitivity is 550 nm, in the green-yellow
|
|
|
|
|
|
|
|
ELECTRORETINOGRAPHY |
151 |
||
400 µV |
|
400 µV |
|
200 µV |
|
200 µV |
|
4 |
µV |
|
|
|
|
|
|
2 |
µV |
|
|
||||
200 µV |
|
200 µV |
|
100 µV |
|
100 µV |
|
|
0 V |
|
|
|
|
|
|
−2 |
µV |
|
|
||||
0 V |
|
0 V |
|
0 V |
|
0 V |
|
|
|
||
|
|
|
|
−4 µV |
|
|
|||||
0S |
100ms |
0S |
100ms |
0S |
50ms |
0S |
50ms |
|
0S |
100ms |
|
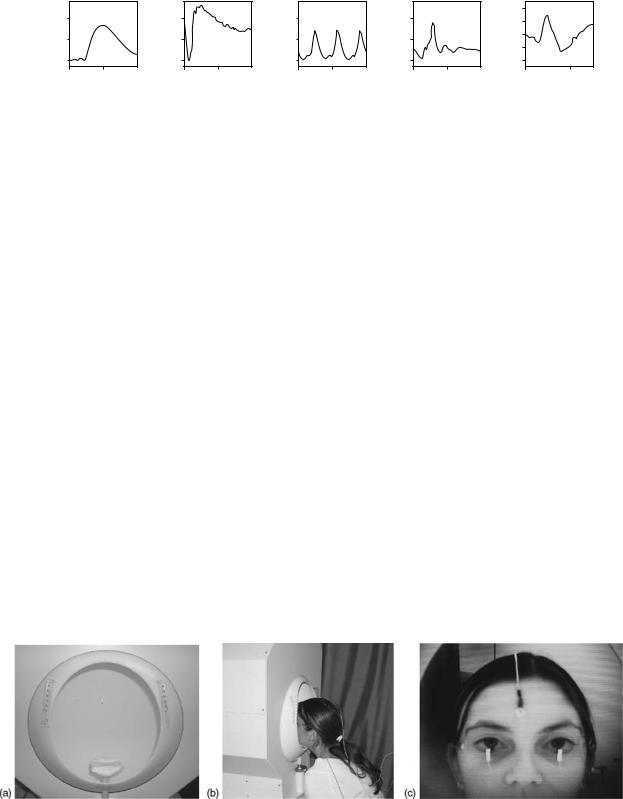
Figure 1. Typical normal ERG recordings. The rod specific ERG consists of the inner-nuclear layer generated b-wave. With a bright flash the waveform now contains an additional a-wave, the first 10– 12 ms of which arise in relation to photoreceptor hyperpolarization. The rod specific and bright flash responses are recorded with full scotopic adaptation. After restoration to photopic adaptation the cone flicker and single flash ERGs are recorded. The former consists of a sinusoidal type waveform, the latter containing clear a- and b-waves. The pattern ERG (PERG) is the response of the macula to a reversing black and white checkerboard. See text for further details.
region of the color spectrum. Normal color vision requires all three cone types, but providing at least two cone types are present (there are some disorders in which that is not the case), at least some color vision is enabled. There are no S-cones in the foveola, the very central part of the macula responsible for very fine acuity.
The ERG is recorded using corneal electrodes and is the mass electrical response of the retina using a brief flash of light as a stimulus. The stimuli are delivered using a Ganzfeld bowl, an integrating sphere that enables uniform whole field illumination (Fig. 2a, b). In addition to flash stimulation, the Ganzfeld also allows a diffuse background for photopic adaptation. Some corneal electrodes are bipolar contact lenses with a built-in reference electrode. If such an electrode is not used, the reference electrodes should be sited at the ipsilateral outer canthi. A standard flash is defined by ISCEV as 1.5–3.0 cd s m 2. The response to this flash under scotopic conditions, with a fully dilated pupil, is the Standard or mixed response (Fig. 1). It is probably this response that may be regarded as the ‘‘typical’’ ERG, but although there is a cone contribution, the standard response is dominated by rod driven activity. The ‘‘maximal’’ ERGs that appear in this article were recorded to 11.0 cd s m 2 flash better to view the a-wave. The use of a brighter flash of such intensity is ‘‘suggested’’ in the most recent ISCEV ERG Standard (4). The initial 10 ms of the a-wave arises in relation to hyperpolarisation of the (rod) photoreceptors and the slope of the a-wave can be
related to the kinetics of phototransduction (10). The larger positive b-wave is generated postreceptorally in the innernuclear layer of the retina in relation to depolarization of the ON-bipolar cells (11). The oscillatory potentials, the small wavelets on the ascending limb of the b-wave, are probably generated in relation to amacrine cell activity. When the standard flash is attenuated by 2.5 log units, the stimulus intensity falls below the cone threshold, and a rod-specific b-wave is obtained. At this relatively low luminance there is insufficient photoactivation to record an a-wave (Fig. 1, column A, top).
The ERGs that reflect cone system activity are obtained using a rod-saturating photopic background (17– 34 cd m 2) using superimposed single flash and 30 Hz flicker stimulation. The rod system has low temporal resolution and use of a 30 Hz stimulus, combined with a rodsuppressing background, allows a cone-system specific waveform to be recorded. This response is probably the more sensitive measure of cone dysfunction, but is generated at an inner-retinal level (12) and thus does not allow the distinction between cone photoreceptor and cone innernuclear layer dysfunction. Although there is a demonstrated contribution from hyperpolarizing (OFF-) bipolar cells to shaping the photopic a-wave (13), this component nonetheless has some contribution from cone photoreceptor function, and some localization within the retina may be obtained with the single flash cone response. The cone b-wave reflects postphototransduction activity, and to a
Figure 2. (a) A conventional Ganzfeld used for ERG recording (front view). (b) The subject in position at the Ganzfeld. (c) Photograph taken using an infrared (IR) camera at the back of the Ganzfeld, which is used to monitor eye position and eye opening during both dark adapted and light adapted conditions. The two gold-foil corneal recording electrodes are well seen. The central forehead ground electrode is easily seen; the outer canthus reference electrodes are just visible. (Courtesy of Chris Hogg.)
152 ELECTRORETINOGRAPHY
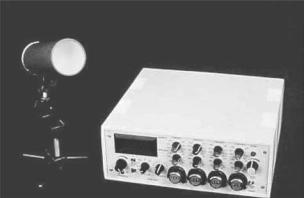
Figure 3. A ‘‘mini-Ganzfeld’’ based on light emitting diode technology. The device shown has four independent color channels, blue, green, orange and red, each of which can be used as stimulus or background alone or in combination. (Courtesy of Chris Hogg, CH electronics, Bromley, Kent, UK; www.ch-electronics.net.)
short flash stimulus ON and OFF activity within the photopic system is effectively synchronized.
Separation of the cone ON (depolarizing bipolar cells, DBCs) and OFF (hyperpolarizing bipolar cells, HBCs) responses can be achieved using a long duration stimulus with a photopic background (14,15). The stimulus can be generated either via a shutter system or by using light emitting diodes (Fig. 3). Stimulators based on light emitting diodes (LEDs) offer several advantages over standard stimulators. They are of low cost, have a stable output intensity over time (reducing the need for calibration), enable variable and highly accurate stimulus duration, and a have a well-defined narrow band spectral output. Further, being driven by relatively low voltage and current, they are intrinsically safe, and generate low electrical noise. Their use in ERG systems can be expected to increase.
It is also possible to elicit the activity of the S-cone population. In the author’s laboratories this is achieved using blue stimuli superimposed upon a bright orange photopic background, again delivered using a LED based device. The background thus serves to suppress activity from rod and L-/M-cone systems. The response under appropriate recording conditions consists of an early component at 30 ms arising in relation to L-/M-cone systems (there is overlap of the spectral sensitivities of the different cone systems and a small response arises from L-/M-cones with a bright blue stimulus), followed by a component specific for S-cone function at 45–50 ms (16).
The retinal ganglion cells do not significantly contribute to the clinical (flash) ERG. Also, as a mass response, the ERG is normal when dysfunction is confined to small retinal areas, and, despite the high photoreceptor density, this also applies to macular dysfunction; the full-field ERG is normal if dysfunction is confined to the macula (e.g., Fig. 4, column B).
THE PATTERN ELECTRORETINOGRAM
The response of central retina to a structured isoluminant stimulus can be measured, and is known as the pattern
ERG. The stimulus is usually a reversing black and white checkerboard. The PERG has largely inner retinal origins, but is ‘‘driven’’ by the macular photoreceptors, and PERG measurement thus provides both a measure of central retinal function and, in relation to its origins, of retinal ganglion cell function. It is thus of clinical importance not only in the objective assessment of macular function, but also in the electrophysiological differentiation between optic nerve and macular dysfunction by providing a measure of the retinal response to a similar stimulus to that used to evoke the VEP (see Ref. 2 for a comprehensive review). It is a much smaller signal than the (full-field) ERG and computerized signal averaging is used to extract the PERG signal.
The PERG is recorded using noncontact lens electrodes in contact with the cornea or bulbar conjunctiva to preserve the optics of the eye. Suitable electrodes are the gold foil (17), the DTL (18), and the H–K loop (19). Ipsilateral outercanthus reference electrodes are essential to avoid contamination from the cortically generated VEP, such as occurs if forehead or ear ‘‘reference’’ electrodes are used (20). Pupillary dilation is not used.
There are two main components of PERG to a reversing checkerboard with a relatively slow reversal rate (<6 reversals s 1). There is a prominent positive component, P50, at 50 ms followed by a larger negative component, N95, at 95 ms (21). Clinical measurement of the PERG usually comprises the amplitude of P50, measured from the trough of the early negative N35 component; the peak latency of P50; and the amplitude of N95, measured to trough from the peak of P50 (Fig. 1). Approximately 70% of P50 is likely to be related to retinal ganglion cell function, but the remainder is not related to spiking cell function and may be generated more distally in the retina (22). The exact origins have yet to be ascertained at the time of writing. The N95 is a contrast-related component generated in the retinal ganglion cells.
An analysis time of 150 ms or greater is usually used for recording the PERG, with 150 averages per trial needed to obtain a reasonable signal-to-noise ratio. As it is a small response, stringent technical controls are important during recording and are fully discussed elsewhere (8). Binocular stimulation and recording is preferred so the better eye can maintain fixation and accommodation, but it is necessary to use monocular recording if there is a history of squint. P50 is sensitive to optical blur, and accurate refraction is needed. At low stimulus frequencies the amplitude of the PERG is related almost linearly to stimulus contrast. A high contrast black and white reversing checkerboard with 0.88 checks in a 10–168 field is recommended by ISCEV.
MULTIFOCAL ERG
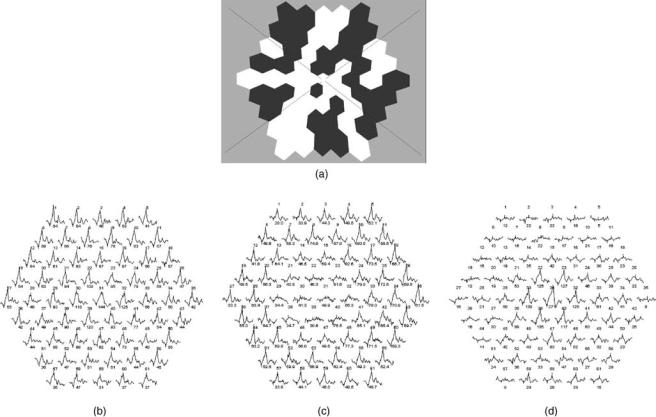
The mfERG attempts to provide spatial information regarding cone system function in central retina. The stimulus usually consists of multiple hexagons displayed on a screen (Fig. 5a) each of which flashes on with its own pseudo-random binary sequence (an M-sequence). A crosscorrelation of the local flash sequence with the mass
ELECTRORETINOGRAPHY 153
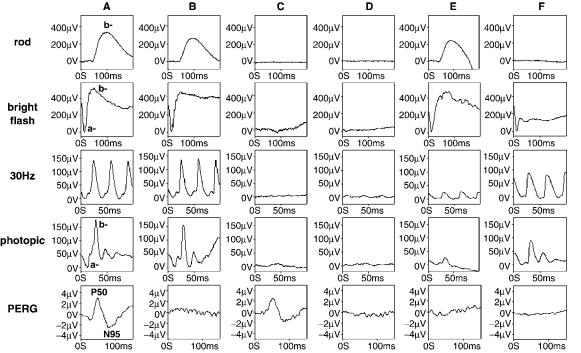
Figure 4. Typical electroretinographic abnormalities in selected diseases compared to those in a normal subject. Column A: Normal subject. Column B: A patient with macular dysfunction; the PERG is undetectable, but full-field ERGs are normal. Column C: ‘‘Classical’’ retinitis pigmentosa; all full-field ERGs are virtually extinguished, but the PERG is normal reflecting sparing of central retinal function. Column D: Rod-cone dystrophy (retinitis pigmentosa); the rod and cone ERGs are markedly abnormal (with the rod ERG being more affected). Note the delayed and reduced cone ERGs, typical abnormalities present when there is generalized cone involvement in the context of photoreceptor degeneration. The abnormal PERG reflects involvement of the macula. Column E: Cone dystrophy; the rod and bright flash ERGs are normal, but the cone single flash and flicker ERGs are delayed and reduced in keeping with generalized cone system dysfunction. The abnormal PERG reflects involvement of the macula. Column F: X-linked congenital stationary night blindness (complete type). The rod specific ERG is undetectable, but the normal a-wave of the bright flash dark adapted ERG confirms the dysfunction to be postphototransduction. There are subtle but significant changes in cone-system derived ERGs (note particularly the broadened trough and reduced amplitude sharply rising peak of the b-wave), and reduction in the PERG.
response derives the responses relating to each individual hexagon thus giving multiple cone system ERG waveforms from a single recording electrode. The mfERG can be of use in disturbances of macular function and to assess the degree of central retinal involvement in generalized retinal disease, but is highly susceptible to poor fixation, and the ability of a patient accurately to maintain good fixation throughout the recording session is a pre-requisite to obtaining clinically meaningful data. Increasing use and development of systems that can control stimulus delivery in relation to eye position can be anticipated. Possibilities include the use of ‘‘eye-tracking’’ devices and direct fundus visualization during stimulation.
CLINICAL APPLICATIONS
EOG
Disorders of rod photoreceptor function can affect the EOG, and the light rise is typically reduced in generalized photoreceptor degenerations such as retinitis pigmentosa (RP,
rod–cone dystrophy), a genetically determined group of disorders. Usually, the reduction in EOG light rise parallels the degree of rod photoreceptor dysfunction, but generalized RPE dysfunction can also manifest a reduced EOG light rise. Indeed, it is the latter property that leads to the main clinical use of the EOG, the diagnosis of Best disease. Best disease, or vitelliform macular dystrophy, is a dominantly inherited macular degeneration related to mutation in the gene VMD2. At presentation there are often distinctive vitelliform lesions at the maculae on funduscopy, but other appearances may occur. The diagnostic findings are of a severely reduced or absent EOG light rise accompanied by normal ERGs. Best disease may present in childhood, but a child may find the repetitive eye movements needed for EOG recording difficult or impossible to maintain for the required 30–40 min. Under such circumstances it is appropriate to test both parents; due to the dominant inheritance pattern one of the disorder, one of the parents will have carry the mutant gene and will manifest a reduced EOG. Adult vitelliform macular dystrophy (pattern dystrophy) may sometimes clinically
154 ELECTRORETINOGRAPHY
Figure 5. (a) the typical multifocal ERG stimulus; (b) a normal subject; (c) a macular dystrophy. There is loss of the responses to central hexagons but preservation of more peripheral responses.
(d) A retinal dystrophy with sparing of central macular function but loss of the responses in the periphery.
be mistaken for Best disease, but although the EOG light rise may be mildly subnormal, it is not reduced to the same extent as in Best disease. The electrophysiological recordings will usually resolve any clinical dilemma in differential diagnosis.
ERG
Although the rod specific ERG b-wave is a sensitive indicator of retinal rod system dysfunction, the fact that it is generated in the inner-nuclear layer of the retina means that reduction in this response does not allow localization of the defect either to those structures or the upstream rod photoreceptors. It is the a-wave of the responses to brighter flashes that directly reflects activity of the photoreceptors and enables the distinction between photoreceptor dysfunction and a primary disorder of inner-retinal function. Genetically determined photoreceptor degenerations, such as the rod–cone (retinitis pigmentosa, RP) or cone–rod dystrophies, thus give overall ERG reduction (Fig. 4, columns C, D). The cone-derived ERGs in generalized photoreceptor degeneration characteristically show abnormalities of both amplitude and timing, particularly evident in the flicker ERG, but RP may occasionally only affect the rod-derived ERGs in the early stages of disease. Truly restricted disease, such as sector RP, is associated
with amplitude reduction, but no implicit time change, whereas diffuse or generalized disease is usually also associated with an abnormally delayed implicit time. Retinitis pigmentosa is associated with pigmentary migration from RPE into retina consequent upon photoreceptor cell death, but the clinical appearance of the ocular fundus may not reflect the severity or nature of the disorder. Electroretinography not only enables accurate diagnosis, when interpreted in clinical context, but may also provide useful prognostic information. There is no rod system involvement in a pure cone dystrophy; such disorders have normal rod responses, but abnormal cone responses, with the 30 Hz flicker response usually showing both amplitude reduction and delay (Fig. 4, column E).
A waveform in which the bright flash a-wave is spared, but there is selective b-wave reduction, is known as a ‘‘negative’’ or electronegative ERG (e.g., Fig. 4, column F, row 2), and is associated with dysfunction postphototransduction, often postreceptoral. For example, in central retinal artery occlusion (CRAO) the finding of a ‘‘negative’’ ERG reflects the duality of the retinal blood supply, with the photoreceptors supplied via choroidal circulation, and the inner-nuclear layer supplied via the central retinal artery. Other causes of negative ERG include X-linked congenital stationary night blindness (CSNB, Fig. 4, column F), X-linked retinoschisis, quinine toxicity, melanoma
associated retinopathy (MAR, an autoimmune mediated disorder that can occur in patients with a history of cutaneous malignant melanoma), Batten disease (one of the ceroid neuronal lipofuscinoses), and occasionally cone–rod dystrophy. Carcinoma associated retinopathy (CAR), unlike MAR, usually give profound global ERG reduction in keeping with dysfunction at the level of the photoreceptor rather than a ‘‘negative’’ ERG. A negative ERG is also a relatively common occurrence in Birdshot chorioretinopathy (BCR), an inflammatory disease, but in that disorder such an appearance may normalize following successful treatment, usually with steroids and/or immunosuppressive agents.
The most common ERG abnormality in BCR, or other forms of inflammatory retinal disease, such as uveitis, is a delayed 30 Hz flicker ERG, but there may be much less marked amplitude change than occurs in photoreceptor degeneration. The ERG abnormalities may occur prior to the development of symptoms, and can normalize following treatment. Electrophysiology can thus play an important role not only in the characterization of the disease, but also in the initiation and monitoring of treatment (23). This relatively recent role of the ERG in the management of inflammatory disease can be expected to receive increasing clinical interest in the future.
PERG
Primary Evaluation of Macular Function. Disorders of macular function result in an abnormality of the P50 component of the PERG, often with preservation of the N95/P50 ratio. It is usually P50 amplitude that is affected; latency changes are only occasionally present, particularly in association with macular oedema or serous detachment at the macula. In clinical practice, the PERG and the (fullfield) ERG provide complementary information regarding retinal function; the ERG assesses peripheral retinal function, and the PERG the degree of central retinal involvement. For example, dysfunction confined to the macula will have a normal ERG and an abnormal PERG (Fig. 4, column B), a common combination in macular dystrophies, such as Stargardt-fundus flavimaculatus (S-FFM), whereas generalized retinal dysfunction with macular involvement will have both an abnormal ERG and an abnormal PERG. This facilitates the distinction between macular dystrophy, cone dystrophy, and cone–rod dystrophy in a patient with an abnormal macular appearance and a history suggestive of a genetically determined disorder, important to the prognosis and accurate counseling of the patient. In relation to S-FFM, note that some patients have additional full-field abnormalities that may be of prognostic value (24).
The PERG may be normal even when the ERG is almost extinguished in patients with rod–cone dystrophy but normal central retinal function. Further, the objective assessment of macular function provided by the PERG can sometimes demonstrate early central retinal abnormalities prior to the appearance of symptoms or signs of macular involvement.
Ganglion Cell Dysfunction. The PERG will often be normal in disturbance of optic nerve function. However,
ELECTRORETINOGRAPHY 155
there may be retrograde degeneration to the retinal ganglion cells in optic nerve disease and this may selectively affect the ganglion cell derived N95 component. It is N95 loss that is the common abnormality if the PERG is abnormal in optic nerve disease. That is unlike macular dysfunction, where it is the P50 component that is primarily affected. Shortening of P50 latency may also occur in more severe disease, but, again, is not a feature of macular dysfunction. Primary disorders of retinal ganglion cell, such as Leber hereditary optic neuropathy (LHON) and dominantly inherited optic atrophy (DOA), are associated with N95 component loss, marked at presentation in LHON, but often occurring later in the disease process in DOA. There may be additional P50 amplitude reduction in advanced retinal ganglion cell dysfunction, and the associated shortening of P50 latency then becomes an important diagnostic factor. Further, providing there is sufficient vision remaining in at least one eye to maintain fixation for binocular PERG recording, total extinction of the PERG probably does not occur in optic nerve disease. Even in an eye blind from optic nerve disease (no perception of light), a PERG may still readily be detectable (2).
THE PERG IN RELATION TO VEP INTERPRETATION
Although detailed discussion of the VEP is beyond the scope of this article, a short discussion of the use of the PERG in the improved interpretation of VEP abnormality is warranted. The cortically generated VEP to pattern reversal stimulation is a powerful clinical tool in the detection and assessment of optic nerve dysfunction, and pattern VEP latency delay or loss is frequently associated with optic nerve disease. However, the VEP is generated in the occipital cortex, and a delayed PVEP must never be assumed necessarily to indicate optic nerve dysfunction in a visually symptomatic patient. Similar abnormalities can occur either in macular disease or optic nerve disease. The appearance of the macula may be a poor indicator of function, and remember that a normal macular appearance does not necessarily equate to normal macular function. The different types of abnormality present in the PERG in optic nerve and macular diseases usually allow the differentiation between delayed VEP due to retinal macular disease and that due to optic nerve disease. An abnormal VEP with a normal PERG (or a normal P50 component with an abnormality confined to N95) is consistent with optic nerve/ganglion cell dysfunction, whereas pronounced P50 reduction suggests a disturbance of macular function (e.g., Fig. 4, columns B, D, E, F).
MULTIFOCAL ERG
The multifocal ERG can be used to assess the spatial extent of central retinal cone involvement in disease. Normal traces appear in Fig. 5b. Two clinical examples are shown; Fig. 5c shows a patient with a retinal dystrophy in whom there is sparing of central macular function; Fig. 5d shows a patient with a macular dystrophy with loss of the responses to central hexagons, but preservation of more peripheral responses. As a restricted test of central retinal