

- •VOLUME 3
- •CONTRIBUTOR LIST
- •PREFACE
- •LIST OF ARTICLES
- •ABBREVIATIONS AND ACRONYMS
- •CONVERSION FACTORS AND UNIT SYMBOLS
- •EDUCATION, COMPUTERS IN.
- •ELECTROANALGESIA, SYSTEMIC
- •ELECTROCARDIOGRAPHY, COMPUTERS IN
- •ELECTROCONVULSIVE THERAPHY
- •ELECTRODES.
- •ELECTROENCEPHALOGRAPHY
- •ELECTROGASTROGRAM
- •ELECTROMAGNETIC FLOWMETER.
- •ELECTROMYOGRAPHY
- •ELECTRON MICROSCOPY.
- •ELECTRONEUROGRAPHY
- •ELECTROPHORESIS
- •ELECTROPHYSIOLOGY
- •ELECTRORETINOGRAPHY
- •ELECTROSHOCK THERAPY.
- •ELECTROSTIMULATION OF SPINAL CORD.
- •ELECTROSURGICAL UNIT (ESU)
- •EMERGENCY MEDICAL CARE.
- •ENDOSCOPES
- •ENGINEERED TISSUE
- •ENVIRONMENTAL CONTROL
- •EQUIPMENT ACQUISITION
- •EQUIPMENT MAINTENANCE, BIOMEDICAL
- •ERGONOMICS.
- •ESOPHAGEAL MANOMETRY
- •EVENT-RELATED POTENTIALS.
- •EVOKED POTENTIALS
- •EXERCISE FITNESS, BIOMECHANICS OF.
- •EXERCISE, THERAPEUTIC.
- •EXERCISE STRESS TESTING
- •EYE MOVEMENT, MEASUREMENT TECHNIQUES FOR
- •FETAL MONITORING
- •FETAL SURGERY.
- •FEVER THERAPY.
- •FIBER OPTICS IN MEDICINE
- •FICK TECHNIQUE.
- •FITNESS TECHNOLOGY.
- •FIXATION OF ORTHOPEDIC PROSTHESES.
- •FLAME ATOMIC EMISSON SPECTROMETRY AND ATOMIC ABSORPTION SPECTROMETRY
- •FLAME PHOTOMETRY.
- •FLOWMETERS
- •FLOWMETERS, RESPIRATORY.
- •FLUORESCENCE MEASUREMENTS
- •FLUORESCENCE MICROSCOPY.
- •FLUORESCENCE SPECTROSCOPY.
- •FLUORIMETRY.
- •FRACTURE, ELECTRICAL TREATMENT OF.
- •FUNCTIONAL ELECTRICAL STIMULATION
- •GAMMA CAMERA.
- •GAMMA KNIFE
- •GAS AND VACUUM SYSTEMS, CENTRALLY PIPED MEDICAL
- •GAS EXCHANGE.
- •GASTROINTESTINAL HEMORRHAGE
- •GEL FILTRATION CHROMATOGRAPHY.
- •GLUCOSE SENSORS
- •HBO THERAPY.
- •HEARING IMPAIRMENT.
- •HEART RATE, FETAL, MONITORING OF.
- •HEART VALVE PROSTHESES
- •HEART VALVE PROSTHESES, IN VITRO FLOW DYNAMICS OF
- •HEART VALVES, PROSTHETIC
- •HEART VIBRATION.
- •HEART, ARTIFICIAL
- •HEART–LUNG MACHINES
- •HEAT AND COLD, THERAPEUTIC
- •HEAVY ION RADIOTHERAPY.
- •HEMODYNAMICS
- •HEMODYNAMIC MONITORING.
- •HIGH FREQUENCY VENTILATION
- •HIP JOINTS, ARTIFICIAL
- •HIP REPLACEMENT, TOTAL.
- •HOLTER MONITORING.
- •HOME HEALTH CARE DEVICES
- •HOSPITAL SAFETY PROGRAM.
- •HUMAN FACTORS IN MEDICAL DEVICES
- •HUMAN SPINE, BIOMECHANICS OF
342FLUORESCENCE MEASUREMENTS
49.Matsuda T, Shimizu K, Sakurai T, et al. Measurement of aortic blood flow with MR imaging: Comparative study with Doppler ultrasound. Radiology 1987;162:857–861.
50.Edelman RR, Heinrich PM, Kleefield J, Silver MS. Quantification of blood flow with dynamic MR imaging and presaturation bolus tracking. Radiology 1989;171:551–556.
51.Moran, PR, ‘‘A flow velocity zeugmatographic interlace for NMR imaging in humans,’’ Magn. Res. Imaging, 1982, 1:197–203.
52.Chatzimavroudis GP, Oshinski JN, Franch RH, et al. Evaluation of the precision of magnetic resonance phase velocity mapping for blood flow measurements. J Card Mag Res 2001;3:11–19.
53.Firmin DN, Nayler GL, Kilner PJ, Longmore DB. The application of phase shifts in NMR for flow measurement. Mag Res Med 1990;14:230–241.
54.Zhang H, Halliburton SS, White RD, Chatzimavroudis GP. Fast measurements of flow through mitral regurgitant orifices with magnetic resonance phase velocity mapping. Ann Biomed Eng 2004;32(12):1618–1627.
55.Kraft KA, Fei DY, Fatouros PP. Quantitative phase-velocity MR imaging of in-plane laminar flow: Effect of fluid velocity, vessel diameter, and slice thickness. Med Phys 1992;19: 79–85.
56.Suzuki J, Caputo GR, Kondo C, Higgins CB. Cine MR imaging of valvular heart disease: Display and imaging parameters affect the size of the signal void caused by valvular regurgitation. Am J Roentgenol 1990;155:723–727.
57.Zhang H, Halliburton SS, Moore JR, Simonetti OP, et al. Ultrafast flow quantification with segmented k-space magnetic resonance phase velocity mapping. Ann Biomed Eng 2002;30:120–128.
58.Walker PG, Oyre S, Pedersen EM, Houlind K, Guenet FS, Yoganathan AP. A new control volume method for calculating valvular regurgitation. Circ 1995;92:579–586.
59.Chatzimavroudis GP, Oshinski JN, Pettigrew RI et al. Quantification of mitral regurgitation with magnetic resonance phase velocity mapping using a control volume method. J Mag Reson Imag 1998;8:577–582.
60.Drain LE. The Laser Doppler Technique. New York: John Wiley and Sons; 1980.
61.Durst F, Melling A, Whitelaw JH. Principles and Practice of Laser Doppler Anemometry. San Diago, (CA): Academic Press; 1976.
62.Edwards, Robert V, ‘‘Report of the special panel on statistical particle bias problems in laser anemometry,’’ J Fluids Eng, Transactions of the ASME, V 109, n 2, Jun, 1987, p 89–93.
63.Tomonaga G, Mitake H, Hoki N, Kajiya F. Measurement of point velocity in the canine coronary artery by laser doppler velocimeter with optical fiber. Jap J Surg 1981;11(4):226–231.
64.Manning KB, Przybysz TM, Fontaine AA, Tarbell JM, Deutsch S. Near field flow characteristics of the Bjork-Shiley monostrut valve in a modified single shot valve chamber. ASAIO J 2005; 51(2):133–138.
65.Ellis JT, Healy TM, Fontaine AA, Westin MW, Jarret CA, Saxena R, Yoganathan AP. An in vitro investigation of the retrograde flow fields of two bileaflet mechanical heart valves. J Heart Valve Disease 1996;5:600–606.
66.Raffel M, Willert CE, Kompenhans J. Particle Image Velocimetry: A Practical Guide. New York: Springer; 1998.
67.Oley LA, Manning KB, Fontaine AA, Deutsch S. ‘‘Off design considerations of the 50cc Penn State ventricular assist device. Art Organs 2005;29(5):378–386.
68.Hochareon P. Development of particle image velocimetry (PIV) for wall shear stress estimation within a 50cc Penn State artificial heart ventricular chamber. Ph.D. dissertation Bioengineering Department, Penn State University, 2003.
69.Lee SJ, Kim GB. X-ray particle image velocimetry for measuring quantitative flow information inside opaque objects. J Appl Phys 2003;94:3620–3623.
70.Hart DP. Super-resolution PIV by recursive local correlation. J Visualization 1999;10:1–10.
71.Hart DP. PIV error correction. Exp Fluids 2000;29(1):13–22.
72.Christensen, KT, ‘‘The influence of peak-locking errors on turbulence statistics computed from PIV ensembles,’’ Experiments in Fluids, Vol. 36, n 3, March, 2004, p 484–497.
73.Hassan YA, Phillip OG. A new artificial neural network tracking technique for particle image velocimetry. Exp Fluids 1997;23(2):145–154.
74.Lui X, Katz J. Measurements of pressure distribution in a cavity flow by integrating the material acceleration. Proceedings of 2004 Heat Transfer and Fluids Engineering Conference, ASME HT-FED04-56373, July, 2004.
Reading List
Adrian RJ. Laser velocimetry. In: Fluid Mechanics Measurements.
New York: 1983.
See also BLOOD RHEOLOGY; HEMODYNAMICS; PERIPHERAL VASCULAR NONINVASIVE MEASUREMENTS.
FLOWMETERS, RESPIRATORY. See
PNEUMOTACHOMETERS.
FLUORESCENCE MEASUREMENTS
ROBERT J. KLEBE
GUSTAVO ZARDENETA
PAUL M. HOROWITZ
University of Texas
San Antonio, Texas
INTRODUCTION
Following the absorption of light, fluorescent compounds release light at a less energetic wavelength. This phenomenon can be used to detect the presence of many compounds with exceedingly high sensitivity and selectivity.
The objective of this article is to acquaint the reader with the basic principles of fluorescence spectroscopy. For a more detailed analysis of this area, several reviews exist (1–5) that should be useful to readers with different levels of sophistication.
Most readers are probably familiar with the basic phenomenon involved in fluorescence measurements. For example, when certain minerals are irradiated with ultraviolet light, light in the visible region of the electromagnetic spectrum is released. In this case, absorption of high energy ultraviolet (UV) light excites electrons to leave their lowest energy state (the ground state); upon return to the ground state, energy is emitted as either light or heat. The energy emitted during fluorescence must be of a lower energy than the light that initially excited a compound and, hence, high energy ultraviolet light is emitted from a mineral as lower energy visible light.
When one deals with biological samples, one is always confronted with the problem of detecting extraordinarily small amounts of a compound mixed in an array of other compounds. As this article will show, fluorescence analysis provides a rather simple means to detect the existence of a compound within a complex mixture. For obvious
reasons, the ability of fluorescence spectroscopy to detect exceptionally small amounts of a compound in biological specimens has many applications of biomedical interest.
The analytical power of fluorescence measurements may be appreciated by consideration of the two following practical analogies. The sensitivity of fluorescence measurements is similar to the increased sensitivity with which one could measure the light output of a flashlight in a completely darkened room versus a sunlit room. In the case of the sunlit room, the light output of the flashlight would represent < 1% of the total light in the room; indeed, it would be difficult for an observer in a sunlit room to detect whether the flashlight was on or off. In contrast, in a darkened room, an observer would readily be able to sense whether a flashlight was turned on. In fluorescence measurements, light strikes a sensor only if the compound of interest is present and, thus, as in the case of the darkened room, the sensitivity of the fluorescence measurements is quite high.
The ability of fluorescence measurements to detect particular compounds in complex mixtures is due to the fact that several conditions must be met before a fluorescence signal is detected. Just as the location of a person would be precisely defined if one knew their street address, which consists of a city, state, street name, and house address, the selective ability of fluorescence measurements to detect the presence of only desired compounds arises from the fact that a compound will fluoresce only under a series of quite restrictive conditions. In the case of fluorescence spectroscopy, one observes light emanating from a compound if and only if the following conditions are met: (a) the compound must absorb light; (b) the compound must be capable of emitting light following excitation (the compound must be fluorescent); (c) the compound must be irradiated at a particular excitation wavelength; (d) a detector must be set to sense light at a different, less energetic emission wavelength; (e) a discrete time (in nanoseconds) must elapse between the time of excitation and emission; and (f ) other conditions, such as type of solvent and pH, must be satisfactory. As a street address defines the location of a person, the parameters involved in the fluorescence of a compound can be used to determine the presence or absence of just a single compound. For example, the presence of the compound, fluorescein, can be accurately detected in a biological specimen because (a) fluorescein is a fluorescent compound;
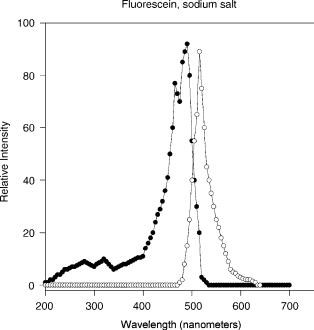
(b) fluorescein is excited to fluoresce only at wavelengths near 488 nm (nanometer) in aqueous solvents in the neutral to alkaline range; and (c) following excitation, fluorescein gives off light maximally at 514 nm (see Fig. 1). Hence, since only a very few compounds have fluorescence properties similar to that of fluorescein, selecting light with a wavelength of 488 nm to irradiate the sample and setting a detector to only respond to light with a 514 nm wavelength allows one to detect fluorescein in a complex mixture.
In addition to an overview of the theory involved in this area, a brief introduction into the instrumentation involved in fluorescence determinations will be presented. While there are numerous applications of fluorescence that are outside of the scope of this article (1–5), a few specific examples of the use of fluorescence measurements in biomedical studies will be presented and technical problems in interpretation of fluorescence data will be pointed out.
FLUORESCENCE MEASUREMENTS |
343 |
Figure 1. Excitation and emission spectra of the fluorescent compound, fluorescein. As described in the text, excitation and emission maxima are determined empirically and, then, spectra are obtained for the excitation and emission of fluorescein. Excitation of fluorescein at any wavelength in the excitation spectrum will produce emission at all wavelengths in the emission spectrum, with the exception of wavelengths of higher energy. Thus, fluorescence involves the conversion of high energy photons into photons of lower energy plus heat.
THEORY AND INSTRUMENTATION
After absorption of light energy, all compounds release some energy as heat; fluorescent compounds represent a special case in which some energy is also given off as light. Spectrofluorimeters are optical devices that measure the amount of light emitted by fluorescent compounds.
Spectrofluorimeters
While a complete description of the theory of fluorescence is quite involved (see Ref. 3, for a review), one can grasp the basic principles of the phenomenon from the following examples. If one were to aim a flashlight at a mirror, one would find that light would reflect off the surface of the mirror; in contrast, if one were to direct a flashlight beam at a black wall, one would see no light reflected from the wall. In this example, molecules in the black wall stop the transmission of light by absorbing the energy of the light and then converting the energy of light into heat energy. (Very precise measurements would reveal that the black wall was slightly warmer at the site at which the light beam struck it.) In the case of fluorescent compounds, light absorbed by a compound is converted into light (of a lower energy) as well as heat. The brighter the light that strikes a fluorescent compound, the stronger the fluorescent light emitted by the compound. The particular wavelength absorbed by a compound and the wavelength that is later emitted are characteristics of each fluorescent compound (Fig. 1).
344 FLUORESCENCE MEASUREMENTS
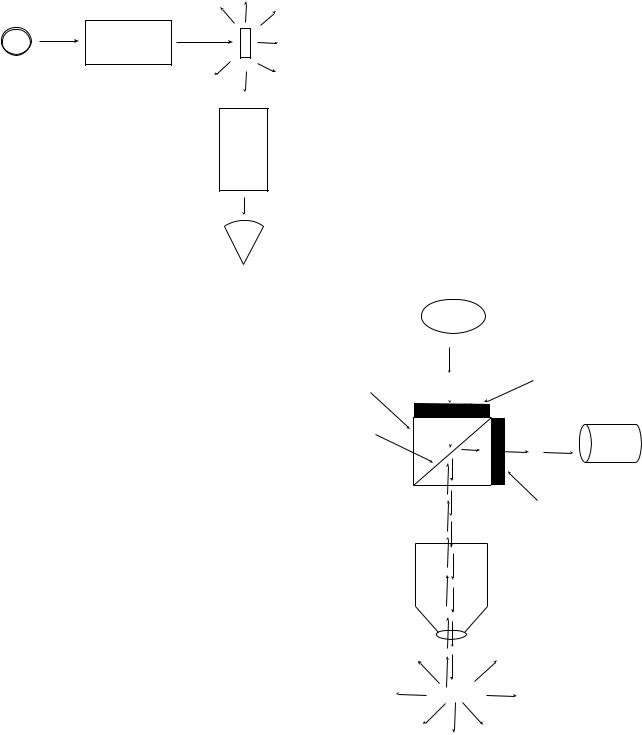
Source
Monochromator
Detector
Figure 2. Design of a typical spectrofluorimeter. As described in the text, a desired wavelength is selected with the aid of a monochromator and is used to irradiate a sample (large arrows); light emitted by the fluorescent sample is released in all directions (small arrows). The detector is positioned at a right angle with respect to the excitation beam in order to avoid light from the exciting beam entering the detector.
While light reflection from a mirror occurs at an angle determined by the angle of the incident light, light emission by a fluorescent compound occurs in all directions. For example, if one observed a beam of light striking a mirror in a smoke filled room, one would see a beam of light reflected at a unique angle from the mirror. In contrast, if one observed a beam of light striking a solution of fluorescent compound, one would see the emitted light appear as if it originated from a glowing sphere (and, compared to the original beam of light, the emitted light would have a color that was shifted toward the red end of the spectrum, i.e., lower energy).
The above features of fluorescence dictate the design of instruments used in the measurement of fluorescence (see Fig. 2). First, an intense beam of light is passed through a filter (or monochromator) that permits only light of a desired band of wavelengths to proceed toward the sample. As indicated in Fig. 2, light not absorbed by the sample passes straight through the sample without change in angle while the light emitted by the fluorescent sample is released in all directions. By positioning the detector at a 908 angle with respect to the exciting beam, instrument designers can minimize the amount of stray light from the exciting beam that reaches the detector. As indicated above, the light emitted by the fluorescent sample is given off in all directions and, thus, the positioning of the detector with respect to the exciting beam does not affect the relative amount of the emitted fluorescent light received by the detector. Hence, as we have shown above, the design of a fluorimeter is predicated upon maximizing the signal/noise ratio.
The sensitivity of fluorescence measurements is inherent in the design of instruments used to make such measurements. Since only light that is emitted from a fluorescent compound reaches the detector, the sensitivity
of the measurement is equivalent to our analogy of measuring the light from a flashlight in a darkened room. The ability to selectively measure the presence of a given compound is determined by the appropriate selection of filters (or settings on monochomators) used to make the measurement. In contrast, analytical measurements based on absorption are inherently less sensitive (due to signal/ noise problems).
Fluorescence Microscopy
The design of a fluorescence microscope is based on the same principles used in the construction of a spectrofluorimeter. In the technique of reflected fluorescence microscopy, light of a desired wavelength is used to irradiate a sample and, then, a dichroic mirror is used to separate light emitted by the fluorescent compounds in the sample from light in the original exciting beam (Fig. 3). A dichroic mirror is an optical device that reflects light of certain
Light source
Low pass filter
Filter cube
Dichroic mirror
Eyepiece
High pass filter
Objective
Specimen
Figure 3. Fluorescence microscope design. A fluorescence microscope employes optical components that allow one to irradiate a specimen at one wave lenght and then observe the fluorescence of a microscopic object at a second wavelength. The excitation beam (dashed line) is directed toward the specimen by the dichroic mirror and objective lens. Due to the fact that light emitted by a fluorescent object is released in all directions, one can observe the fluorescence of the specimen with the same objective lens that was used to irradiate the specimen. The emitted light (dotted line) is collected by the objective, passes through the dichroic mirror, and is observed via the eyepiece.
desired wavelengths and transmits light of other wavelengths.
Fluorescence microscopes can be used to detect fluorescence compounds in exceedingly small specimens. Via the technique of immunofluorescence, one can visualize the distribution of virtually any biological compound in living or fixed tissues by using antibodies tagged with fluorescent compounds.
PRACTICAL APPLICATIONS
The high sensitivity and selectivity of fluorescence methods permits the detection of exceedingly low amounts of many compounds of biological and biomedical interest.
In the preceding section, the basic methods that are used to detect fluorescent compounds were described. In the following section, the criteria that are used in establishing the presence or absence of particular chemical species are presented.
Detection of Fluorescent Compounds
It should be pointed out initially that only a small percentage of the known compounds are fluorescent. Thus, while most compounds cannot be studied by fluorescence techniques, the mere fact that an unknown compound is fluorescent can be used as a diagnostic means to positively identify it. In a following section, literature references are provided that list many fluorescent compounds and their properties (6,7).
Once it is established that a sample contains a fluorescent compound, one can use several criteria to establish the identity of the unknown compound. First, by trial- and-error, one establishes the wavelength(s) at which the compound is maximally stimulated to fluoresce (the excitation maxima). Second, again by trial-and-error, one determines the wavelength(s) at which the emission of light is highest (the emission maxima). Fluorescence emission spectra are then generated by holding the excitation monochromator at the excitation maximum wavelength and recording the intensity of light released from the sample as the wavelength of the emission monochromator is varied (Fig. 2). In this manner, a spectrum is produced that (a) describes the wavelengths at which a compound emits light and (b) establishes the relative efficiency with which light of different wavelengths is emitted (Fig. 1). The shape of the emission spectrum and the number of major and minor peaks are characteristics of each compound and are important parameters in establishing the identity of an unknown compound. The excitation spectrum, when appropriately corrected, is often identical to the absorption spectrum of the fluorescent compound. (In a similar fashion, the fluorescence excitation spectra are established by holding the emission monochromator at the emission maximum and varying the settings of the excitation monochromator.)
Strong evidence for the identity of an unknown compound is provided by (a) the establishment that a compound is fluorescent and (b) the shapes of the excitation and emission spectra. In addition, one could use other parameters involved in fluorescence to characterize a com-
FLUORESCENCE MEASUREMENTS |
345 |
pound, namely, (a) the fluorescent lifetime of a compound,
(b) the quantum yield, and (c) the perturbation of fluorescence by various solvents. It is possible that two compounds could have identical excitation and emission spectra just as it is possible that two individuals could have the same blood groups. Other analytical methods may be required to establish the identity of a compound with certitude. If the sample under study is quite impure, it is possible to use high performance liquid chromatography (HPLC) in conjunction with a fluorescence detector to gain yet another parameter that is characteristic of a compound, namely, its elution time from a particular HPLC column. The nature of the sample and the reasons for interest in it will determine the rigor required in its characterization.
Biomedical Applications
As described above, fluorescence methods provide means to identify compounds in complex mixtures. The sensitivity of fluorescence methods coupled with their inherent selectivity provide valuable means for biomedical analysis; several examples are described below.
Identification of Compounds in Biological Samples. If a compound of interest proves to be fluorescent, several analytical methods for the detection and quantitation of this compound immediately become available. Many drugs and biological compounds can be detected by fluorescence analysis (6,7). Fluorescence can be used to identify these and many other biologically active compounds in complex pathological specimens.
Due to the sensitivity of fluorescence methods to detect compounds at the level of one part per billion, such methods can be used to determine the presence of environmental pollutants with great sensitivity. The presence of specific pesticides and potentially carcinogenic aromatic hydrocarbons from cigarette smoke can be easily detected. Leakage of industrial wastes into the environment can be proven by placing fluorescent compounds into waste containers and later detecting the fluorescent compound in streams and lakes.
Fluorescence spectra of many chemicals and pharmaceuticals have been obtained under well controlled conditions and are published as the Sadtler Standard Fluorescence Spectra (6). Passwater (7) published a three volume series that presents literature citations for the fluorescence properties of a wide variety of compounds.
Fluorescence Microscopy. Following staining with
fluorescent dyes, the use of fluorescence at the microscopic level can be used to determine the sex of an individual from single hair follicle cells, teeth, or from blood smears (8). Sex determination is based upon the fact that male cells have a highly condensed Y chromosome that appears as an intense fluorescent spot in the nucleus of each male cell. Fluorescent dyes have found many applications in the biomedical sciences (1,5).
Immunofluorescence. Antibodies can be prepared that specifically recognize a wide variety of molecules and microbial organisms. By labeling such antibodies with fluorescein or other fluorescent probes, one can visualize
346 FLUORESCENCE MEASUREMENTS
the presence of antigens at the subcellular level; this approach has been widely used in molecular biology (9). In addition, one can visualize specific molecules and organisms in pathological specimens. The identification of disease causing microorganisms in pathological specimens by immunofluorescence (10) can be used. Immunofluorescence microscopy can also be employed in the identification of bacteria in food products (11).
Fluorescence Imaging. In addition to localizing molecules in histological sections, fluorescence has found numerous novel applications in cell biology. The availability of highly sensitive optical detection systems has permitted the localization of specific molecules in living cells. By tagging recombinant proteins with the green fluorescent protein (GFP) of jellyfish origin, one can track the expression and translocation of specific proteins in living cells during hormonal responses (12). The rate at which molecules move within living cells can be determined by fluorescence recovery after photobleaching (FRAP), which involves the photobleaching of molecules in a small region of a cell and then monitoring of the recovery of fluorescence with time as unbleached molecules return to the bleached area (13). Fluorescence energy transfer and fluorescence polarization methods (14–16) can also be used to study the interaction of molecules within living cells (15,16).
Fluorescence Polarization. Fluorescence polarization is perhaps the only method in biology that is directly attributable to Albert Einstein. The principle of fluorescence polarization involves the fact that emission of a photon is delayed by a few nanoseconds following absorption of light. During the delay in emission of light, Brownian motion will result in the movement of a molecule and smaller molecules will move more than larger molecules. Thus, molecules excited by polarized light will emit progressively depolarized light as the size of the molecule increases. Hence, if a small fluorescent molecule binds to a large nonfluorescent molecule, the light emitted by the bound small fluorescent molecule will become more polarized. Thus, the method of fluorescence polarization permits one to measure the binding of ligands to large molecules in real time (14).
Forster Resonance Energy Transfer (FRET). This method involves the transfer of energy from a fluorophore, which absorbs light to a second molecule that emits light at a different wavelength. Since the efficiency of FRET depends on the distance between the absorbing and emitting molecules, FRET permits one to obtain information about the distance between two molecules. Thus, if the molecule that absorbs light binds to a molecule that emits light via FRET, one can measure the binding event via release of light.
Molecular Biology Applications of Fluorescence. The high sensitivity of Fluorescence has been used as the basis of several important methods in molecular biology. For example, real-time polymerase chain reaction (PCR) methods can be used to quantify the amount of a specific ribonucleic acid (RNA) species in a small sample of cells. In this method, fluorescence energy transfer is used to detect the increase in PCR product with time (16).
The jellyfish green fluorescent protein (GFP) has become an important tool in molecular biology because it is fluorescent without the necessity of binding or reacting with a second molecule. Mutant GFP and GFP-like molecules from various species have been described (17) that emit light at a variety of wavelengths. Thus, one can engineer the sequence of the GFP into a recombinant protein and have a fluorescently tagged protein (12). In contrast, the firefly luciferase protein must react with ATP and luciferin in order to release a photon (18).
The high sensitivity and specificity of fluorescence should find many new applications in the future.
GLOSSARY
Dichroic Mirror. An optical device that reflects light of a desired band of wavelengths yet permits the transmission of light of another band of wavelengths. Dichroic mirrors are used in fluorescence microscopes to separate the light that excites a sample from the light emitted from the sample.
Emission (Fluorescent). The release of light by a compound that follows the absorption of a photon.
Emission Wavelengths. Following absorption of light at a wavelength capable of inducing fluorescence, light is released by the compound at less energetic wavelengths, termed the emission wavelengths (Fig. 1).
Excitation (Fluorescent). Following the absorption of a photon, one or more electrons of a fluorescent compound are promoted to a more energetic,‘‘excited’’ state of the compound.
Excitation Wavelengths. While light can be absorbed by fluorescent compounds at many wavelengths, only certain wavelengths, termed excitation wavelengths, are capable of inducing fluorescent emission of light. The wavelengths are often the same as those absorbed by the compound of interest.
Filter (Optical). Generally a colored piece of glass that transmits only certain wavelengths of light. Interference filters reflect light that is not transmitted while color glass filters absorb light and convert the absorbed energy into heat.
Fluorescence. The emission of light by certain compounds that is induced by the absorption of light at a more energetic wavelength.
Fluorescent Lifetime. The amount of time, generally in nanoseconds, that expires between the absorption of a photon and the emission of a photon.
Monochromator. An optical device that is used (a) to separate light into its component wavelengths and, then, (b) to isolate a desired group of wavelengths. Such devices employ either a prism or a diffraction grating.
Nanosecond. 0.000000001 s ¼10 9 s. (There are 1000 million ns in 1 s).
Quantum Yield. The percentage of excited compounds that release a photon of light during their return to the ground state. In most cases, the absorption of light by a compound is followed by the liberation of heat, rather than light.