

- •VOLUME 3
- •CONTRIBUTOR LIST
- •PREFACE
- •LIST OF ARTICLES
- •ABBREVIATIONS AND ACRONYMS
- •CONVERSION FACTORS AND UNIT SYMBOLS
- •EDUCATION, COMPUTERS IN.
- •ELECTROANALGESIA, SYSTEMIC
- •ELECTROCARDIOGRAPHY, COMPUTERS IN
- •ELECTROCONVULSIVE THERAPHY
- •ELECTRODES.
- •ELECTROENCEPHALOGRAPHY
- •ELECTROGASTROGRAM
- •ELECTROMAGNETIC FLOWMETER.
- •ELECTROMYOGRAPHY
- •ELECTRON MICROSCOPY.
- •ELECTRONEUROGRAPHY
- •ELECTROPHORESIS
- •ELECTROPHYSIOLOGY
- •ELECTRORETINOGRAPHY
- •ELECTROSHOCK THERAPY.
- •ELECTROSTIMULATION OF SPINAL CORD.
- •ELECTROSURGICAL UNIT (ESU)
- •EMERGENCY MEDICAL CARE.
- •ENDOSCOPES
- •ENGINEERED TISSUE
- •ENVIRONMENTAL CONTROL
- •EQUIPMENT ACQUISITION
- •EQUIPMENT MAINTENANCE, BIOMEDICAL
- •ERGONOMICS.
- •ESOPHAGEAL MANOMETRY
- •EVENT-RELATED POTENTIALS.
- •EVOKED POTENTIALS
- •EXERCISE FITNESS, BIOMECHANICS OF.
- •EXERCISE, THERAPEUTIC.
- •EXERCISE STRESS TESTING
- •EYE MOVEMENT, MEASUREMENT TECHNIQUES FOR
- •FETAL MONITORING
- •FETAL SURGERY.
- •FEVER THERAPY.
- •FIBER OPTICS IN MEDICINE
- •FICK TECHNIQUE.
- •FITNESS TECHNOLOGY.
- •FIXATION OF ORTHOPEDIC PROSTHESES.
- •FLAME ATOMIC EMISSON SPECTROMETRY AND ATOMIC ABSORPTION SPECTROMETRY
- •FLAME PHOTOMETRY.
- •FLOWMETERS
- •FLOWMETERS, RESPIRATORY.
- •FLUORESCENCE MEASUREMENTS
- •FLUORESCENCE MICROSCOPY.
- •FLUORESCENCE SPECTROSCOPY.
- •FLUORIMETRY.
- •FRACTURE, ELECTRICAL TREATMENT OF.
- •FUNCTIONAL ELECTRICAL STIMULATION
- •GAMMA CAMERA.
- •GAMMA KNIFE
- •GAS AND VACUUM SYSTEMS, CENTRALLY PIPED MEDICAL
- •GAS EXCHANGE.
- •GASTROINTESTINAL HEMORRHAGE
- •GEL FILTRATION CHROMATOGRAPHY.
- •GLUCOSE SENSORS
- •HBO THERAPY.
- •HEARING IMPAIRMENT.
- •HEART RATE, FETAL, MONITORING OF.
- •HEART VALVE PROSTHESES
- •HEART VALVE PROSTHESES, IN VITRO FLOW DYNAMICS OF
- •HEART VALVES, PROSTHETIC
- •HEART VIBRATION.
- •HEART, ARTIFICIAL
- •HEART–LUNG MACHINES
- •HEAT AND COLD, THERAPEUTIC
- •HEAVY ION RADIOTHERAPY.
- •HEMODYNAMICS
- •HEMODYNAMIC MONITORING.
- •HIGH FREQUENCY VENTILATION
- •HIP JOINTS, ARTIFICIAL
- •HIP REPLACEMENT, TOTAL.
- •HOLTER MONITORING.
- •HOME HEALTH CARE DEVICES
- •HOSPITAL SAFETY PROGRAM.
- •HUMAN FACTORS IN MEDICAL DEVICES
- •HUMAN SPINE, BIOMECHANICS OF
426HEART VALVE PROSTHESES, IN VITRO FLOW DYNAMICS OF
98.Reif TH. A numerical analysis of the backflow between the leaflets of a St. Jude Medical cardiac valve prosthesis. J Biomech 1991;24(8):733–741.
99.Lee CS, Chandran KB. Instantaneous back flow through peripheral clearance of Medtronic Hall tilting disk valve at the moment of closure. Ann Biomed Eng 1994;22(4):371–380.
100.Lee CS, Chandran KB. Numerical simulation of instantaneous backflow through central clearance of bileaflet mechanical heart valves at closure: shear stress and pressure fields within clearance. Med Biol Eng Comput 1995; 33(3):257–263.
101.Bluestein D, Einav S, Hwang NH. A squeeze flow phenomenon at the closing of a bileaflet mechanical heart valve prosthesis. J Biomech 1994;27(11):1369–1378.
102.Makhijani VB, Yang HQ, Singhal AK, Hwang NH. An experimental-computational analysis of MHV cavitation: effects of leaflet squeezing and rebound. J Heart Valve Dis 1994;3(Suppl 1):S35–44; discussion S44–8.
103.Grande KJ, Cochran RP, Reinhall PG, Kunzelman KS. Stress variations in the human aortic root and valve: the role of anatomic asymmetry. Ann Biomed Eng 1998;26(4): 534–545.
104.Kunzelman KS, Quick DW, Cochran RP. Altered collagen concentration in mitral valve leaflets: biochemical and finite element analysis. Ann Thorac Surg 1998;66(6 Suppl):S198– 205.
105.De Hart J, Peters GW, Schreurs PJ, Baaijens FP. A twodimensional fluid-structure interaction model of the aortic valve [correction of value]. J Biomech 2000;33(9):1079–1088.
106.De Hart J, Peters GW, Schreurs PJ, Baaijens FP. A threedimensional computational analysis of fluid-structure interaction in the aortic valve. J Biomech 2003;36(1):103–112.
107.Baaijens FPT. A fictitious domain/mortar element method for fluid-structure interaction. Int J Numerical Met Fluids 2001;35(7):743–761.
108.Lai YG. Unstructuredgrid arbitrarily shapedelement method for fluid flow simulation. AIAA J 2000;38 (12):2246–2252.
109.Makhijani VB, Yang HQ, Dionne PJ, Thubrikar MJ. Threedimensional coupled fluid-structure simulation of pericardial bioprosthetic aortic valve function. ASAIO J 1997;43(5):M387– M392.
110.Aluri S, Chandran KB. Numerical simulation of mechanical mitral heart valve closure. Ann Biomed Eng 2001; 29(8): 665–676.
111.Lai YG, Chandran KB, Lemmon J. A numerical simulation of mechanical heart valve closure fluid dynamics. J Biomech 2002;35(7):881–892.
112.Cheng R, Lai YG, Chandran KB. Two-dimensional fluidstructure interaction simulation ofbi-leaflet mechanical heart valve flow dynamics. Heart Valve Dis 2003;12: 772–780.
See also BIOCOMPATIBILITY OF MATERIALS; BIOMATERIALS, CORROSION AND WEAR OF; TISSUE ENGINEERING.
the tricuspid valve closes and blood flows through the open pulmonary valve to the lungs. Similarly, oxygenated blood leaving the lungs crosses the mitral valve during filling of the left ventricle and is then ejected through the aortic valve when the left ventricle contracts. A normally functioning heart valve must open and close approximately once every second without posing significant resistance to flow during opening and without allowing significant leakage during closure.
Due to the critical role that heart valves play in controlling pressures and flows in the heart and throughout the body, valve disease is a serious health risk and can be fatal if not treated. In the United States almost 20,000 people die annually as a result of heart valve disease (1). Although the causes and mechanisms of heart valve diseases are varied, their effect can usually be reduced to either failure of the valve to open fully (stenosis) or failure to prevent leakage of blood (regurgitation). Patients with stenosis or regurgitation may experience chest pain, labored breathing, lightheadedness, and a reduced tolerance for exercise.
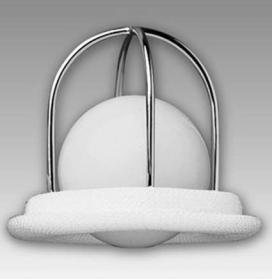
Because of the mechanical nature of valve dysfunction, treatments for severe valve disease usually involve surgical intervention to restore the flow control function of the valve. Early surgical treatments consisted of a surgeon using a tool, or his fingers, to reach into the beating heart and forcefully open a stenotic mitral valve. With the advent of cardiopulmonary bypass in the 1950s, the notion of fabricating and implanting a prosthetic valve became more feasible and by the early 1960s the first successful and repeatable prosthetic valve implants were performed by Starr (2,3). The valve he developed with Edwards, an engineer, consisted of a ball trapped in a rigid, domeshaped cage. At the inflow edge of the valve was a cloth flange, the sewing ring, which enabled the surgeon to sew the valve into the patient’s heart (see Fig. 1). Although crude in comparison to the native valve structure, this
HEART VALVE PROSTHESES, IN VITRO FLOW DYNAMICS OF
STEVEN CECCIO
University of Michigan
Ann Arbor, Michigan
INTRODUCTION
The cardiac cycle begins with venous blood passing through the tricupsid valve in response to relaxation of the right ventricle. Then, during ventricular contraction,
Figure 1. Starr–Edwards ball–cage valve. (Courtesy of Edwards Lifesciences, Irvine, CA).
HEART VALVE PROSTHESES, IN VITRO FLOW DYNAMICS OF |
427 |
Starr–Edwards valve and subsequent models had been used successfully in >175,000 people by 1991 (4).
Over the past four decades, numerous valve designs have been developed and used clinically. There were80,000 heart valve-related surgeries in the United States in 1999, 50,000 of which were implants of prosthetic aortic valves (5). But despite the success of prosthetic valve technology, currently no valve is optimal, so surgeons and engineers continue their collaborative efforts in pursuit of improved designs.
Due to the lower pressures in the right ventricle, the tricuspid and pulmonary valves are implicated far less in heart disease than the valves of the left heart (1). Consequently, prosthetic heart valve technology is focused almost entirely on mitral and aortic valves. The following discussion will focus on the primary tools, techniques, and data that are of interest when evaluating these valves in vitro.
NATIVE VALVE STRUCTURE AND HEMODYNAMICS
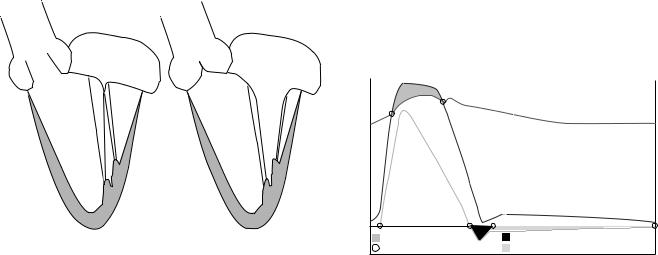
Although it has been shown that a prosthetic heart valve need not look like a native heart valve to have adequate in vivo function, it must have geometry suitable for the intended implantation site and must function without impeding other aspects of cardiac function. It is therefore important to understand the anatomy and physiology of native heart valves as well as the process of surgical implantation of prosthetic valves. These will be reviewed briefly here; more detailed reviews can be found elsewhere (6–10). Figure 2 shows schematic drawings of a crosssection of the left ventricle in systole and diastole.
The base, or inflow perimeter, of the aortic valve is contiguous with the left ventricular outflow tract and the anterior leaflet of the mitral valve. The valve is comprised of three flexible, triangular leaflets, each of which attaches along 1208 of the circumference of the aorta. The inflow attachment line curves upward from the annulus at
|
Left atrium |
|
Left atrium |
|
Aortic |
|
Aortic |
Mitral |
|
Mitral |
valve |
|||
valve |
valve |
|||
|
||||
|
valve |
|
|
|
Left |
|
Left |
|
|
ventricle |
|
|||
ventricle |
||||
|
|
|||
Systole |
Diastole |
Figure 2. Schematic of the left ventricle and valves during systole and diastole.
both ends, giving the leaflet its curved, three-dimensional (3D) geometry. At the outflow aspect of the valve, each adjacent leaflet pair meet at a commissure, a junction point on the aortic wall, and the aorta surrounding the valve leaflets is comprised of three bulbous regions, the sinuses of Valsalva.
Contraction of the left ventricle causes ventricular pressure to increase until it exceeds that in the aorta at which point the aortic valve opens rapidly and allows flow into the aorta. The flow reaches its peak amplitude about one-third of the way through the flow cycle. As the left ventricle relaxes, ventricular pressure falls, which reduces the pressure gradient and causes flow in the aorta to decelerate. Eventually, the pressure in the aorta exceeds that in the left ventricle and the aortic valve closes. During forward flow, a vortex forms in each sinus, which may play a role in the subsequent closure of the leaflets (11).
Aortic flow continues forward for a short period of time after the reversal of the pressure gradient due to the momentum of the blood (12), and a small volume of blood, the closing volume, is pushed back into the ventricle at closure due to the motion of the closing leaflets. During diastole, the closed aortic valve is under a back pressure of 80–100 mmHg (10.66–13.33 kPa). Representative pressure and flow waveforms of the aortic valve are shown in Fig. 3. At a heart rate of 70 beats min 1, systole will typically last35% of the whole cardiac cycle, or 300 ms. At an exercise heart rate of 120 beats min 1, the systolic ratio will increase to near 50%.
Although there are many factors involved in deciding whether a patient needs surgery, general guidelines suggest that a diseased aortic valve may be considered for replacement with a prosthesis when the area of the valve has been reduced to 0.5–1.0 cm2 (compared to a normal range of 3–4 cm2), or when regurgitation has caused an ejection fraction of <50% (13). When a diseased aortic valve is replaced with a prosthetic valve, the aorta is cut open, all three leaflets are cut out, and any calcium is removed from the valve annulus. The diameter of the annulus is then measured to determine the appropriate sized prosthetic valve to use. The prosthetic valve is then implanted by stitching the sewing ring to the tissue of the native annulus, although the exact implantation process as well as the positioning of the valve will vary based on valve type.
|
Aortic pressure |
|
|
Pressure |
Ventricular pressure |
Flow |
|
Aortic flow |
|
||
0 |
|
|
0 |
|
Aortic pressure gradient |
Closing volume |
|
|
Crossing points |
Leakage volume |
|
Figure 3. Idealized waveforms of pressure and flow through the aortic valve.
428 HEART VALVE PROSTHESES, IN VITRO FLOW DYNAMICS OF
The mitral valve is structurally and functionally distinct from the aortic valve. It has two primary, unequally sized leaflets, each of which is made from several segments. The longer anterior leaflet, adjacent to the aortic valve, is attached along one-third of the annulus, while the shorter posterior leaflet connects to about two-thirds of the annulus. The leaflets contain many furrows or wrinkles that allows the valve to occupy minimal space in the heart while still having a large surface area for preventing leakage and supporting the stress of closure. The annulus itself is not circular, but D-shaped, and has a 3D, saddle-shaped curvature (14).
Many tendonous chords emanate from the underside and edge of the leaflets and attach to the papillary muscles, which are part of the wall of the left ventricle. The chords and papillary muscles comprise the tensioning component of the mitral apparatus, helping the valve to support and balance the stresses on the leaflets during closure. The entire mitral apparatus is a dynamic and active structure: the annulus, leaflets, and papillary muscles all move in coordination throughout the cardiac cycle in support of proper valve function (15,16). Currently, no prosthetic mitral valve can replicate or synchronize with the complicated force and motion dynamics of the native mitral apparatus.
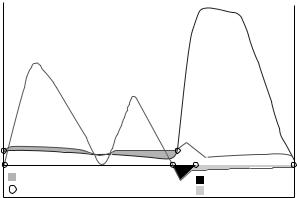
During left ventricular filling, diastolic flow through the mitral valve is equal to the subsequent flow out of the aortic valve, assuming there are no leaks through either valve. Although the same volume passes through the mitral valve, the flow profile is very different than that of aortic flow. First, diastolic flow occupies 65% of the cardiac cycle, lasting 557 ms at a heart rate of 70 beats min 1. Due to the longer flow period, peak flow rates and pressure gradients are usually lower through the mitral valve than the aortic valve. Second, diastolic flow occurs in two phases. As the left ventricle relaxes, pressure falls to near zero and the mitral valve opens to allow ventricular filling from the left atrium, which acts as a compliant filling chamber and maintains a fairly constant blood pressure of 15 mmHg (1.99 kPa). The pressure gradient between the atrium and the ventricle lessens as the ventricle fills, causing the flow to approach zero and the leaflets to nearly close. The left atrium then contracts, opening the leaflets again and sending a second bolus of blood, less than the first, into the ventricle. The two waves of the biphasic diastolic flow pattern are referred to as the E and A waves. The valve closes fully at the end of the A wave and is under a back pressure of >100 mmHg (13.33 kPa) during systole. Figure 4 shows a schematic representation of pressure and flow waveforms through the mitral valve.
The decision to surgically replace the mitral valve with a prosthesis, as with the aortic valve, is based on many factors. But general functional criteria include an effective orifice area <1.0 cm2 (depending on body size) or regurgitation causing an ejection fraction <50% (13). During surgical replacement, the left atrium is opened, the native leaflets are cut out, and any calcium is removed. As with aortic replacement, the diameter of the annulus is measured to determine the prosthetic valve size needed. For valves with stent posts, care must be taken that the posts do not impinge on the wall of the left ventricle. The chords
|
|
Ventricular |
|
|
pressure |
Pressure |
Mitral flow |
Flow |
|
|
|
|
|
Atrial pressure |
0 |
|
0 |
|
Mitral pressure gradient |
Closing volume |
|
Crossing points |
Leakage volume |
Figure 4. Idealized waveforms of pressure and flow through the mitral valve.
are generally removed, but may be left in the heart in some cases to provide structural support to the left ventricle. For some patients, the mechanical functionality of the mitral valve can be restored with surgical repair techniques, obviating the need for a prosthesis.
PROSTHETIC HEART VALVE TECHNOLOGY
A prosthetic heart valve must meet several basic functional requirements. In addition to having adequate opening and closing characteristics, it must also be durable, and biocompatible. All prosthetic valves compromise at least one of these features in favor of one of the others. The primary distinction between valve types is materials: Most valve designs use either synthetic, rigid components or flexible, biologically derived tissue. Based on these material features, a prosthetic valve is generally categorized as either a mechanical valve or a tissue valve.
Most mechanical heart valves (MHVs) are made from a rigid ring of metal or pyrolytic carbon, the outer perimeter of which is covered with a cloth sewing ring. The ring, or housing, contains one or more rigid occluders that are free to swivel on struts or hinges in response to a pressure gradient. The occluders are constrained within the housing, but are not mechanically coupled to it, allowing blood to flow completely around them, which helps to avoid flow stagnation.
Although they can adequately prevent backflow, MHVs do not create a seal during closure, and thus allow some regurgitation. The volume of blood regurgitated is tolerable for the patient, but the squeezing of blood through the closed valve creates high velocity, high shear jets that may be responsible for blood damage that leads to thrombosis (17). Whatever the mechanism, all MHV patients must take a daily dose of anticoagulant to counteract the thrombogenic effects of the valve. Without anticoagulation MHVs will develop clots that can impede valve function or become embolized into the bloodstream. One advantage of MHVs is that they are highly durable and can usually function for the duration of the recipient’s life.
Although widely used, the Starr–Edwards valve was eventually surpassed by MHVs with better flow characteristics. Bileaflet valves and tilting disk valves are the two
HEART VALVE PROSTHESES, IN VITRO FLOW DYNAMICS OF |
429 |
incubated in glutaraldehyde, and then mounted on a cloth-covered frame with three commissure posts and a sewing ring. The frame, made of metal wire or plastic, provides structural support and allows ease of handling and implantation. The other main type of THV is the pericardial valve. Pericardium, the tissue that surrounds the heart, is separated from the heart of a cow or horse and then flattened and incubated in glutaraldehyde, producing a sheet of material that may be cut and assembled as desired to form a valve. Commercial pericardial valves typically incorporate three separate leaflets onto a threepronged support structure similar to those used for porcine valves. Although structurally similar to the aortic valve, both porcine and pericardial valves are also implanted in the mitral position. Examples of a porcine valve and a pericardial valve are shown in Fig. 6. The Edwards Perimount pericardial valve is currently the most widely used THV, comprising >70% of all tissue valves used in the
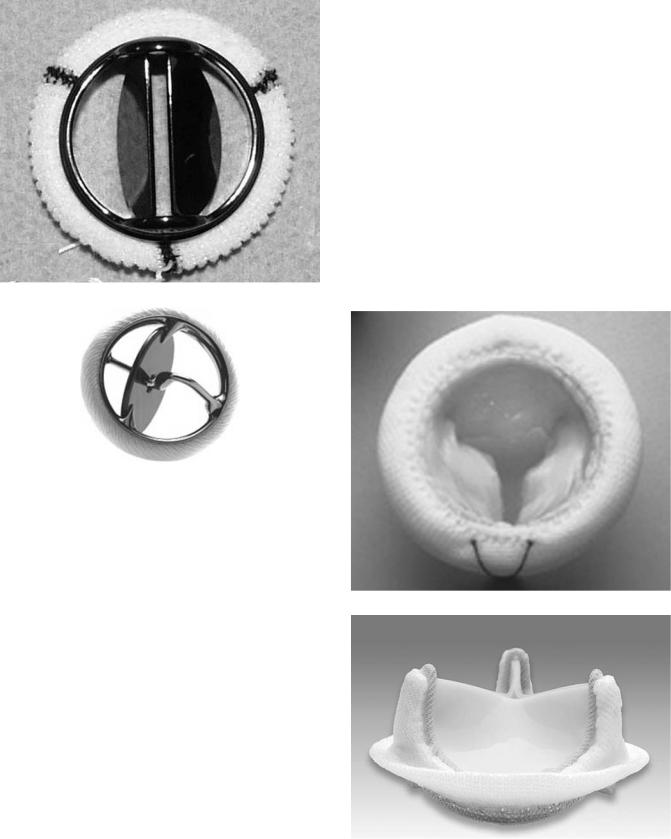
Figure 5. Examples of two mechanical heart valves: A bileaflet St. Jude Mechanical valve, and a Medtronic tilting disc valve. (Courtesy of Medtronic, Inc.)
mostly popular types in use clinically (see Fig. 5). The St. Jude bileaflet mechanical valve is by far the most widely used mechanical valve. It accounted for >70% of all mechanical valves sold in the United States in 2003 (18). Most innovations in MHVs in the last 10 years have focused on optimizing this type of bileaflet design, either through improved materials, geometries, or sewing rings. Other manufacturers of mechanical heart valves include Carbomedics, Medtronic, Sorin, and Medical Carbon Research Institute.
Tissue heart valves (THVs), also called bioprosthetic valves, were developed based on the idea that valves made of biologic tissue and with a structure similar to the native heart valve would function better in vivo than rigid mechanical valves. The leaflets of these valves are made from animal tissue that has been treated with a dilute solution of glutaraldehyde. Glutaraldehyde cross-links the collagen in the tissue, which prevents its breakdown and reduces its antigenicity in vivo. The cross-linked tissue is slightly stiffer than fresh tissue, but it still retains a functional amount of flexibility.
Porcine THVs are made from the aortic valve of a pig. To construct the prosthesis, the aortic valve is first excised from the pig heart, trimmed to remove excess tissue,
Figure 6. Examples of two tissue heart valves: A Mosaic porcine tissue valve. (Courtesy of Medtronic, Inc.) A Perimount pericardial tissue valve. (Courtesy of Edwards Lifesciences, Irvine, California.)

430 HEART VALVE PROSTHESES, IN VITRO FLOW DYNAMICS OF
United States (18). Other manufacturers of tissue valves include Medtronic, St. Jude, Sorin, and 3F Therapeutics.
In contrast to MHVs, THVs generally have an unobstructed flow orifice, seal during closure, and do not typically require long-term anticoagulation. However, THVs have limited structural durability compared to MHVs, which usually last the duration of the recipient’s lifetime. Although some pericardial valves have performed well for as long as 17 years in patients (19), the THVs in general are expected to degenerate or calcify within 10–15 years, at which time they must be surgically replaced with a new prosthesis. Due to this limitation, THVs are typically only implanted in patients older than 65 years of age (13). Over the past several years there has been an increased use of tissue valves in the United States, while mechanical valve usage has declined, a trend that is expected to continue (18).
Another type of THV that was widely pursued in the 1990s is the stentless valve. This valve type, intended for aortic valve replacement only, is made from porcine aortic roots that are fixed in glutaraldehyde, but do not have any rigid support materials added. The surgeon must attach both ends of the device into the patient’s aorta without the aid of a sewing ring or support structures. The intended benefit of these valves is better hemodynamics because of their flexibility and lack of a sewing ring, and greater durability due to lower stresses in the tissue. However, they are not used as extensively as other THVs because they are more difficult to implant, which results in extended surgery time. Examples of two stentless valves used clinically are shown in Fig. 7. Similarly, human aortic roots can be removed from cadavers and processed with preservative techniques to make an implantable replacement. These valves, called homografts or allografts, have all the perceived benefits of stentless valves, but are just as difficult to implant, and long-term clinical results have been mixed (5). The primary commercial source of homografts is Cryolife, which cryogenically preserves the aortic roots.
There have been numerous attempts at fabricating prosthetic valves from polymers but, to date, none have achieved clinical success. Polymer valves are conceptually attractive because they would be flexible, with a reproducible geometry and relatively economical and straightforward to manufacture, and ideally would be more durable than tissue valves, while not requiring chronic anticoagulation like mechanical valves. But design difficulties and calcification have prevented these valves from realizing their full potential (20). Like polymer valves, tissue-engi- neered valves have many theoretical advantages over current mechanical and tissue valves. As a result, processes for growing a valve in vitro from human cells seeded on a scaffold has been an area of active research (21–23), but has also not yet produced a clinically viable product.
Figure 7. Examples of two stentless porcine heart valves: A Prima stentless valve. (Courtesy of Edwards Lifesciences, Irvine, Ca.) A Freestyle stentless valve. (Courtesy of Medtronic, Inc.)
patterns, the velocity magnitude of regurgitant jets, the motion of the leaflets during forward flow, and the position of the leaflets during closure can all be assessed in vitro and be used to improve valve designs and assess the appropriateness for human implantation.
IN VITRO TESTING
In vitro evaluations of prosthetic heart valves are performed to understand the detailed flow characteristics of a given design. The flow area, the amount of leakage, the ultrasound compatibility, the presence of deleterious flow
Equipment
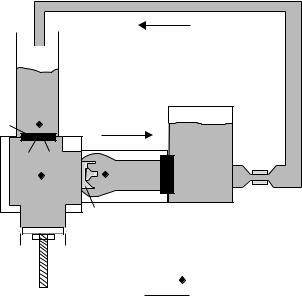
To evaluate the hemodynamic performance of prosthetic valves, a pulse duplicator or mock flow loop is implemented to act as an artificial left ventricle, and therefore must be able to simulate the pressure and flow waveforms shown in
HEART VALVE PROSTHESES, IN VITRO FLOW DYNAMICS OF |
431 |
Left |
|
|
atrium |
|
|
Mitral |
|
|
valve |
|
|
|
Aorta |
Compliance |
|
tank |
|
|
|
|
Ventricle |
|
Resistance |
Aortic |
|
Flow |
|
probe |
|
valve |
|
|
|
|
|
Pump |
|
|
|
|
Pressure tap |
|
|
Flow direction |
Figure 8. Schematic of a pulse duplicator for in vitro heart valve testing.
Figs. 2 and 3 over a range of physiologic hemodynamic conditions.
Figure 8 is a schematic representation of a pulse duplicator for in vitro heart valve testing. Generally, the left atrium is simulated with an open or compliant reservoir that maintains a static fluid height above the mitral valve so as to provide a diastolic filling pressure of 10–15 mmHg (1.33–1.99 kPa). The mitral valve should open directly into the left ventricle as it does anatomically. The left ventricle can be simulated with a rigid chamber with a volume similar to the human left ventricle ( 70–100 mL), although some pulse duplicators utilize a flexible, ventricularshaped sac that can be hydraulically compressed to simulate the squeezing action of the heart (24,25). The aortic valve should be mounted at the outflow of the ventricular chamber so that flow enters the valve directly from the chamber. Tubing between the ventricle and the valve should be avoided as it will cause higher than physiologic velocities upstream of the valve. The flow exiting the aortic valve enters a tubular chamber with dimensions similar to the native aorta, including three sinuses and a diameter appropriate for the aortic valve being tested. Although not necessary for valve closure, the presence of sinuses allows for more realistic flow patterns behind the leaflets during systole.
The system should be instrumented to allow instantaneous pressure measurements in the left atrium, left ventricle, and aorta and flow measurements through both valves. The flowmeter must be able to accurately measure both forward flow, which can reach peak valves of 30 L min 1, and leakage flows, which may be on the order of 1 mL s. Test fluids can be either saline or a blood analog fluid with a density and viscosity similar to that of blood,1.1 g mL 1 and 3.5 cp, respectively. A mixture of water and glycerin is the most common blood analog fluid. Because blood is a non-Newtonian fluid (i.e., its viscosity
varies with shear rate), polymeric solutions, which more closely mimic this property, have also been used for in vitro valve testing (26).
In order to produce physiologic waveforms, compliant and resistive elements must be present downstream of the aorta. Compliant elements are expansive chambers that may utilize air, springs, flexible beams, or compliant tubing to absorb fluid volume during the systolic stroke. The compliant element should be located as close as possible to the aortic valve to minimize ‘‘ringing’’ in the pressure and flow waveforms. The impedance of the arterial system can be simulated with simple pinch clamp on flexible tubing, or a variably restrictive orifice.
The flow is driven with a pulsatile pumping system that interfaces with the left ventricular chamber. The pump must be able to create physiologic beat rates, flow rates, and systolic/diastolic ratios. One type of pumping system utilizes positive and negative air pressure, cycled with solenoid valves and timers, to drive a flexible diaphragm (27). Alternatively, a large, cam-driven syringe (piston– cylinder) pump can be employed with controlled piston displacement designed to produce the desired systolic and diastolic timing. Syringe pumps driven by computercontrolled servo motors are the optimal pumping systems because they allow the greatest amount of control over the motion of the piston and can best simulate complicated physiologic flow patterns (e.g., biphasic diastolic flow).
Valve mounting in a pulse duplicator can be accomplished by mechanical compression of the sewing ring, or by suturing the ring to a gasket. However, any valve that is flexible and mechanically coupled to the native anatomy during implantation (e.g., a stentless aortic valve) must be tested in a valve chamber that mimics the dynamic motion of the valve in vivo, because this may affect hemodynamic performance. Standardized testing guidelines suggest that stentless valves be tested in flexible chambers that undergo a 4 and 16% change in diameter per 40 mmHg (5.33 kPa) pressure change (28).
Test Conditions and Data Analysis
Hemodynamic conditions considered typical for an adult would be the following: cardiac output: 5 L min 1; left atrial pressure: 10–15 mmHg (1.33–1.99 kPa); left ventricular pressure: 120/0 mmHg (systolic/diastolic) (15.99/0 g); aortic pressure: 120/80 mmHg (systolic/diastolic) (15.99/ 10.66 kPa); heart rate: 70 beats min 1.
Although flow and pressure conditions are often quantified according to mean, peak, and minimum values this way, the shape of the pressure and flow waveforms are also important in determining the appropriateness and quality of the test condition. Excess ‘‘ringing’’, large pressure spikes, and square waveforms are examples of unphysiologic waveform features that may be seen in vitro.
A thorough in vitro investigation of heart valve performance should also include different flow, heart rate, and pressure conditions that correspond to the range of physiologic hemodynamic conditions that the valve will experience in vivo. At rest, the heart rate may decrease to 45 beats min 1 or lower, while during exercise it may increase to >120 beats min 1; cardiac output will vary
432 HEART VALVE PROSTHESES, IN VITRO FLOW DYNAMICS OF
accordingly at these conditions, typically ranging from 2 to 7 L min 1. It is at these extremes that leaflet dynamics, for example, may change and reveal performance limitations of the valve.
Typically, a minimum of 10 cycles, or heart beats of flow, inflow pressure and outflow pressure are collected for analysis at each test condition. The waveforms are analyzed by first identifying the key crossing points that define the start and end of forward flow, regurgitant flow, and positive (forward flow) pressure gradient (see Figs. 3 and 4). These pressure and flow data are used to calculate the key variables that define the hemodynamic performance of a valve: the pressure gradient (DP), the effective orifice area (EOA), and regurgitant volume.
The pressure gradient is the most basic measure of valve resistance to flow. In vivo, a prosthetic aortic valve with a high pressure gradient will force the left ventricle to expend more energy than one with a low pressure gradient. The regions of positive pressure gradient for aortic and mitral valves are shown in Figs. 3 and 4. These pressures can be measured in a pulse duplicator through wall taps in the testing chambers or through a catheter inserted into the flow. The pressure gradient will increase with decreasing valve size and, for a given valve size, increasing flow rate. It has also been shown that aortic pressure gradient measurements can be dependent on left ventricular ejection time (29) and aortic pressure (30).
The EOA is not a physical valve dimension, but a calculation of the minimal flow area allowed by the open
valve. Under pulsatile flow conditions, it is calculated as Qrms/[51.6(DP)1/2], where Qrms is the root-mean square of the average flow rate through the valve. The EOA is a more
useful measure than geometric orifice dimensions because mechanical valves, with occluders that occupy the orifice, restrict the orifice flow in variable ways based on the degree of opening and flow rate. Similarly, the extent of tissue valve leaflet opening will vary based on leaflet stiffness and flow rate. A method of dynamically measuring the actual valve area in an in vitro tester by measuring the amount of light that passes through it has also been proposed and tested (31).
All valves move some volume of fluid back into the inflow chamber during closure. The closing volume of a prosthetic valve is calculated from the area under the flow curve immediately after valve closure as shown in Figs. 3 and 4. This volume is a function of the valve area and the travel distance of the leaflets during closure. Although it will vary based on valve design, the closing volume is relatively small and typically does not have a significant hemodynamic effect. Leakage volume, by contrast, is the volume of blood that passes through the valve during closure, and is a critical measure of valve performance. Excessive leakage reduces the efficiency of the heart and can cause progressive deterioration of ventricular function. Ideally, the leakage volume through a valve is zero, although most mechanical valves allow some leakage of blood in order to provide ‘‘washout’’ of mechanical junctions. Tissue valves do not allow any leakage as long as there is adequate apposition, or coaptation, of the leaflets.
The total regurgitant volume is the sum of the closing and leakage volumes and represents the total fluid loss
during one valve closure. Regurgition can also be expressed as a percentage of forward volume. Clinically, the ejection fraction, the ratio of the ejected blood volume to the left ventricular volume, is used to assess the hemodynamic severity of regurgitation. As with other hemodynamic variables, regurgitant volumes will vary with valve design, valve size, flow rate, pressure, and heart rate.
When assessing prosthetic valve regurgitation it is important to discriminate between transvalvular regurgitation and paravalvular regurgitation. Transvalvular regurgitation occurs through the valve mechanism, such as past the hinges or occluder gaps in mechanical valves or through regions of inadequate leaflet coaptation in tissue valves. Because prosthetic valves are sewn in place with a porous cloth sewing ring, leakage can also occur through the sewing ring or spaces created by inadequate fixation to the annulus. This is paravalvular leakage, occurring around or adjacent to the valve, and should be differentiated from transvalvular leakage In vitro, test valves should be sealed to eliminate paravalvular leakage so that transvalvular leakage can be measured independently.
In vitro performance comparisons of different prosthetic valve designs are complicated by variations between labeled valve size and actual valve size (32). Most commercial prosthetic valves are sized according to diameter in 2 mm increments and typically range from 19 to 29 mm for aortic valves, and 25 to 31 mm for mitral valves. However, the diameter measurement is made at different locations based on manufacturer and valve type. The performance index (PI), which is the ratio of EOA to actual sewing ring area (33), is calculated in order to control for these variations and allow for more reliable valve-to-valve comparisons. Clinically, an EOA Index (EOAI) is calculated by dividing the EOA by the patient’s body surface area, in order to normalize EOA values based on patient size and, indirectly, hemodynamic requirements.
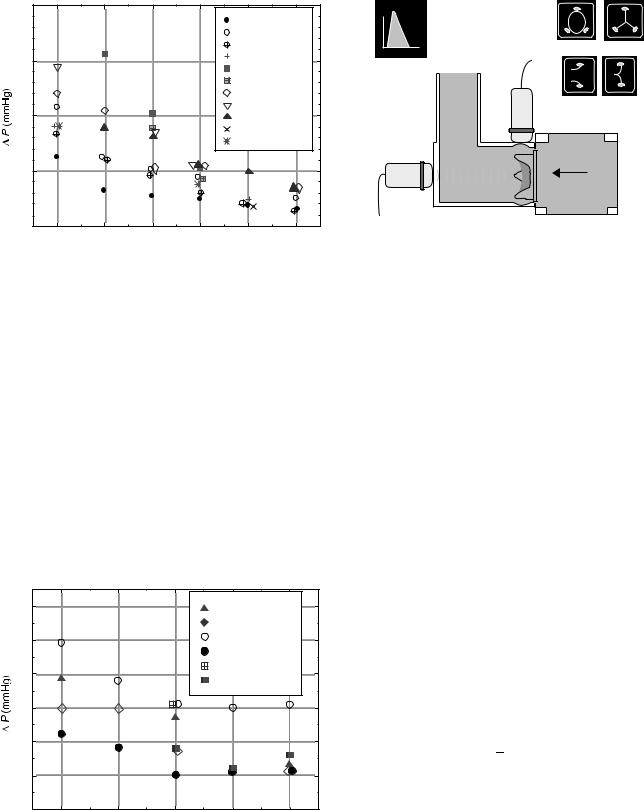
Due to the variability of pulse duplicator systems and the sensitivity of test results on hemodynamic conditions, comparing valves evaluated in different test systems can also be problematic (34). Differences in pressure and flow waveform shapes, drive types, location of pressure taps, chamber geometries, and other system configuration characteristics can cause variations in measured valve performance. Comparative in vitro studies of different mechanical valves (35,36) and tissue valves (37) tested in the same pulse duplicator under the same conditions can be found in the literature. Figures 9–10 show in vitro pressure drop results for various tissue valves from one of these studies.
Doppler Ultrasound
Doppler echocardiography is the most widely used modality for assessing prosthetic valve performance in vivo and can be useful for in vitro studies as well. In vitro Doppler and imaging assessments are an important part of valve evaluations prior to human implants because they may reveal signature ultrasound features (e.g., acoustic shadowing, eccentric flow profiles, jet morphology), which are unique to the valve design and different from a native valve. It is important for clinical sonographers to understand these
40 |
|
|
|
|
|
|
|
|
|
PERIMOUNT |
|
|
|
|
|
Edw And s SAN |
|
|
|
|
|
Prima Plus |
|
30 |
|
|
|
Toronto |
|
|
|
|
Biocor Porcine |
||
|
|
|
|
||
|
|
|
|
Biocor Peri |
|
|
|
|
|
Mosaic |
|
20 |
|
|
|
Medtronic Intact |
|
|
|
|
Hancock II |
|
|
|
|
|
|
Free style |
|
|
|
|
|
Mitro flow |
|
10 |
|
|
|
|
|
0 |
21 |
23 |
25 |
27 |
29 |
19 |
|||||
|
|
Size (mm) |
|
|
|
Figure 9. In Vitro pressure drop data of various prosthetic aortic valves. (Reprinted with permission from The Journal of Heart Valve Disease.)
HEART VALVE PROSTHESES, IN VITRO FLOW DYNAMICS OF |
433 |
|
v |
|
|
t |
Short axis open Short axis closed |
|
|
|
|
Doppler display |
|
|
Transducer |
Long axis open Long axis closed |
|
position 2 |
|
|
|
Flow |
Transducer |
|
position 1 |
Valve |
|
Figure 11. Ultrasound measurements in a pulse duplicator. In transducer position 1, the transducer is aligned with the flow and emits a sound wave that reflects off particles in the fluid; the return signal is measured by the transducer and the Doppler equation is used to calculate velocity. Transducer position 2 is used to obtain short-axis (cross-sectional) and long axis images of the valve as it opens and closes.
features so they can distinguish between normal and abnormal valve function. In addition, two-dimensional (2D) echo images of the valve can be used to obtain an axial cross-sectional view of the valve during cycling that can be useful in assessing the motion and coaptation morphology of tissue leaflets. And although a flowmeter can be used to quantify the amount of regurgitation through a valve, Color Doppler ultrasound allows for visualization of the size and shape of any jets and detecting their point of origin.
Doppler measurements and 2D imaging can be performed in vitro providing there is an acoustic window for the ultrasound beam that allows the transducer to be aligned roughly perpendicular to the axis of valve flow and does not attenuate the acoustic signal. It is also
6 |
|
|
Hancock II |
|
|
|
|
Mosaic |
|
5 |
|
|
Sav |
|
|
|
PERIMOUNT |
|
|
|
|
|
|
|
4 |
|
|
Bocor Peri |
|
|
|
Biocor Porcine |
||
|
|
|
||
3 |
|
|
|
|
2 |
|
|
|
|
1 |
|
|
|
|
0 |
27 |
29 |
31 |
33 |
25 |
||||
Size (mm)
Figure 10. In Vitro pressure drop data of various prosthetic mitral valves. (Reprinted with permission from The Journal of Heart Valve Disease.)
necessary to add small, insoluble particles to the test fluid to provide acoustic scatter for Doppler measurements and Color Doppler imaging. Figure 11 shows how an ultrasound transducer would be positioned on a pulse duplicator and the types of images that can be obtained.
Doppler measurements of pressure gradients can be performed in vitro to assess the hemodynamic performance of a valve as it would be done in a patient. During forward flow, continuous wave Doppler measures a real-time spectrum of velocities across the open valve. Standard echocardiographic software allows the user to acquire and analyze the spectrum and determine an average velocity.
Clinically, the average velocity value is used to compute pressure gradient using a simplified version of the Bernoulli equation. Ignoring viscous losses, acceleration effects, and changes in height, the Bernoulli relationship between two points, 1 and 2, on a streamline is:
|
1 |
|
|
1 |
|
||
P1 þ |
|
rv12 |
¼ P2 þ |
|
|
rv22 |
ð1Þ |
2 |
2 |
||||||
where P is the pressure, is the fluid density, and v is the velocity.
Rearranging Eq. 1 and expressing the upstream, or proximal valve velocity as vp, and the downstream, or distal velocity as vd, the pressure gradient (P1 P2 ¼ DP) across a valve can be expressed as:
DP ¼ |
1 |
ð2Þ |
2 rðvd2 v2pÞ |
Doppler ultrasound machines typically report velocity in units of meter per second (m s 1) and pressure in units of millimeter of mercury (mmHg). Assuming a blood density of 1.1 g mL 1 and applying the appropriate unit conversions, the 1/2 term is approximated as 4 mmHg m 2 s 2. A further simplification can be made if the proximal velocity term (the velocity at the left ventricular outflow tract for aortic valves) is small compared to the distal velocity.
434 HEART VALVE PROSTHESES, IN VITRO FLOW DYNAMICS OF
Neglecting the proximal velocity term yields the equation used by ultrasound software programs to compute pressure gradient from continuous wave velocity measurements:
DP ¼ 4ðv2Þ |
ð3Þ |
If the proximal velocity term is needed, it can be measured with pulsed wave Doppler ultrasound, which, unlike continuous wave Doppler, provides velocity spectra at a user-defined location in space (e.g., the left ventricular outflow tract).
Prior to the use of Doppler, hemodynamic assessment of prosthetic valves in vivo was performed by placing a pres- sure-measuring catheter into the heart. Comparisons between pressure gradients measured by catheter and by Doppler typically show some discrepancy between the two methods, causing some concern as to which method is more accurate. Several groups have performed in vitro and in vivo studies to compare and contrast catheter-based measurements and Doppler measurements (38–41). These comparisons are complicated by the fact that the two techniques use fundamentally different methods to arrive at the pressure gradient and they each have individual sources of approximation and error.
The primary valve-related reason for differences in Doppler and catheter measurements of pressure gradient is pressure recovery. Pressure recovery occurs when some portion of the downstream kinetic energy is converted back to potential energy (i.e., pressure). Like flow through a Venturi nozzle, the lowest pressure and highest velocity through a heart valve will occur at the narrowest point, which is typically the region immediately downstream of the valve. If the flow out of the valve is allowed to gradually expand and remains attached to the walls, there will be an increase, or recovery, of pressure further downstream relative to the pressure at the valve exit. Due to this local variation in pressure, the location of pressure measurement becomes critical. Because continuous wave Doppler measures velocities all along the beam path, it will detect the highest velocity (regardless of its location), which will then be used to calculate the pressure gradient. In contrast, catheters take direct pressure measurement at a specific location; if that location is not at the point of lowest pressure, catheter measurements of pressure gradient will tend to be lower than those derived from Doppler.
Pressure measurements across bileaflet MHVs (e.g., the St. Jude Mechanical) are further complicated because, during opening, the two side orifices are larger than the central orifice, resulting in a nonuniform velocity profile. This may be one reason why better agreement between in vitro Doppler and catheter measurements has been found for a tissue valve, which has an unobstructed central orifice, than for a bileaflet mechanical valve (39).
Flow Visualization
Clear chambers that provide visual access to the valve as well as the flow fields in its vicinity are an important feature of in vitro test systems. The use of video to asses leaflet dynamics can provide important information about valve performance that cannot be obtained from hemodynamic measurements or in vivo studies. Tissue contact with a stent, poor coaptation, asymmetric or asynchronous
leaflet closure, and leaflet rebound are all visual clues that either the valve design is inadequate or the test conditions are inappropriate.
Flow field visualization and measurements are equally important because thrombotic complications in vivo can be caused by unphysiologic, valve-induced flow patterns. Both flow stasis and high velocity leakage jets (and associated turbulent stresses) can trigger thrombosis and subsequent thromboemboli. In vitro pulsatile flow studies using blood are not a practical means of determining the thrombogenicity of a valve design because of the complexity and sensitivity of the coagulation process. Although the use of milk as an enzymatically coagulable test fluid has been reported (42–44), most in vitro assessments of a valve’s thrombogenicity are made indirectly based on its flow characteristics.
Illuminating the flow field of interest with a sheet of laser light and seeding the fluid with neutrally buoyant particles will allow for qualitative visual assessment of flow patterns (i.e, uniformity and direction of forward flow, presence of vortices or recirculation zones, areas of washout during closure.) The motion of the particles can be analyzed quantitatively with digital particle image velocimetry (DPIV), which uses the translocation of seeded particles in consecutive, laser-illuminated video frames to compute the velocity of many particles at one point in time. With these numerous velocity measurements, a velocity map of the flow field can be created from any point in the cardiac cycle.
Velocity measurements can also be performed with laser Doppler velocimetry (LDV), which allows good temporal resolution of velocity, but only at a single point. Multiple point measurements at different locations can be made sequentially and then compiled in order to construct a phase averaged velocity profile of the entire flow field. Simultaneous LDV and DPIV measurements have been performed on a MHV in an attempt to integrate the relative benefits of each method (45). Thorough flow field measurements of several prosthetic heart valves, both tissue and mechanical, have been published by Yoganathan and coworkers (46,47). During forward flow, MHVs are seen to have disrupted or eccentric velocity profiles reflective of the open occluder position, while THVs tend to have more uniform, unobstructed flow profiles.
Since blood cell damage will likely occur above some critical shear stress threshold, in vitro velocity data is used to calculate shear stresses created throughout the flow cycle, and indirectly assess the potential for hemolysis and platelet activation in vivo. The MHV leakage jets, in particular, have the potential to create high shear stresses in blood (48). It is difficult, however, for in vitro flow characterization studies to be conclusive with regard to blood damage because of the myriad of variables that interact to trigger coagulation. In addition to the magnitude of shear stresses, the exposure time to those stresses, as well as flow stagnation, material surface interactions, and patient factors can contribute to prosthetic valve thrombosis.
Design Specific Testing
Guidelines for in vitro testing heart valves prior to human use were originally introduced by the U.S. Food and Drug
HEART VALVE PROSTHESES, IN VITRO FLOW DYNAMICS OF |
435 |
Administration (FDA) in 1982. A revised document, that included guidelines for testing stentless valves, was introduced in 1994 (28). The International Standards Organization publishes a similar set of guidelines for heart valve evaluation, including the equipment and data requirements for in vitro studies (49). Many of the testing techniques in use today are motivated by and in response to these guidelines. However, standardized guidelines are often insufficient for testing new and innovative designs, since each new valve design will have unique features that may require special testing methods to evaluate. A risk analysis or failure mode analysis can be used to assess the need for in vitro testing beyond that described in the standards.
In addition to predictive studies of in vivo performance, in vitro studies may be conducted retrospectively, in order to elucidate a particular failure mode seen after a valve has been used clinically. These types of studies typically require the development of new or improved testing methodologies to investigate a particular phenomenon, as shown in the following examples.
In 1988, structural failures of the Baxter Duromedics MHV were reported in several patients (50). Surface pitting was observed on the pyrolytic carbon leaflets of the explanted valves, suggestive of cavitation-induced erosion. Cavitation occurs in a fluid when the pressure drops rapidly below the vapor pressure of the fluid, causing the formation of small vaporous cavities, which collapse violently when the pressure increases. Many in vitro studies were conducted, employing novel measurement techniques, to assess the propensity for cavitation to occur during leaflet closure of mechanical heart valves (51,52) and cavitation testing is now part of U.S. Food and Drug Administration (FDA) required preclinical testing for all new MHVs.
In the mid-1990s, the Medtronic parallel bileaflet valve experienced an unanticipated number of thrombosed valves in early clinical trials (53). Explanted valves were observed to have clot formation in the hinge region of the valve, indicating a flow-related problem in this vicinity (54). These failures occurred despite the full set of required tests having been conducted with apparently satisfactory results. Prototype valves with clear housings were constructed to allow flow visualization studies in the region of the hinge mechanism (55). Results of these studies suggested the geometry of the hinge created stagnant flow regions which may have been responsible for the clinical failures.
Clinical studies of patients with stentless valves revealed that some developed aortic regurgitation several years after implantation (56,57). Because these valves lack a support structure, it was believed that age-related dilation of the aorta strained the outflow edge of the valve, which lead to insufficient leaflet coaptation. Although FDA testing requirements for stentless valves included flow testing at elevated aortic pressures in compliant chambers, testing of mechanical dilation without an increase in pressure was not required. An in vitro study using canine hearts showed that simply pulling the aorta outward at the commisssures with sutures prevented the aortic leaflets from closing in the center (58). This study helped
confirm the need to band the aorta during implantation of some stentless valves in order to prevent later dilation.
In some cases, in vitro testing may also be employed to test the actual valve that was explanted from a patient. Depending on the age and condition of the valve, it may be mounted in a pulse duplicator and studied for signs of performance, structural or manufacturing abnormalities responsible for an adverse event in a patient.
Finally, in vitro flow studies may be conducted using valves excised from animal hearts in order to study the flow or mechanical dynamics of the native valve that in turn may be used to design improved prosthetic devices. Fresh porcine aortic roots have been installed in pulse duplicators to study the motion of the aortic valve as well to serve as a testing chamber for prosthetic valves (59–61). The porcine mitral apparatus, including chords and papillary muscles, has also been mounted and tested in vitro (62,63).
FUTURE DIRECTIONS
After more than four decades of prosthetic heart valve development, surgeons have come to rely on just a few valve designs, both mechanical and tissue, for the large majority of implants. These valves have achieved widespread use because their performance is reliable and their limitations and failure modes are known and reasonably predictable. None of these valves are ideal, however, and new designs that try to improve upon the state of the art will continue to emerge.
Although polymer valves and tissue-engineered valves still hold promise, the greatest change to be expected in the near future is not the valve itself but the way it is implanted in the heart. The success of catheter-based technologies in treating other heart diseases (e.g., coronary stents, septal defect closure devices) has inspired the pursuit and clinical evaluation of a prosthetic heart valve that can be placed in the beating heart with a catheter (64–66). This technology is attractive because it would not require opening the chest and stopping the heart, nor the use of cardiopulmonary bypass equipment.
Catheter-delivered valves will still require all the testing and analysis described above, but will also necessitate new equipment and methodologies that take into account their unique delivery and implantation method. For example, the actual delivery and deployment of these valves may first need to be simulated under in vitro pulsatile conditions, requiring testers that simulate the entry point and anatomy of the delivery path. Once deployed, the ability of the valve to seal around its perimeter and remain in place without migrating must be evaluated, which will require deployment chambers with the appropriate surface properties, mechanical properties, and dynamic motion. Also, current in vitro valve tests rarely simulate coronary flow out of the sinuses. But when testing valves that are placed in the aortic annulus under image guidance, rather than direct visualization, it will be important to evaluate valve designs in terms of their propensity to block coronary flow.
With aging populations in the United States and Europe, heart valve disease is likely to remain a significant and prevalent problem. Better, more efficient prosthetic heart
436 HEART VALVE PROSTHESES, IN VITRO FLOW DYNAMICS OF
valve technology will surely emerge to address this need and in vitro testing technologies will need to keep pace to continue helping to improve these devices and ensure their safety and efficacy for human use.
BIBLIOGRAPHY
Cited References
1.Heart Disease and Stroke Statistics—2004 Update. American Heart Association, 2004.
2.Starr A, Edwards ML. Mitral replacement: clinical experience with a ball-cage prosthesis. Ann Surg 1961;154:726– 740.
3.Starr A, Edwards ML. Mitral replacement: late results with a ball valve prosthesis. J Cardiovasc Surg 1963;45:435–447.
4.Pluth JR. The Starr valve revisited. Ann Thor Surg 1991;51: 333–334.
5.Otto CM. Valvular Heart Disease, 2nd ed. Philadelphia: Saunders; 2004.
6.Anderson RH. Clinical anatomy of the aortic root. Heart 2000;84:670–673.
7.Thubrikar M. The Aortic Valve. Boca Raton (FL): CRC Press; 1990.
8.Antunes MJ. Functional Anatomy of the Mitral Valve. In: Barlow JB, editor. Perspectives on the Mitral Valve. Philadelphia: FA Davis; 1987.
9.Kalmanson D. The mitral valve: a pluridisciplinary approach. London: Arnold; 1976.
10.Zipes DP. Braunwald’s Heart Disease. 7th ed. Philadelphia: WB Saunders; 2005.
11.Thubrikar MJ, Heckman JL, Nolan SP. High speed cineradiographic study of aortic valve leaflet motion. J Heart Valve Dis 1993;2(6):653–661.
12.Nichols WW, O’Rourke MF. McDonald’s Blood Flow in Arteries, 4th ed. London: Arnold; 1998.
13.Bonow RO, et al. ACC/AHA guidelines for the management of patients with valvular heart disease: a report of the American College of Cardiology/American Heart Association Task Force on Practice Guidelines. J Am College Cardiol 1998;32: 1486–1588.
14.Levine RA, et al. Three-Dimensional echocardiographic reconstruction of the mitral valve, with implications for the diagnosis of mitral valve prolapse. Circulation 1989;80: 589–598.
15.Yellin EL, et al. Mechanisms of mitral valve motion during diastole. Am J Physiol 1981;241:H389–H400.
16.Komeda M, et al. Papillary muscle-left ventricular wall ‘‘complex’’. J Thor Cardiovasc Surg, 1997;113:292–301.
17.Ellis JT, et al. An in vitro investigation of the retrograde flow fields of two bileaflet mechanical heart valves. J Heart Valve Dis 1996;5(6):600–606.
18.Anonymous Focus on Heart Valves, Medical Device and Diagnostic Industry, vol. 126, March 2004.
19.Banbury MK, et al., Hemodynamic stability during 17 years of the Carpentier-Edwards aortic pericardial bioprosthesis. Ann Thor Surg 2002;73(5):1460–1465.
20.Hyde JA, Chinn JA, Phillips RE., Jr., Polymer Heart Valves. J Heart Valve Dis 1999;8(3):331–339.
21.Hoerstup SP, Kadner A, Melnitchouk S. Tissue engineering of a functional trileaflet heart valve from human marrow stromal cells. Circulation 2002;106 (Suppl. I):143–150.
22.Cebatori S, Mertsching H, Kallenbach K. Construction of autologous human heart valves based on an acellular allograft matrix. Circulation 2002;106 (Suppl. I):63–68.
23.Bertipaglia B, Ortolani F, Petrelli L. Cell cellularization of porcine aortic valve and decellularized leaflets repopulated
with aortic valve interstitial cells: the VESALIO project. Ann Thor Surg 2003;75:1274–1282.
24.Reul H, Minamitani H, Runge J. A hydraulic analog of the systemic and pulmonary circulation for testing artificial hearts. Proc ESAO 1975;2:120.
25.Scotten LN, et al. New tilting disc cardiac valve prostheses. J Thor Cardiovasc Surg 1986;82:136–146.
26.Pohl M, et al. In vitro testing of artificial heart valves:comparison between Newtonian and non-Newtonian fluids. Arti Organs 1996;20(1):37–46.
27.Weiting DW. Dynamic flow characteristics of heart valves dissertation. University of Texas, Austin, 1969.
28.U.S. Department of Health and Human Services, Public Health Service, Food and Drug Administration, Center for Devices and Radiological Health, Replacement Heart Valve Guidance, 1994.
29.Kadem L, et al. Independent contribution of left ventricular ejection time to the mean gradient in aortic stenosis. J. Heart Valve Dis 2002;11(5):615–623.
30.Razzolini R, et al. Transaortic gradient is pressure-depen- dent in a pulsatile model of the circulation. J Heart Valve Dis 1999;8(3):279–283.
31.Scotten LN, Walker DK. New laboratory technique measures projected dynamic area of prosthetic heart valves. J Heart Valve Dis 2004;13(1):120–132.
32.Cochran RP, Kunzelman KS. Discrepancies between labeled and actual dimensions of prosthetic valves and sizers. J Cardiovasc Surg 1996;11:318–324.
33.Stewart SFC, Bushar HF. Improved statistical characterization of prosthetic heart valve hemodynamics using a performance index and regression analysis. J Heart Valve Dis 2002;11:270–274.
34.Van Auker MD, Strom JA. Inter-Laboratory comparisons: approaching a new standard for prosthetic heart valve testing in vitro. J Heart Valve Dis 1999;8(4):384–391.
35.Walker DK, Scotten LN. A database obtained from in vitro function testing of mechanical heart valves. J Heart Valve Dis 1994;3(5):561–570.
36.Fisher J. Comparative study of the hydrodynamic function of six size 19 mm bileaflet heart valves. Eur J Cardiothora Surg 1995;9(12):692–695.
37.Marquez S, Hon RT, Yoganathan AP. Comparative hemodynamic evaluation of bioprosthetic heart valves. J Heart Valve Dis 2001;10(6):802–811.
38.Vandervoort PM, et al. Pressure recovery in bileaflet heart valve prostheses. Circulation 1995;92:3464–3472.
39.Baumgartner H, et al. Discrepancies between Doppler and catheter gradients in aortic prosthetic valves in vitro. A manifestation of localized gradients and pressure recovery. Circulation 1990;82:1467–1475.
40.Burstow DJ, et al. Continuous wave Doppler echocardiographic measurement of prosthetic valve gradients. A simultaneous Doppler-catheter correlative study. Circulation 1989; 80(3):504–514.
41.Bech-Hanssen O, et al. Assessment of effective orifice area of prosthetic valves with Doppler echocardiography: and in vivo and in vitro study. J Thorac Cardiovasc Surg 2001;122(2): 287–295.
42.Lewis JM, Macleod N. A blood analogue for the experimental study of flow-related thrombosis at prosthetic heart valves. Cardiovasc Res 1983;17(8):466–475.
43.Keggen LA, et al. The use of enzyme activated milk for in vitro simulation of prosthetic valve thrombosis. J Heart Valve Dis 1996;5(1):74–83.
44.Martin AJ, Christy JR. An in vitro technique for assessment of thrombogenicity in mechanical prosthetic cardiac valves: evaluation with a range of valve types. J Heart Valve Dis 2004;13(3):509–520.