

132ELECTROPHORESIS
79.Leventhal DK, Durand DD. Chronic measurement of the stimulation selectivity of the flat interface nerve electrode. IEEE Trans Biomed Eng 2004;51(9):1649–1658.
80.Popovic D, Sinkjær T. Control of movement for the physically disabled: control for rehabilitation technology. 2nd ed. Aalborg: Center for Sensory Motor Interaction, Aalborg University; 2003.
81.Lyons GM, Sinkjær T, Burridge JH, Wilcox DJ. A review of portable FES-based neural orthoses for the correction of drop foot. IEEE Trans Neural Syst Rehabil Eng 2002;10(2): 260–279.
82.Haugland M, Sinkjaer T. Interfacing the body’s own sensing receptors into neural prosthesis devices. Technol Health Care 1999;7(6):393–399.
83.Kostov A, Hansen M, Haugland M, Sinkjær T. Adaptive restrictive rules provide functional and safe stimulation patterns for foot drop correction. Art Organs 1999;23(5): 443–447.
84.Haugland M, Sinkjær T. Cutaneous Whole Nerve Recordings Used for Correction of Footdrop in Hemiplegic Man. IEEE Trans Rehab Eng 1995;3:307–317.
85.Johansson RS, Westling G. Tactile sensibility in the human hand: Relative and absolute densities of four types of mechanireceptive units in glabrous skin. J Physiol 1979;
21:270–289.
˚
86. Vallbo A, Johannson RS. Properties of cutaneous mechanoreceptors in the human hand related to touch sensation. Human Neurobiol 1984;3:3–14.
87. Westling G, Johansson RS. Responses in glabrous skin mechanoreceptors during precision grip in humans. Exper Brain Res 1987;66:128–140.
88. Haugland M, Lickel A, Haase J, Sinkjær T. Control of FES Thumb Force Using Slip Information Obtained from the Cutaneous Electroneurogram in Quadriplegic Man. IEEE Trans Rehab Eng 1999;7:215–227.
89. Haugland M, et al. Restoration of lateral hand grasp using natural sensors. Art Organs 1997;21(3):250–253.
90. Inmann A, Haugland M. Implementation of natural sensory feedback in a portable control system for a hand grasp neuroprosthesis. Med Eng Phy 2004;26:449– 458.
91. Inmann A, Haugland M. Functional evaluation of natural sensory feedback incorporated in hand grasp neurprosthesis. Med Eng Phys 2004; 26(6):439–447.
92. Inmann A, et al. Signals from skin mechanoreceptors used in control of hand grasp neurosthesis. Neuroreport 2001;12(13): 2817–2820.
93. Jensen W, Yoshida K. Long-term recording properties of longitudinal intra-fascicular electrodes. 7th Annual Conference of the International Functional Electrical Stimulation Society, IFESS 2002, June 25–29, Ljubljana: Slovenia; 2002 p 138–140.
94. Riso R, Mossallaie FK, Jensen W, Sinkjær T. Nerve Cuff Recordings of Muscle Afferent Activity from Tibial and Peroneal Nerves in Rabbit During Passive Ankle Motion. IEEE Trans Rehab Eng 2000;8(2):244–258.
95. Jensen W, Riso R, Sinkjær T. Position Information in Whole Nerve Cuff Recordings of Muscle Afferents in a Rabbit Model of Normal and Paraplegic Standing. Proceedings of the 20th Annual International Conferences of the IEEE/ EMBS Society. 1998.
96. Micera S, et al. Neuro-fuzzy extraction of angular information from muscle afferents for ankle control during standing in paraplegic subjects: an animal model. IEEE Trans Biomed Eng 2001;48(7):787–789.
97. Jensen W, Sinkjær T, Sepulveda F. Improving signal reliability for on-line joint angle estimation from nerve cuff
recordings of muscle afferents. IEEE Trans Neural Syst Rehabil Eng 2002; 10(3):133–139.
98.Sepulveda F, Jensen W, Sinkjær T. Using Nerve Signals from Muscle Afferent Electrodes to Control FES-based Ankle Motion in a Rabbit. Proceedings 23rd Annual International Conference of the IEEE-EMBS. 2001.
99.Jezernik S, et al. Analysis of Bladder Related Nerve Cuff Electrode Recordings from Preganglion Pelvic Nerve and Sacrral Roots in Pigs. J Urol 2000;163:1309–1314.
100.Kurstjens M, et al. Interoperative recording of sacral root nerve signals in humans. Art Organs 2005;29(3):242– 245.
101.Jezernik S, Grill WM, Sinkjær T. Detection and inhibition of hyperreflexia-like bladder contractions in the cat by sacral nerve root recording and stimulation. Neurouol Urodyn 2001;20:215–230.
102.Sahin M, Durand DD, Haxhiu MA. Closed-loop stimulation of hypoglossan nerve in a dog model of upper airway obstruction. IEEE Trans Biomed Eng 2000;47(7):919–925.
103.Sahin M, Durand DD, Haxhiu MA. Chronic recordings of hypoglossal nerve activity in a dog model of upper airway obstruction. J App Physi 1999;87(6):2197–2206.
See also ELECTROMYOGRAPHY; EVOKED POTENTIALS; NEUROLOGICAL MONITORS.
ELECTROPHORESIS
JOHN M. BREWER
University of Georgia
Athens, Georgia
INTRODUCTION
The ‘‘electrostatic effect’’ causes particles with the same sign of charge to repel each other, while two particles of opposite charge attract: Charged particles produce electric fields and a charged particle in an electric field experiences a force. Electrophoretic techniques are based on the movement or flow of ions in a solvent produced by an electric field, causing separation of different ions.
THEORY
An external electric field V produces a force on an ion with a charge Q equal to VQ(1). An ion in a solvent will be accelerated, but movement in the solvent will be slowed by an opposite force that comes from the viscosity of the solvent. For small velocities, the opposite (viscous) force is proportional to the velocity of electrophoresis. We call the proportionality constant the ‘‘frictional coefficient’’. The forces from the electric field and viscosity are opposed, so the net acceleration becomes zero and the velocity of electrophoresis (v) constant:
v ¼ VQ=frictional coefficient
Mobilities of Ions
The velocity an ion reaches for a given applied field is a specific property of that ion. It is called the ‘‘mobility’’ of
(a) |
Upper |
Upper reservoir |
|
electrode |
solution |
Power supply |
Electrophoresis column |
|
|
|
Supporting medium |
|
|
|
|
|
|
|
Lower |
|
|
|
|
|
|
Lower reservoir |
||
|
|
|
|
|
|
|
electrode |
|
|
|
|
|
|
|
solution |
|
(b) |
|
|
|
|
Upper reservoir solution |
|
|
|
|
|||||||
|
|
|
|
|
|
|
Upper electrode |
|
|
|
|
|||||
|
|
A |
A B |
A |
B |
|
B |
|
|
|
B |
|
|
V/cm along |
||
|
|
|
A A |
|
A |
column |
||||||||||
|
|
B |
B |
A |
A |
A |
||||||||||
|
|
|
|
|
|
|
B |
|
|
|
|
|||||
|
|
|
|
|
A |
|
|
|
A |
|
|
B |
|
|
||
|
|
|
B |
|
|
|
|
|
|
|
B |
|
||||
|
|
|
|
|
|
|
|
B |
B |
A |
|
|
||||
electrophoresis:ofDirection ionForB A,ionsForC, and D |
A |
A |
|
|
|
|
|
|||||||||
|
|
|
|
A |
|
|
|
|
||||||||
B |
|
|
|
|
|
B |
B |
|
alongDistancecolumn |
|||||||
|
C |
|
|
|
|
|
||||||||||
|
|
|
|
B |
B |
|
|
|
A |
|
|
|
|
|
A |
|
|
|
|
B |
B A |
Boundaries |
|
D |
B |
|
B |
|
|
||||
|
|
|
A |
|
B |
|
|
|
B |
D |
|
A |
|
|
|
|
|
|
|
B |
C |
|
|
|
C |
B |
D B B D |
|
|||||
|
|
|
|
|
|
|
|
C |
|
|
|
|
||||
|
|
|
|
B |
|
|
|
|
C |
B |
|
|
||||
|
|
|
C |
C |
|
|
|
B |
B |
|
|
|||||
|
|
|
|
|
|
|
|
B |
|
C |
|
|||||
|
|
|
|
|
|
|
C |
|
|
|
|
|
||||
|
|
|
|
|
|
|
|
|
|
|
|
|
|
|||
|
|
|
|
|
|
|
|
|
C |
|
|
|
|
|||
|
|
|
C |
|
|
|
|
|
B |
C |
|
C |
|
|||
|
|
|
|
|
|
|
|
|
|
|||||||
|
|
|
|
B |
|
|
|
C |
B |
|
|
|
||||
|
|
|
B |
|
|
|
B |
C |
|
|||||||
|
|
B |
C |
|
|
|
|
|
|
|
||||||
|
|
B |
|
|
|
|
|
|
B |
|||||||
|
|
|
|
|
|
|
|
|
|
|
B |
|
||||
|
|
C |
C |
|
|
|
Lower reservoir solution |
|
C |
|||||||
|
|
|
|
C |
|
C |
||||||||||
|
|
|
B |
|
|
Lower electrode |
|
B |
|
|||||||
|
|
|
|
|
|
|
|
|
|
|
|
|
|
|
|
|
ELECTROPHORESIS 133
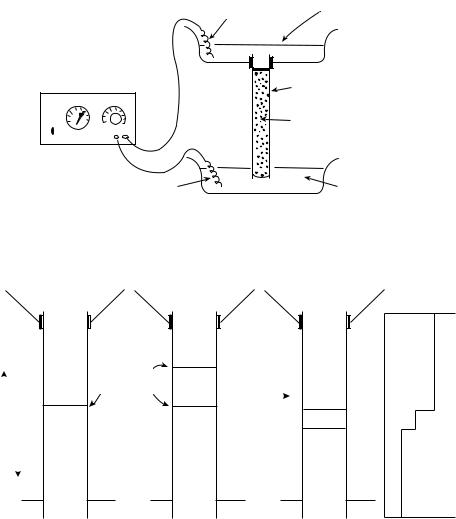
Figure 1. (a) Representation of a vertical electrophoresis experiment.
(b) The lower drawing represents the stacking phase of disk electrophoresis or isotachophoresis of a single component, ion D. Charge signs are omitted as cationic and anionic isotachophoretic or disk systems exist. (Reprinted from Clinical Chemistry: Theory, Analysis, Correlation, 4th ed. Kaplan LA, Pesce AJ, Kazmierczak SC, editors, Electrophoresis, p 204, copyright # 2003, with permission from Elsevier.)
that ion:
v=V ¼ mobility of ion ¼ Q=frictional coefficient
For ions such as proteins that are very large compared with solvent molecules, the frictional coefficient is 6p times the product of the solvent viscosity and the effective radius (size) of the ion (1).
The direction the ion moves is determined by the sign of its charge Q and the direction of the electric field. The electric field is produced by two oppositely charged substances (electrodes) placed at opposite ends of the solution the ion is in, and their polarity (charge) determines the field’s direction (Fig. 1) (2).
How fast ions in solution move is also affected by some other factors, but these are still hard to calculate (1,3). In aqueous solvents, ions are ‘‘hydrated’’, bound to a number of water molecules (4,5). A protein has many charged groups, both positive and negative, and those in contact with the solvent also will be hydrated (6) and will in addition have hydrated ions of opposite charge, called
‘‘counterions’’, nearby. In an electrophoresis apparatus (Fig. 1), the protein will move toward the electrode of opposite charge in an irregular fashion because random diffusional motion adds to the uniform electrophoretic movement. After each change of direction, the smaller ions of opposite charge are out of their equilibrium positions and need time(s) to readjust or move back into position. During the readjustment period(s), the effective voltage that the protein is exposed to is lower than the applied voltage, because the smaller counterions, while out of position, produce a field in the opposite direction.
Positively charged ions (cations) move in the opposite direction to negative ions (anions). They all are hydrated and the movement of the protein or other large ion of interest is slowed by a flow of hydrated ions of opposite charge (counterions) in the opposite direction. This is called an ‘‘electrophoretic effect’’ and, together with the ‘‘relaxation’’ or ‘‘asymmetry’’ effect described before, makes it difficult to use the measured velocities of large ions to calculate their real net charge or effective radius (1,3). Electrophoresis is consequently used largely as an empirical technique.
134 ELECTROPHORESIS
The mobilities of many small ions are known (7). These values are for fully charged ions. The actual (average) charge of ions like acetate depends on the pH, so the observed or actual (effective) mobility of some ions will also be pH dependent.
Effective mobility ¼ ðmobilityÞðaverage chargeÞ
Proteins or polynucleotides have charged groups that determine their ionic properties. These charged groups in proteins are anionic and cationic, with pK values from 3 to 13, so the effective mobilities of proteins are very pH dependent. For proteins, overall (net) charges vary from positive at low pH to zero (isoelectric) to negative at more alkaline pH values. Substances whose charge can vary from positive to negative are called ‘‘amphoteric’’. Routine electrophoretic separations are done at constant pH values, in a ‘‘buffered’’ solution, to minimize effects of pH on velocity of movement.
Electrical Effects
These techniques are electrical in character. An applied voltage V produces movement of oppositely charged ions in opposite directions. These flows of ions are the current i. Solvents resist movement of ions through them and this resistance is R, so that V ¼ iR, just as in a wire or any other electrical device. People using electrophoresis are interested in ion movement, so the reciprocal of the resistance, called the ‘‘conductivity’’ (s), is used instead: sV ¼ i.
Several factors determine the conductivity of a solution. The conductivity is proportional to the concentrations of the ions present (actually to their thermodynamic activities). It is also proportional to their mobilities or, if the pH is a factor, to their effective mobilities. Since all ions contribute,
XX
s / |
si / |
ðconcentrationÞiðmobilityÞiðaverage chargeÞi |
The conductivity is also proportional to the cross-sectional area through which the ions move, but the area is usually constant.
The current must be constant in any tube or channel through which electrophoresis is occurring. There can be no gaps or accumulations of current. Since the conductivity in different parts of the tube may be different (see below), the voltage along a tube or channel may also differ in different parts of the tube or channel.
The purpose of electrophoresis is to separate ions and this may be measured from the movements of a large number of molecules using band broadening of scattered laser light owing to Doppler effects (8), by following the movement of the interface or ‘‘boundary’’ between a solution of a particular ion and the solvent, or by following the movement of a region or ‘‘zone’’ containing an ion of interest through a solvent (Fig. 1). Currently, most workers follow the position(s) of relatively thin zone(s) of material, since complete separation of a mixture takes less time the thinner the original zone of the mixture is. However, even the thinnest zone contains a leading boundary at the front and a trailing boundary at the back, so the following discussion applies to zone and boundary methods. We assume the ion of interest is a large one, say a protein.
The large ion is usually restricted at first to one part of the tube or channel through which electrophoresis occurs. The solvent in other parts must also contain ions, usually small ones, to carry the current where the large ion is not present. In other words, the large ion is part of the electrical system and so carries part of the current and contributes to the conductivity. It will move in the same direction as small ions with the same charge, called ‘‘coions’’. So the large ion is competing with the co-ions to carry the current.
The large ions must replace equivalent amounts (in terms of charge) of co-ions so that an excess of ions of one charge never accumulates anywhere. In other words, total positive charges must always equal total negative charges (electroneutrality principle). Large ions often have lower mobilities than co-ions. The co-ions are diluted by the large ions with a lower mobility. The moving zone with the large ions has then a lower average conductivity.
Since gaps in the current cannot occur, the zone with the large ions must keep up with the co-ions it is partially replacing. To do this, the voltage in the large ion-containing zone must increase to keep the current constant. If a single large ion diffuses across the leading large ion–solvent boundary, it has moved into a region of higher conductivity and lower voltage. Consequently, the single large ion slows down until the large ion zone catches up (2,7).
At the trailing boundary, co-ions with higher mobilities are replacing lower mobility large ions. This increases the conductivity in the region the large ions just left. The voltage right behind the trailing boundary is consequently lower. If a single large ion diffuses back into that region, it will be in a lower voltage and will move more slowly than the large ions in the large ion zone.
The effect of this competition is to cause zones of large ions with mobilities lower than those of the co-ions to be sharp at the leading boundary and diffuse at the trailing boundary. In other words, zone broadening due to diffusion of the large ions is either reduced or increased at the front (leading) and rear (trailing) edges, respectively, of the zone, depending on the relative mobilities of large ions and coions.
There may be effects of pH as well. The small co-ions and counterions are often also used to maintain the pH. The competition between large ions and co-ions, by reducing coion movement, leads to changes in the ratio of co-ion to counterion where the large ions have moved in or out of a region. The pH is affected by the ratio of small conjugate acid and base ions, either of which may be the co-ion, so movement of the large ion is accompanied by changes in pH. Changes in pH can change the net charge on the large ion, especially if it is a protein, and so change its effective mobility. Changes in the pH where electrophoresis is occurring can add to or reduce the competition effects described above.
Enhancing Resolution
Separations of substances produced by any procedure will be counteracted by the resulting diffusion of the separated substances, so diffusion should be reduced as much as possible. The competition between ions with the same
charge during electrophoresis can add to or counteract diffusion, and this is the basis of ‘‘mobility-based’’ enhanced resolution techniques.
Mobility-Based Methods. Instead of a zone of solution containing large and small ions set between zones of solvent containing the same small ions, we put different small ions on either side of the large ion zone. This is a ‘‘discontinuous’’ solvent system (2,3,7).
Figure 1b shows an upright cylinder whose lower half is filled with co-ion C and counterion B. The upper half of the cylinder has co-ion A and counterion B. An electric field is applied so that the A ions follow the C ions toward one electrode. If the mobility of the A ion and conductivity of the A solution are less than those of the C solution, the boundary between the solutions will move but diffusion across the boundary by either ion will be restricted. Since the current must be the same all along the tube, the lower conductivity A solution must have a higher voltage making the A ions keep up with the C ions. If A ions diffused ahead into the C solution, the A ions would be in a lower voltage region and would slow until the rest of the A solution caught up. If C ions diffused back into the A solution, the higher voltage there would drive them back to the C solution.
Suppose a solution of ions B and D was inserted between the AB and CB solutions. If ion D has a mobility intermediate between those of A and C, it will remain ‘‘sandwiched’’ between the AB and CB solutions and diffusion will be restricted across the AD and DC boundaries. Suppose further that a mixture of ions DEFG . . . of the same charge as A and C were originally present in the intermediate solution and these had mobilities intermediate to those of A and C. Even if DEFG . . . were originally mixed together, they would separate and travel, each in separate but adjacent subzones, in order of decreasing mobility going from the C zone to the A zone, all at the same velocity and all with sharply maintained boundaries.
Another effect that occurs in discontinuous systems involves concentrations. If the DEFG . . . ions were originally very dilute in their original zone, their zone would compress and each ion’s subzone would become relatively thin upon starting the electrophoresis. This is because each ion subzone must carry as much current as the A and C zones, and the higher the conductivities of the AB and CB solutions, the thinner the DEFG . . . subzones will get. If DEFG . . . are different proteins, which generally have very high molecular weights and relatively low net charges, the subzones will become very thin indeed. The ‘‘running’’ concentrations of DEFG . . . will become very high.
If the pattern produced by DEFG . . . as they move down the column is determined or if they are made to elute from the column as they emerge from it, the process is called ‘‘isotachophoresis’’, since DEFG . . . all move at the same velocity (7). Having DEFG . . . unseparated from each other makes analysis or preparation difficult, and isotachophoresis is currently relatively little used.
The most frequently employed procedure to separate DEFG . . . is to increase the effective mobility of the A ion so that it runs through the DEFG . . . subzones (2,7). These are then in a uniform electric field, that of the AB solution, and so electrophorese independently. While the separating
ELECTROPHORESIS 135
subzones also begin to diffuse, they were ‘‘stacked’’ in very concentrated, and hence thin subzones. The thinner the subzone is before independent electrophoresis, the thinner it will be at the end of electrophoresis and the better the resolution. This approach is employed in ‘‘disk electrophoresis’’.
The A ion is of lower mobility than the C ion and the pH used lowers its effective mobility further. To increase the effective mobility of the A ion, the original CB solution contains a high concentration of the uncharged conjugate acid or base of the B ion. The ions (and conjugate acid or base) are chosen so that when A replaces C its average net charge increases because of the new or ‘‘running’’ pH, which is controlled by the ratio of B ion to its conjugate acid or base.
It must be emphasized that the running concentrations of the ions and uncharged acids or bases are not arbitrary but are controlled by the physical (electrical) constraints mentioned before and alter if they do not conform initially. The constraints are summarized mathematically in Ref. 7.
The importance of the B ion is emphasized by examination of another electrophoretic technique. Suppose the concentration of the B ion is reduced to zero. Since transport of ions must occur in both directions, reduction of the B ion concentration to zero will reduce migration of A, DEFG
. . ., and C to zero (or nearly zero: in aqueous solvents, there will always be some movement due to ionization of water) (7,9). A, DEFG . . ., and C will be stacked. Since B must be replaced, because of electrical neutrality, with protons or hydroxyl ions, amphoteric ions such as proteins will be ‘‘isoionic’’. The pH of each zone or subzone is that at which each amphoteric ion has zero net charge. This technique is termed ‘‘isoelectric focusing’’.
To separate DEFG . . . a mixture of relatively low molecular weight amphoteric substances such as ‘‘carrier ampholyte’’ is added before voltage is applied. These substances have a range of isoelectric points, but the pK values of their acidic and basic groups are close to each other, so they stack to produce a buffered pH gradient (7,10). Indeed, they are prepared and sold on the basis of the pH range they cover.
The proteins ‘‘band’’ or collect at their characteristic isoionic pH values. This state does not last indefinitely, however, since the stacked ampholytes and proteins behave like an isotachophoretic system unless the pH gradient is physically immobilized (7) (see below). Isoelectric focusing is frequently used preparatively, since large amounts of protein may be processed.
Supporting Media-Based Methods. A mechanical problem results from any zone separation procedure. Higher resolution results in thinner separated zones. These are more concentrated, and so are significantly denser than the surrounding solvent, which leads to ‘‘convection’’: the zones fall through the solvent and mix with it. This must be prevented. A preparative isoelectric focusing apparatus uses a density gradient of sucrose or other nonionic substance that contains ions DEFG . . . and the carrier ampholytes. The separated zones of D, E, and other ions are buoyed by the increasingly dense solvent below them.
136 ELECTROPHORESIS
Sucrose density gradients have no mechanical strength, so the electrophoresis pathway must be vertical, and in any case the gradient only reduces convection. Generally, a solid or semisolid supporting medium is used. This can be fibrous (paper, cellulose acetate), particulate (cellulose powder, glass beads), or a gel (starch, agar, polyacrylamide). A gel is a network of interacting or tangled fibers or polymers that traps large quantities of solvent in the network. To increase mechanical strength, some polymers can be covalently crosslinked as is routinely done with polyacrylamide supports. Gels usually have a uniform percentage of gel material, but can be prepared with a gradient of gel material or other substances such as urea (10).
Support media should allow as free a passage as possible to electrophoresing ions while restricting convection. Convection (bulk flow) in a capillary is proportional to the fourth power of the capillary radius (1), but the area available for electrophoretic movement is proportional to the square of the radius. Reducing the radius reduces convection much more than the carrying capacity (area) of the capillary.
Capillary tubes can be used without supporting material inside (capillary electrophoresis) (11), but the other materials operate by offering a restricted effective pore size for electrophoretic transport. The effective pore size varies with the medium: 1–2% agar gels have larger average pore sizes than polyacrylamide gels made from 5 to 10% acrylamide solutions.
The importance of the supporting medium is illustrated by an immunoelectrophoretic technique. Electrophoresis is used to separate antigens before antibody diffuses into the separated antigens (immunodiffusion) (12,13). Immunodiffusion requires supports with average pore sizes large enough to allow antibodies, which are large and asymmetric immunoglobins, to diffuse through them, while still stabilizing the zones of precipitate that form. Agar gels, at 1–2% concentrations, are used.
A support medium is in very extensive contact with the solution. Even a capillary tube has a great deal of surface relative to the volume of solution within. Interaction with the support or capillary surface is often not wanted: chemical interactions with the ions being separated or with the other constituents of the solvent interfere with the ion movement. Adsorption of some substances by the fused silica surfaces of capillaries used in electrophoresis can occur (11). The surface must then be coated with inert material. Support media are often chosen for having as little effect on electrophoresis as possible. Such effects are called ‘‘electroosmosis’’: the solvent flows in an electric field
(4). If the medium or capillary inner surface has charged groups, these must have counterions. The charged groups fixed in the matrix of the medium or capillary tube and their counterions are hydrated, but only the counterions can move in an electric field. The counterion movement causes solvent flow next to the capillary wall or support medium.
This case is extreme, but some electroosmosis occurs with any medium. Interaction of any two different substances results in a chemical potential gradient across the interface (4). This is equivalent to an electrical potential difference. Electroosmosis can distort zones of separated
ions, reducing separation, but as capillaries become thinner or average pore sizes smaller, sideways (to electrophoretic movement) diffusion tends to overcome effects of electroosmosis (7).
Electrophoretic procedures are to produce separations, and if interactions of any kind improve separations, they are desirable. Separation of serum proteins by capillary electrophoresis in a commercial apparatus (BeckmanCoulter Paragon CZE 2000) depends partly on electroosmotic flow stemming from charged groups on the silica surface of the capillary.
Electrophoresis in solutions containing ionic detergents can separate uncharged substances. Detergents form clusters in water solutions called ‘‘micelles’’ with hydrophilic surfaces and hydrophobic interiors. Micelles of ionic detergents move in an electric field, and uncharged substances, if they partition into the micelles, will be moved along in proportion to the extent of their partitioning. This is ‘‘micellar electrokinetic chromatography’’ (11).
Electrophoresis in support media that reversibly adsorb substances being separated is called ‘‘electrochromatography’’. Unlike conventional chromatography, which uses hydrostatic pressure to move solutions of substances to be separated through the medium, electrochromatography uses an electric field.
The interactions with support media used to increase resolution of electrophoretic separations range from indirect to actual adsorption.
Acrylamide derivatives that will act as buffers over a desired pH range are incorporated into polyacrylamide gels and used in isoelectric focusing (7,9,10). These are called Immobilines. They provide stable pH gradients (7) and control movement of amphoteric ions by controlling the pH. They also stabilize zones of protein that form.
Electrophoretic or diffusional movement of large ions is reduced by supports, since they increase the tortuousness of the path the ions must follow. If the average pore size is made comparable to the effective sizes of the ions undergoing electrophoresis, the ions are literally filtered though the medium so that smaller ions would be least retarded and larger ions retarded more. This ‘‘molecular sieving’’ effect can improve the resolution achievable by electrophoretic techniques: the leading edges of zones of large ions are slowed by the gel matrix allowing the rest of the zones to catch up. This makes zones of larger ions thinner and restricts subsequent diffusion.
This effect can also provide information about the physical characteristics of the ions. The effective mobilities of large ions are determined by their net charges and frictional coefficients. The latter is affected by the shape of the large ion: A very asymmetric molecule has a larger effective size than a more compact one (1,3). Two molecules of identical charge and molecular weight can be separated even in the absence of a support if they have sufficiently different shapes. Effective sizes can be determined from electrophoresis on several gels with different average pore sizes. Effective sizes can be used to calculate diffusion constants (1,3), though they are normally used to obtain molecular weights. Large ions of known molecular weights may be electrophoresed on the same gels to calibrate the pore sizes of the gels (12,13) (see below).
If a mixture of large ions of differing shapes and sizes is converted to a mixture with different sizes but the same shape, then they will migrate according to their net charges and molecular weights. If the charges are made a constant function of the molecular weight then the ions will separate according to their molecular weights alone (3,10,12,13). The degree of separation will also be affected by the average pore size of the medium. Proteins that consist entirely or nearly so of amino acids and that have been treated to reduce any disulfide bonds are usually converted to rodlike structures with a nearly constant charge-to-mass ratio by adding the detergent, sodium dodecyl sulfate (SDS). The detergent binds to such proteins in large and highly uniform amounts (3,12,13). The protein–SDS complexes then migrate in order of decreasing polypeptide molecular weight (see below). It is important to recognize that some proteins may not behave ‘‘normally’’ in these respects, for example, if they contain large amounts of carbohydrate. The SDS–PAGE method, as it is called, is currently probably the single most widely used electrophoresis technique in research laboratories.
Polynucleotide fragments have a relatively constant charge-to-mass ratio at physiological pH values, since each nucleotide is of similar molecular weight and has only a single charged group: the phosphate. If they have the same shape, separation of such fragments can be effected on the basis of molecular weight (i.e., number of nucleotides) by electrophoresis (10,13). This is the basis of the technique for determining polynucleotide sequences (see below).
It is possible to separate and measure molecular weights of native (double-stranded) DNA molecules that are larger than the average pore size of the support medium (14). The electric field pulls on all segments of the DNA equally, but eventually, because of random thermal movement, one end is farther along the field direction and the entire molecule is pulled after that end along a path through the gel. If the field is turned off, the stretched molecule contracts or relaxes into a more compact, unstretched condition. If the electric field is turned on again, the process starts over. The rates of these processes are slower with longer DNAs, so, if the rate of change of field direction is appropriate, the DNAs will separate according to size. If not, they will tend to run together. The change in direction of the applied field and the length of time the field is applied in any direction can be adjusted in commercial instruments. The gel used is agarose (agar without the agaropectin). This is ‘‘pulsedfield’’ gel electrophoresis, and can separate DNA molecules as large as small chromosomes.
Sometimes adsorption strong enough to terminate electrophoretic movement is desired. Substances are separated on a sheet or thin slab of ordinary support medium, then an electric field is applied perpendicular to the face of the sheet and the separated substances are electrophoresed onto a facing sheet of adsorbent material such as nitrocellulose paper. This is ‘‘electroblotting’’ (13,15,16). It concentrates the electroeluted substances on the adsorbent sheet. This makes immunological detection (immunoblotting) or detection by any other method more sensitive (15,16). If the separated substances blotted are DNA, this is ‘‘Southern blotting’’ (17); RNA, ‘‘Northern blotting’’; protein, ‘‘Western blotting’’ (10,13,15,16). These procedures are to identify
ELECTROPHORESIS 137
particular proteins or polynucleotides with particular sequences.
Cells in living organisms produce tens of thousands of proteins and polynucleotides, and in very different amounts: for example, the concentrations of serum proteins differ by up to 107-fold, complicating analysis. Increased resolution has been also achieved through use of two-dimensional (2D) electrophoresis. Some 30–60 proteins can be resolved on a column or sheet of polyacrylamide. If electrophoresis is done in two dimensions, with separation on the basis of different properties of the proteins, 900–3600 proteins could be resolved (18,19). The most popular form of 2D electrophoresis involves isoelectric focusing on a gel strip for one dimension, attaching the gel strip to a gel sheet, and performing SDS–gel electrophoresis for the second dimension. Densitometers to scan the gels and software for computerized mapping and indexing of isolated proteins to help analyze the data are available commercially, for example, from BioRad Corp. and Amersham Biosciences Corp. The procedure is laborious and exacting; many factors affect the patterns obtained (19). Use of Immobiline gel strips for the first dimension separation is very important in improving reproducibility (19). The realized or potential information from 2D electrophoresis is so great that it is a very popular technique in research laboratories.
Voltage-Based Methods. Since diffusion is the enemy of separation and increases with the square root of the time (1), it is obviously better to carry out the electrophoresis faster. Since the velocity of electrophoresis increases with the voltage applied, using a higher voltage would improve resolution. However, increasing the voltage also increases the current and this increases electrophoretic heating, called ‘‘Joule heating’’. Joule heating is proportional to the wattage (volts times current) and can cause convective disturbances in solutions, even if a support medium is present. Joule heating is part of the reason electrophoresis is done in solutions with moderate conductivities, equivalent to 0.1 M NaCl or thereabouts (13): Ion concentrations must be high enough to minimize electrostatic interactions between large molecules (1), but high ion concentrations mean high conductivities, which means high current flow at a given voltage and therefore high heat generation. Joule heating is in fact the ultimate limiting factor in any electrophoretic procedure.
Use of thinner supports or capillaries minimizes the effects of heating. Thin (< 1 mm thick) sheets of polyacrylamide allow more efficient heat dissipation (from both sides) and are also useful when comparing samples. They are necessary for 2D electrophoresis (18,19). Thinner supports use less material but require more sensitivity of analysis. Capillaries are even more easily cooled (from all sides) and very high voltages, of the order of several thousand volts, can be used (11). The Beckman Coulter Paragon CZE 2000 has seven capillaries so can accommodate seven samples at once, and serum protein electrophoresis turnaround times are 10 min. Very small sample volumes, often a few nanoliters, are used. On the other hand, electroosmosis can be a major problem and the detection sensitivity is very low: the separated substances
138 ELECTROPHORESIS
pass a detector, and the capillaries, usually < 0.1 mm in diameter, provide a very short optical pathlength. Detection at very short wavelengths such as 214 nm, where extinction coefficients are higher or use of other measuring methods such as fluorescence or mass spectrometry are alternatives that are employed. Still, the ability to use higher voltages for separation, thus improving resolution, has directed much attention to capillary electrophoresis.
EQUIPMENT AND PROCEDURES
The equipment for electrophoresis includes a power supply, the apparatus on which electrophoresis is actually performed, and the reagents through which electromigration occurs.
Power Supply
This is sometimes combined with the apparatus. The power supply provides a dc voltage that produces the electrophoretic movement. Maximum power outputs should be matched with requirements.
Some power supplies may provide for applying a constant voltage, constant power or constant current. The conductivity of a setup changes with time during electrophoresis because of ion movement, so constant voltage is used for ordinary electrophoresis, constant current for isotachophoresis or disc electrophoresis (to make the zone migration velocity constant) and constant wattage for isoelectric focusing (10). Many power supplies also feature timers to prevent running samples too long. Most have an automatic shutdown of power if the apparatus is accidentally opened. Because even low voltages can be dangerous, safety issues must be addressed.
Apparatus
Many types are available, from simple partitioned plastic boxes (e.g., from Beckman-Coulter) to large and elaborate ones (e.g., from Helena). All basically hold the material through which electromigration occurs, horizontally or vertically, either as a plug or cylindrical rod or, most commonly for routine clinical work, as a sheet. Sizes and shapes of electrophoresis chambers are usually determined by the cooling efficiency of the apparatus. Some have special chambers for circulating cold water and some instruments have incorporated cooling units. These may be able to electrophorese a few samples at a time or many.
Horizontal electrophoresis is preferred when the supporting medium cannot stand the mechanical stress of standing upright. Evaporation from the top surface is often a problem; DNA fragments are separated in ‘‘submarine’’ systems, where the support (an agarose gel) is covered in buffer. The supports used when electrophoresis is done vertically are sometimes encased in glass sheets.
The apparatus also provides for the connection between the electrophoresis chamber and the electrodes. Typically, the connection is made through two relatively large volumes of solution, or ‘‘reservoirs’’. These reservoirs minimize the effects of electrolysis. To reduce contamination from extraneous metal ions, the electrodes are normally made of platinum.
Accessories include drying ovens and containers for staining and washing supports, though these may be integrated with the rest of the apparatus.
Reagents
The reagents constitute the supporting medium and provide the ions for electrical conduction throughout much of the apparatus. The ionic substances should be of good purity, but the major requirement is that the ions should not interact strongly with the substances to be separated (like borate with glycoproteins) unless a specific interaction (e.g., SDS) is desired. This means low heavy metal content and avoidance of large polyanions. Generally, buffers and salts with low ionic charges (no greater than phosphate at pH 7 or so) are preferred.
The reagents for supporting media prepared in the laboratory are usually ‘‘electrophoresis grade’’ for the reasons just given; that is, ionic contaminants such as acrylic acid in acrylamide are preferred to be at low levels. Some workers claim that cheaper grades of many reagents are satisfactory. In our experience, the quality of SDS seems to be important, however.
For research work, gel supports are prepared by heating slurries of agar or agarose in buffer or polymerizing acrylamide and derivatives in buffer and pouring them into a support to set. A ‘‘comb’’ with wide teeth is placed in the cooling or polymerizing liquid to form a series of identical rectangular holes or depressions called ‘‘wells’’ in the support. The samples are mixed with sucrose or glycerol (to make them dense enough to fall into the wells) and also with a low molecular weight dye called ‘‘tracking dye’’ (to visibly mark the progress of electrophoresis), then pipetted into the wells before electrophoresis. For routine clinical use, samples of a few microliters of samples not mixed with sucrose or tracking dye are applied to the surface of the support through a template or mask and allowed to soak into the support a few minutes before electrophoresis.
Commercially prepared supports are convenient and tend to be more uniform, so are employed for routine clinical analysis. These include agarose, cellulose acetate and polyacrylamide. They have plastic sheets as backing for strength. Washing or preelectrophoresing these before use is usually unnecessary.
Measurements
This means determining velocity(ies) or location(s) of the substance(s) electrophoresed. In the cases of isotachophoresis or capillary electrophoresis, measurements of absorbence, fluorescence, heat generation, conductivity, and so on are made while the separation is occurring. If the substances are allowed to elute and are collected in separate fractions, analysis may be done at leisure using any appropriate technique.
Usually, the (hopefully) separated substances remain on the supporting medium; however, diffusion continues after electrophoresis and measurements must be made quickly or diffusion slowed or stopped after electrophoresis ends. Fluorescent labeled single-stranded polynucleotides are measured on DNA sequencing gels (polyacrylamide) using a scanning fluorometer. Double-stranded (native)
DNA is detected using dyes that become fluorescent when the dye molecules move between (intercalate) stacked nucleotide bases, which provides great sensitivity and selectivity. Photographs are made of the patterns. Direct measurement of proteins on the support is difficult to do as the support itself often absorbs in the ultraviolet (UV) or scatters. Transparency of cellulose acetate supports can be increased (clearing) by soaking the support in methanolacetic acid before measuring absorbence. A scanning spectrophotometer must be used. Otherwise, the support is dried or the separated substances, usually proteins, precipitated in the support.
With autoradiography, radioactivity is measured, most often using photographic film (13) after the support is dried. Autoradiography is potentially the most sensitive method of measurement of distributions, since isotopes of very high specific activity can be used.
Precipitation of proteins in the support matrix is usually done by soaking the matrix in 7–10% acetic acid, though trichloroacetic acid is sometimes used. Any SDS must be removed or precipitation does not occur. Adding methanol (30–40%) to the acetic acid and soaking is usually done to remove SDS. The next step is staining using a dye: This is to enhance visibility, for purposes of inspection, photography, or, if a quantitative record is needed (generally the case in routine clinical work), measurement of the absorbence using a scanning spectrophotometer (densitometry). Some commercial clinical electrophoresis apparatuses (e.g., Helena) have automated staining; otherwise, it is done manually.
The support is soaked in a solution of a dye that strongly and specifically adsorbs to the denatured protein. Excess dye is removed by electrophoresis or by diffusion: subsequent soaking in the same solution but without the dye. This leaves a support with colored bands, dots, or stripes where protein can be found.
The important parameters for detection are specificity and sensitivity. One may be interested in staining specifically for phosphoproteins or lipoproteins, for example. Otherwise, the benchmark parameter is sensitivity. Tables showing frequently used stains are given in Refs. 2 and 13. The sensitivity of soluble protein stains increases with the molar extinction coefficient of the dye (20). Substances with very high effective extinction coefficients are more sensitive, such as metal stains (e.g., silver stain) or colloidal stains such as India ink or colloidal gold. Using silver staining, as little protein as 0.1 ng/band can be detected (13).
Sometimes some specific property must be measured, to identify a particular band or spot. With enzymes, the activity is the most specific property available, and two means of identification can be used.
If a substrate or product of the enzyme has a distinctive color, the support is soaked in an assay medium containing the reactant until a color change due to product (or substrate) appears. Naturally, the support and electrophoresis conditions must be such that the activity was not lost beforehand. If substrate or product is of low molecular weight, some way of restricting its diffusion must be used. Enzyme activity-specific stains are called ‘‘zymograms’’ (21).
ELECTROPHORESIS 139
Alternatively, the support can be cut into successive sections, incubated in assay medium, and absorbence or other changes resulting from enzyme activity measured. Generally, a duplicate support or half of a single support is stained for protein for comparison.
Recovery of material from supports is sometimes desired, for example, for mass spectrometry. The ease of recovery of large molecules such as proteins by diffusion is proportional to the pore size of the supporting medium. Recovery (especially from acrylamide gels) is sometimes done using electrophoresis.
The times required for electrophoresis, including staining and densitometry, are of the order of hours. This has limited clinical applications of electrophoretic techniques, though capillary electrophoresis techniques may change this.
EVALUATION
The result is a pattern or distribution profile given as a function of distance migrated. Often this is expressed as Rf values, relative to the distance migrated by a known ion, usually tracking dye. Electrophoresis of proteins without denaturants (native gel electrophoresis) on several gels of different percentages (pore sizes) is followed by plotting logarithms of their Rf values versus gel concentration, a ‘‘Ferguson plot’’ (12,13). This plot enables separation of the contributions of size and charge: isozymes, for example, have the same size (slopes of the lines) but different charges (ordinate intercepts). In the presence of SDS, protein complexes are dissociated (3,10,12,13). A protein of unknown subunit molecular weight is electrophoresed alongside of a mixture of proteins of known subunit molecular weight in the presence of SDS. The logarithms of the known molecular weights are plotted versus their Rf values, yielding an approximate straight line, and the unknown molecular weight obtained from its Rf value.
However, the pattern is often presented without further analysis. Electrophoresis experiments are often used to assess the purity or ‘‘homogeneity’’ of a preparation of a macromolecule. Electrophoresis is still the single most widely used criterion of purity. It is best if purity is tested under widely different electrophoresis conditions: different pH values, or the presence of absence of denaturants, such as urea or SDS, in the case of proteins.
Isoelectric points can be obtained most readily by isoelectric focusing, which can also be used as a criterion of purity.
A major use of electrophoresis currently is for DNA sequencing, owing to ongoing determinations of entire genomes of organisms. Capillary electrophoresis using linear (uncross-linked) polyacrylamide has replaced use of polyacrylamide sheets as the method of choice for this purpose, since throughput is increased several-fold because of the higher voltages that can be applied. Applied Biosystems has an instrument with 96 capillaries and Amersham Biosciences has models with up to 384 capillaries. Analysis of the profiles is done by the instruments: each fluorescent peak observed is assigned to adenine, cytosine, guanine, or thymine on the basis of the emission
140 ELECTROPHORESIS
CATGTGAGCAAAAGGCCAGCAAAAGGCCAGGAACCGTAAAAGGCCGCGTTC
450 |
460 |
470 |
480 |
490 |
CGACAGGACTATAAAGATACCAGGCGTTTCCCCCTGGAAGCTCCCTCGTGC
580 |
590 |
600 |
610 |
620 |
ATAGCTCACGCTGTAGGTATCTCAGTTCGGTGTAGGTCGTTCGCTCCAAGC
700 |
710 |
720 |
730 |
740 |
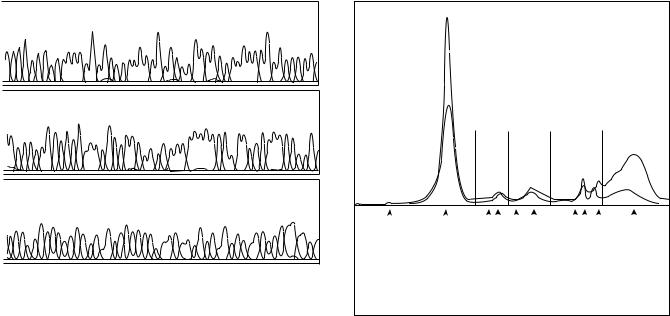
Figure 2. Section of data printout from the Applied Biosystems Prism capillary electrophoresis apparatus. The profile shows signals (fluorescence) given by polynucleotides with a fluorescent nucleotide analogue at the end, obtained as these migrate past the detector. Each peak is produced by a polynucleotide that is one residue (nucleotide) longer than that producing the signal to its left and one residue shorter than the polynucleotide producing the peak to its right. The separation by molecular length is produced by electrophoresis through linear (uncrosslinked) polyacrylamide. Different nucleotide analogues give different emission maxima, so the output identifies these as A, C, G, or T. Note the increasing peak widths due to diffusion. The numbers are the lengths in residues of the polynucleotides. (Courtesy of Dr. John Wunderlich of the Molecular Genetics Instrumentation Facility of the University of Georgia.)
spectra observed as polynucleotides terminated by dideoxynucleotide derivatives (22) with different emission spectra electrophorese past the detector. Data from each capillary are printed separately (Fig. 2).
Routine clinical electrophoresis separations are mostly serum proteins, hemoglobins, or isozymes: creatine kinase, lactic dehydrogenase, and alkaline phosphatase. Then quantitation of the separated proteins is done.
Usually, the proteins are separated on agarose or cellulose acetate sheets, stained, and the resulting pattern scanned using a densitometer. The Beckman-Coulter CZE 2000 instrument with seven capillaries is approved by the FDA for serum protein analysis, and directly measures absorbencies as different proteins move past the detector. In either situation, the electrophoretic patterns from samples (blood serum, urine, or cerebrospinal fluid) obtained from patients are compared with those from samples taken from healthy people (Fig. 3). Higher immunoglobin levels are seen with a number of conditions such as liver disease and chronic infections for example. The profiles may be analyzed visually, but some densitometers have analytical capabilities. Sometimes fluorescence [usually of reduced nicotinamide adenine denucleotide (NADH) in creatine kinase or lactic dehydrogenase isozyme assays] is scanned instead.
Absorbence |
Albumin |
Alpha 1 |
Alpha 2 |
Beta |
Gamma |
|
|
|
|
|
|
|
|
|
|
|
|
Prealbumin Albumin |
|
|
|
|
|
|
|
|
|
||
|
|
|
|
|
|
|
Gamma |
||||
Alpha-1 acid glycoprotein |
|
|
|
|
|
|
|
globulins |
|||
|
|||||||||||
|
Alpha-1 antitrypsin |
|
|
|
|
C3 complement |
|||||
|
|
Haptoglobulin |
|
|
Transferrin |
||||||
|
Alpha-2 macroglobulin |
Hemopexin |
|||||||||
|
|
|
|
|
|
|
|||||
Figure 3. Recordings of absorbence at 214 nm versus time of serum protein electrophoresis on the Beckman-Coulter Paragon CZE 2000. The solid line is the electrophoretogram of a serum protein sample from a person with chronic hepatitis C, relative to a sample from a healthy person (broken line). Characteristic increase in the polyclonal gamma and decreases in albumin and transferrin zones occur. (Courtesy of Beckman-Coulter Inc.)
Reliability
Resolution of proteins whose isoelectric points differ by as little as 0.001 pH unit is claimed for isoelectric focusing using Immobiline gels (13).
The resolving power of electrophoresis on polyacrylamide is sufficiently high that hundreds of polynucleotides, each differing in length from one another by one nucleotide, are separated in DNA sequencing (Fig. 2). Estimates of molecular weights of proteins in SDS–gel electrophoresis is also very widely done. Small differences, of the order of 1000 Da, in molecular weights can be detected (13); absolute molecular weight estimates are less reliable, since the SDS binding depends on the composition of the protein (13). In the author’s experience, most protein molecular weights estimated by this technique are not reliable beyond average limits of 10%. It is best to remember that ‘‘molecular sieving’’ techniques in general measure effective sizes, and estimates of molecular weight involves comparisons with proteins of known mass whose shapes and hydrations are assumed to be similar.
While electrophoresis results are generally fairly reproducible from experiment to experiment, it is best to use internal standards whenever appropriate. This is for location and identification of separated substances and for quantitation.
Electrophoresis is widely used, especially in the biological sciences for investigations of macromolecules. It is an excellent analytical method characterized by high resolution and sensitivity and moderately good reproducibility, a method capable of yielding considerable information about