

84.Watanabe K, et al. Behavioral state cycles, background EEGs and prognosis of newborns with perinatal hypoxia. Electroenceph Clin Neurophysiol 1980;49:618– 625.
85.Holmes G, et al. Prognostic value of the electroencephalogram in neonatal asphyxia. Electroenceph Clin Neurophysiol 1982;53:60–72.
86.Lieb JP, et al. Neurophatological findings following temporal lobectomy related to surface and deep EEG patterns. Epilepsia 1981;22:539–549.
87.Ojemann GA, Engel JJ. Acute and chronic intracranial recording and stimulation. In: Engel JJ, editor. Surgical Treatment of the Epilepsy. New York: Raven Press; 1987. 263–288.
88.Vaz CA, Thakor NV. Monitoring brain electrical magnetic activity. IEEE Eng Med Biol Mag 1986;Sept.:9–15.
89.Proakis JG, Manolakis DG. Introduction to Digital Signal Processing. New York: Macmillan; 1988.
90.Dumermuth G, Molinari L. Spectral analysis of EEG background activity. In: Remond A, editor. Methods of Analysis of Brain Electrical and Magnetic Signals. Amsterdam: Elsevier; 1987.
91.Schwilden H, Stoeckel H. The derivation of EEG parameters for modelling and control of anesthetic drug effect. In: Stoeckel H, editor. Quantitation, Modelling and Control in Anaesthesia. Stuttgart: Thieme; 1985.
92.Schwilden H, Stoeckel H. Untersuchungen ueber verschiedene EEG parameter als Indikatoren des Narkosezustandes. Anaesth Intesivther Notfallmed 1980;15:279.
93.Levy WJ. Intraoperative EEG Patterns: implications for EEG monitoring. Anesthesiology 1984;60:430.
94.Isaakson A, Wennberg A, Zetterberg LH. Computer analysis of EEG signals with parametric models. Proc IEEE 1981;69: 451–461.
95.Akaike H. Recent Development of Statistical Methods for Spectrum Estimation. In: Yamaguchi NF, editor. Recent Advances in EEG and EMG Data Processing. Amsterdam: North-Holland Biomedical Press; 1981.
96.Johnsen SJ, Andersen N. On power estimation in maximum entropy spectral analysis. Geophysics 1978;43:681–690.
97.Hilfiker P, Egli M. Detection and evolution of rhythmic components in ictal EEG using short segment spectra and discriminant analysis. Electroenceph Clin Neurophysiol 1992;82:255–265.
98.Babb TL, Mariani E, Crandall PH. An electronic circuit for detection of EEG seizures recorded with implanted electrodes. Electroenceph Clin Neurophysiol 1974;37:305–308.
99.Ives JR, et al. The on-line computer detection and recording of spontaneous temporal lobe epileptic seizures from patients with implanted depth electrodes via a radio telemetry link. Electroenceph Clin Neurophysiol 1974;73:205.
100.Gotman J. Automatic seizure detection. Electroenceph Clin Neurophysiol 1990;76:317–324.
101.Murro AM, et al. Computerized seizure detection of complex partial seizures. Electroenceph Clin Neurophysiol 1991;79: 330–333.
102.Mehtu S, Onaral B, Koser R. Detection of seizure onset using wavelet analysis. In: Proc 16th Annual Int. Conf. IEEE-EMBS. Maryland, 1994.
103.Webber WRS, et al. Practical detection of epileptiform discharges (EDs) in the EEG using an artificial neural network: A comparison of raw and parameterized EEG data. Electroenceph Clin Neurophysiol 1994;91:194–204.
104.Oezdamer O, et al. Multilevel neural network system for EEG spike detection. In: Tsitlik JE, editor. Computer-Based Medical Systems. Washington: IEEE Computer Society Press; 1991. p 272–279.
ELECTROGASTROGRAM 83
105.Yaylali I, Jayakar P, Oezdamer O. Detection of epileptic spikes using artificial multilevel neural networks. Electroenceph clin Neurophysiol 1992;82.
106.Bullmore ET, et al. Fractal analysis of electroencephalographic signals intracerebrally recorded during 35 epileptic seizures: Evaluation of a new method for synoptic visualisation of ictal events. Electroenceph Clin Neurophysiol 1994;91:337–345.
107.Lehnerts K, Elger CE. Spatio-temporal dynamics of the primary epileptogenic area in temporal lobe epilepsy characterized by neuronal complexity loss. Electroenceph Clin Neurophysiol 1995;95:108–117.
108.Alarkon G, et al. Power spectrum and intracranial EEG patterns at seizure onset in partial epilepsy. Electroenceph Clin Neurophysiol 1995;94:326–337.
109.Franaszczuk PJ, Bergey GK, Kaminski MJ. Analysis of mesial temporal seizure onset and propagation using the directed transfer function method. Electroenceph Clin Neurophysiol 1994;91:413–427.
110.Darcey TM, Williamson PD. Spatio-Temporal EEG Measures and their Application to Human Intracranially Recporded Epileptic Seizures. Electroenceph Clin Neurophysiol 1985; 61:573–587.
111.Agarwal R, et al. Automatic EEG Analysis during long-term monitoring in the ICU. Electroencephal Clin Neurol 1998;107:44–58.
112.Bovik AC, Maragos P, Quatieri TF. AM-FM Energy Detection and Separation in Noise Using Multiband Energy Operators. IEEE Trans Signal Processing 1993;41(12): 3245–3265..
113.Sherman DL, et al. Diagnostic Instrumentation for Neural Injury. IEEE Instrum Measure 2002;28–35.
See also EVOKED POTENTIALS; MONITORING IN ANESTHESIA; REHABILITATION, COMPUTERS IN COGNITIVE; SLEEP STUDIES, COMPUTER ANALYSIS OF.
ELECTROGASTROGRAM
DZ CHEN
University of Kansas Medical
Center
Kansas City, Kansas
ZHIYUE LIN
University of Texas Medical
Branch
Galveston, Texas
INTRODUCTION
Electrogastrography, a term similar to electrocardiography (ECG), is usually referred to as the noninvasive technique of recording electrical activity of the stomach using surface electrodes positioned on the abdominal skin (1–3). The cutaneous recording obtained using the electrogastrographic technique is called electrogastrogram (EGG). In this article, both electrogastrography and electrogastrogram are abbreviated to EGG. Due to the noninvasive nature and recent advances in techniques of EGG recording and computerized analysis, EGG has become an attractive tool to study the electrophysiology of the stomach and pathophysiology of gastric motility disorders and is currently utilized in both research and clinical settings (4–7).
84 ELECTROGASTROGRAM
Although there are now several commercially available hardware–software packages making recording and analysis of EGG relatively easy to perform, many centers still use home-built equipment because the interpretations of specific frequency and EGG amplitude parameters are still debated and the clinical utility of EGG is still under investigation (6–10). Therefore, there are definite needs for better definition of the normal frequency range of EGG and dysrhythmias as well as standardization of EGG recording and advanced analysis methods for extraction and interpretation of quantitative EGG parameters. More outcome studies of EGG are also needed to determine the usefulness of EGG in the clinical settings. This article covers the following topics: a brief historic review of EGG, basics of gastric myoelectrical activity, measurement and analysis of EGG including multichannel EGG, interpretation of EGG parameters, clinical applications of EGG and future development of EGG.
HISTORIC REVIEW OF EGG
Electrogastrography was first performed and reported by Walter Alvarez back in the early 1920s (1,11). On October 14, 1921, Walter Alvarez, a gastroenterologist recorded the first human EGG by placing two electrodes on the abdominal surface of ‘‘a little old woman’’ and connected them to a sensitive string galvanometer. A sinusoid-like EGG with a frequency of 3 cycles/min (cpm) was then recorded. As Alvarez described in his paper, ‘‘the abdominal wall was so thin that her gastric peristalsis was easily visible’’ (1). Alvarez did not publish any other paper on EGG probably because of a lack of appropriate recording equipment.
The second investigator to discover the EGG is I. Harrison Tumpeer, a pediatrician who probably performed the first EGG in children (12). In a note in 1926 (12) and in a subsequent publication (13), Tumpeer reported the use of limb leads to record the EGG from a 5 week old child who was suffering from pyloric stenosis and observed the EGG as looking like an ECG (electrocardiogram) with a slowly changing baseline (11).
However, it took 30 years for EGG to be recovered by R.C. Davis, a psychophysiologist in the mid-1950s (14). Davis published two papers on the validation of the EGG using simultaneous recordings from needle electrodes and a swallowed balloon (14,15). Although Davis made only slow progress in EGG research, his two papers had stimulated several other investigators to begin doing EGG research, such as Dr. Stern who started working in Davis’ lab in 1960 (11).
Stevens and Worrall (1974) were probably the first ones who applied the spectral analysis technique to EGG (16). They obtained simultaneous recordings from a strain gauge on the wall of the stomach and EGG in cats to validate the EGG. They not only compared frequencies recorded from the two sites visually in the old fashion way, but also used a fast paper speed in their polygraph and digitized their records by hand once per second, and then analyzed EGG data using Fourier transform (11).
Beginning in 1975, investigators in England published a number of studies on frequency analysis of the EGG signal and made numerous advances in techniques for analysis of the EGG, including fast Fourier transform (FFT) (17),
phase-lock filtering (18), and autoregressive modeling (19). In some of their studies, they compared the EGG with intragastric pressure recordings and reported their findings similar to those of Nelson and Kohatsu (20). They found that there was no 1:1 correlation between the EGG and the contractions. The EGG could be used to determine the frequency of the contractions, but could not be used to determine when contractions were occurring (21).
During this same time, Smout and co-workers at Erasmus University in Rotterdam, The Netherlands, conducted several validation studies of the EGG and made major contributions in the area of signal analysis. In their landmark 1980 paper (22), they were the first ones who showed that the amplitude of the EGG increases when contractions occur. In 1985, Dr. Koch and Dr. Stern reported their study on simultaneous recordings of the EGG and fluoroscopy (23). They repeatedly observed the correspondence between EGG waves and antral contractions during simultaneous EGG-fluoroscopy recordings.
To extract information about both the frequency of EGG and time variations of the frequency, a running spectral analysis method using FFT was introduced by van der Schee and Grashus in 1987 (24), later used by some others (2,25,26) and now still used in most laboratories (5). To avoid the averaging effect introduced by the block processing of the FT, Chen et al. (27,28) developed a modern spectral analysis technique based on an adaptive autoregressive moving average model. This method yields higher frequency resolution and more precise information about the frequency variations of the gastric electrical activity. It is especially useful in detecting dysrhythmic events of the gastric electrical activity with short durations (29).
In 1962, Sobakin et al. (30) performed the EGG in 164 patients and 61 healthy controls and reported that ulcers caused no change in the EGG, but that pyloric stenosis produced a doubling of amplitude, and stomach cancer caused a breakup of the normal 3 cpm rhythm. This was probably the first large-scale clinical use of the EGG. In the past two decades, numerous studies have been reported on the clinical use of the EGG including understanding the relationship between the EGG and gastric motility (22,23,31–37), gastric myoelectrical activity in pregnant women (38–40), gastric myoelectrical activity in diabetics or gastroparetic patients (41–44), gastric myoelectrical activity in patients with dyspepsia (45–50), and prediction of delayed gastric emptying using the EGG (42,46,47,49,51).
As Dr. Stern wrote in 2000, ‘‘the history of EGG can be described as three beginnings, a length period of incubation, and a recent explosion’’ (11). It is beyond the scope of this article to cover every aspect of EGG studies. For more information about the EGG, readers are referred to some excellent articles, reviews, dissertations, and chapters (2,5,6,21,27,52–56).
ELECTROPHYSIOLOGY OF THE STOMACH
Normal Gastric Myoelectrical Activity
Along the gastrointestinal tract, there is myoelectrical activity. In vitro studies using smooth muscle strips of
|
|
|
E1 |
|
|
|
|
|
|
1 |
|
|
|
|
|
|
2 |
|
|
|
|
4 |
3 |
E2 |
|
|
|
|
|
|
|
|
||
|
|
|
E3 |
|
|
|
|
|
|
E4 |
|
|
|
|
|
|
0 |
0.5 |
1.0 |
Time (min) |
|
|
|
|
|||
|
|
|
|
(a) |
|
|
|
3 |
CH4 |
|
Slow waves |
|
Spikes |
|
|
|
|
|||
Amplitude |
|
|
|
|
|
|
1 |
|
|
|
|
|
|
|
|
|
|
|
|
|
|
–1 |
|
|
|
|
|
|
–3 |
|
|
|
|
|
|
0 |
|
1 |
2 |
3 |
4 |
|
|
|
|
Time (min) |
|
|
(b)
Figure 1. (a) Anatomy of the stomach (1–fundus, 2–body (corpus), 3–antrum, 4–pylorus) and the origin and propagation of the electrogastric signal from proximal (E1) to distal (E4) electrodes measured from the serosa of the human stomach. The dotted lines show the detection of a gastric slow wave traveling distally along the stomach wall. (b) Serosal recording obtained from the distal stomach in a patient. The trace shows slow waves of 3 cpm with and without superimposed spike potentials.
the stomach have revealed independent gastric myoelectrical activity (GMA) from different regions of the stomach. The highest frequency of the gastric myoelectrical activity was recorded in the corpus and the lowest frequency in distal antrum. However, in vivo studies demonstrated a uniform frequency in the entire stomach under healthy conditions, because the myoelectrical activity in the corpus with the highest frequency drives or paces the rest of stomach into the same higher frequency (see Fig. 1).
Gastric myoelectrical activity is composed of slow waves and spike potentials. The slow wave is also called the pacesetter potential, or electrical control activity (57–59). The spike potentials are also called action potentials or electrical response activity (57–59). While slow waves are believed originated from the smooth muscles, recent in vitro electrophysiological studies suggest that interstitial cells of Cajal (ICC) are responsible for the generation and propagation of the slow wave (60). The frequency of normal slow waves is species-dependent, being 3 cpm in humans and 5 cpm in dogs, with little day-to-day variations. The slow wave is known to determine the maximum frequency and propagation of gastric contractions. Figure 1 presents an example of normal gastric slow waves measured from a patient. Normal 3 cpm distally propagated slow waves are clearly noted.
Spike potentials are known to be directly associated with gastric contractions, that is, gastric contractions occur when the slow wave is superimposed with spike potentials.
ELECTROGASTROGRAM 85
Note, however, that in vivo gastric studies have failed to reveal a 1:1 correlation between spike potentials measured from the electrodes and gastric contractions measured from strain gauges although such a relationship does exist in the small intestine. In the stomach, it is not uncommon to record gastric contractions with an absence of spike potentials in the electrical recording. Some other forms of superimposed activity are also seen in the electrical recording in the presence of gastric contractions.
Abnormal GMA: Gastric Dysrhythmia and Uncoupling
Gastric myoelectrical activity may become abnormal in diseased states or upon provocative stimulations or even spontaneously. Abnormal gastric myoelectrical activity includes gastric dysrhythmia and electromechanical uncoupling. Gastric dysrhythmia includes bradygastria, tachygastria, and arrhythmia. Numerous studies have shown that gastric dysrhythmia is associated with gastric motor disorders and/or gastrointestinal symptoms (4–7,20,61,62).
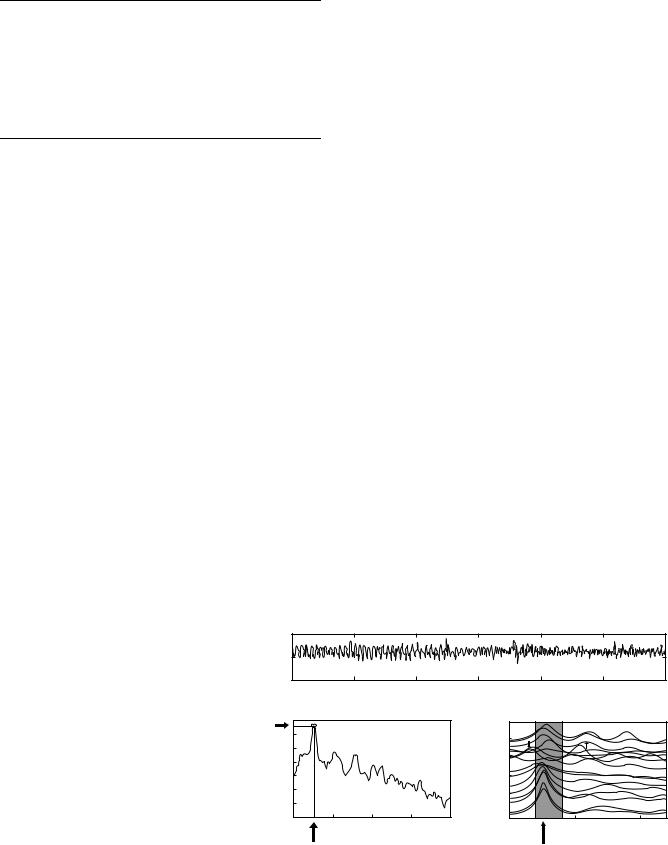
A recent study has revealed that tachygastria is ectopic and of an antral origin (63). In > 80% of cases, tachygastria is located in the antrum and propagates retrogradely toward the pacemaker area of the proximal stomach. It may partially or completely override the normal distally propagating slow waves. However, most commonly it does not completely override the normal gastric slow waves. In this case, there are two different slow wave activities: normal slow waves in the proximal stomach and tachygastrial slow waves in the distal stomach. A typical example is presented in Fig. 2.
Unlike tachygastria, bradygastria is not ectopic and reflects purely a reduction in frequency of the normal pacemaking activity. That is, the entire stomach has one single frequency when bradygastria occur (63). Bradygastria is originated in the corpus and propagates distally toward the pylorus. The statistical results showing the origins of tachygastria and bradygastria are presented Fig. 3. The data was obtained in dogs and gastric dysrhythmias were recorded postsurgically or induced with various drugs including vasopressin, atropine and glucagon (63).
MEASUREMENT OF THE EGG
Gastric myoelectrical activity can be measured serosally, intraluminally, or coutaneously. The serosal recording can be obtained by placing electrodes on the serosal surface of the stomach surgically. The intraluminal recording can be acquired by intubating a catheter with recording electrodes into the stomach. Suction is usually applied to assure a good contact between the electrodes and the stomach mucosal wall. The serosal and intraluminal electrodes can record both slow waves and spikes, since these recordings represent myoelectrical activity of a small number of smooth muscle cells. These methods are invasive and their applications are limited in animals and laboratory settings.
The EGG, a cutaneous measurement of GMA using surface electrodes, is widely used in humans and clinical settings since it is noninvasive and does not disturb ongoing activity of the stomach. A number of validation studies have documented the accuracy of the EGG by

86 ELECTROGASTROGRAM
Ch8 Ch7 Ch6 Ch5 Ch4 Ch3 Ch2 Ch1
220.00 |
240.00 |
260.00 |
280.00 |
300.00 |
seconds
0.40000 |
mV |
|
0.00000 |
||
|
||
–0.40000 |
|
|
0.40000 |
mV |
|
0.00000 |
||
|
||
–0.40000 |
|
|
0.20000 |
mV |
|
0.00000 |
||
0.20000 |
||
–0.40000 |
|
|
1.00000 |
mV |
|
0.50000 |
||
0.00000 |
||
–0.50000 |
|
|
–1.00000 |
|
|
0.40000 |
|
|
0.20000 |
mV |
|
0.00000 |
||
0.20000 |
|
|
–0.40000 |
|
|
0.40000 |
mV |
|
0.00000 |
||
|
||
–0.40000 |
mV |
|
0.00000 |
||
–0.20000 |
|
|
1.00000 |
mV |
|
0.00000 |
||
|
||
–1.00000 |
|
Figure 2. Origin and backward propagation of tachygastria and arrhythmia measured from the sorosa of the canine stomach. An ectopic pacemaker was located at the antrum (channel 8), which propagated both forward and backward. It changed the normal rhythm of original pacemaker that propagated down from the proximal part of the stomach (channel 1) to the distal part of the stomach (channel 8) and almost affected the entire rhythm of the stomach for a minute. A transient bradygastria was observed in all channels before normal rhythm changed back.
comparing it with the recording obtained from mucosal and serosal electrodes (19,22,31,61,64–66). Reproducibility of the EGG recording has been demonstrated, with no significant day-to-day variations (67). In adults, age and gender do not seem to have any influences on the EGG (68–71).
EGG Recording Equipment
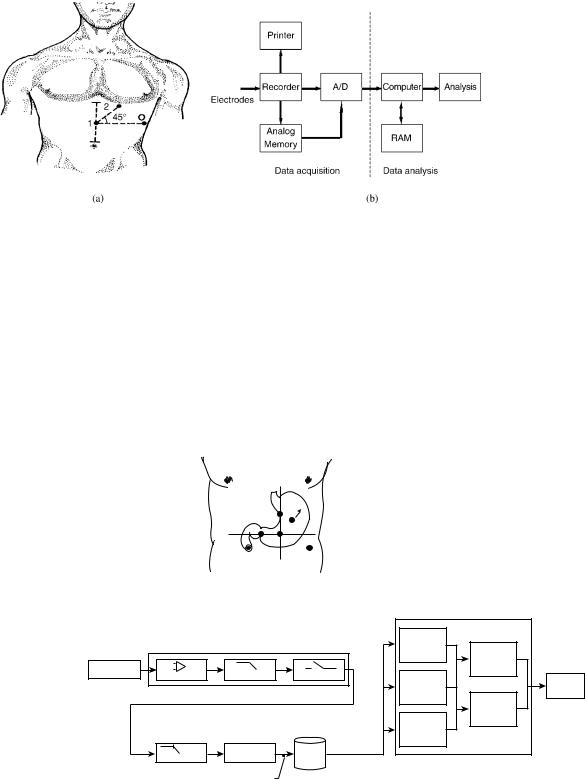
The equipment required to record the EGG includes amplifiers, an analog-to-digital (A/D) converter and a personal computer (PC) (Figs. 4 and 5). The EGG signal must be amplified because it is of relatively low amplitude (50–500 mV). An ideal EGG amplifier should be able to
|
|
|
CH 1 |
(proximal) |
|
|
|
||
* |
* |
|
CH 4 |
(distal) |
|
||||
|
||||
|
|
|
||
|
|
|
|
Origin of Dysrhythmias (%)
100
90
80
70
60
50
40
30
20
10
0
Bradygastria
Tachygastria |
Figure 3. Statistical results showed that bradygastria originated primarily from the proximal body of the stomach, while tachygastria originated primarily from the distal stomach.
enhance the gastric signal and effectively reduce interferences and noise. Abnormal frequencies of gastric slow waves may be as low as 0.5 and as high as 9 cpm. To effectively record the gastric slow wave, an appropriate recording frequency range is 0.5–18 cpm (5,6,72). It is recommended that a good choice of the sampling frequency should be three to four times of the highest signal frequency of interest (73,74). Therefore, a sampling rate for digitization of the EGG signal 1 Hz (60 cpm) is a proper choice.
A typical EGG recording system is shown in Fig. 4. It is composed of two parts: data acquisition and data analysis. Venders who currently offer or have offered EGG equipment in the past included 3CPM Company, Medtronic/ Synectics, Sandhill Scientific, Inc., RedTech, and MMS (The Netherlands), and so on (2,6). To date, there are two U.S. Food and Drug Administration (FDA)-approval EGG systems: one from Medtronic Inc (Minneapolis, MN) and the other from 3CPM Company (Crystal Bay, NV). The 3CPM Company’s EGG device is a work station that consists of an amplifier with custom filters, strip chart recorder, and computer with proprietary software—the EGG Software Analysis System (EGGSAS). However, this device is only to record and analyze single-channel EGG.
The newly FDA-approved Medtronic’s ElectroGastroGraphy system provides multichannel EGG recordings and analysis (75–78). It can be either running on Medtronic’s Gastro Diagnostic Workstation or consisting of the Medtronic’s Polygraf ID with a laptop to make a portable system (see Fig. 5). This system provides an Automatic Impedance Check function and optional Motion Sensor. With the Automatic Impedance Check, all EGG electrodes
ELECTROGASTROGRAM 87
are verified to be in good electrical contact with the skin within 10 s. The optional Motion Sensor can record respiration and patient movements during data capture. This assists physicians to more easily identify motion artifacts, which can then be excluded from subsequent analysis. Currently, this system has been configured to make four-channel EGG recordings with placement of six surface electrodes on the subject’s abdomen (75–78) (see Fig. 5a).
An ambulatory recording device is also available and has been used frequently in various research centers (42,46,48,71,76). For example, the ambulatory EGG recorder (Digitrapper EGG) developed by Synectics Medical Inc. (Shoreview, MN) is of the size and shape of a ‘‘walkman’’ (79). It contains one channel amplifier, an A/D conversion
Figure 4. (a) Position of abdominal electrodes for the measurement of one-channel EGG. (b) Block diagram of an EGG recording system.
unit, and memories. It can be used to record up to 24-h onechannel EGG with a sampling frequency of 1 Hz. Information colleted during recording can be downloaded into a desktop computer for data storage and analysis (42,79).
Procedures for Recording EGG
Due to the nature of cutaneous measurement, the EGG is vulnerable to motion artifacts. Accordingly, a careful and proper preparation before the recording is crucial in obtaining reliable data.
Skin Preparation. Since the EGG signals are very weak, it is very important to minimize the impedance between
 Ch#1
Ch#1
R
Ch#4  Ch#2
Ch#2
Ch#3
G
D
(a)
Polygraf ID
Electrodes |
Amplifier |
Filter |
Sampling |
|
105 Samples/ Second
15 CPM |
1:105 |
Database |
|
Filter |
Decimation |
||
|
1 Sample/ Second
Raw |
|
|
Review |
RSA |
Printer |
|
Report |
OSA |
|
(b)
Figure 5. (a) Electrogastrogram electrodes placement for making four-channel EGG recordings consists of placing four active electrodes along the antral axis of the stomach, a reference electrode over the xyphoid process, and a ground electrode on the patient’s left side. (b) Block diagram of Medtronic POLYGRAM NETTM ElectroGastroGraphy System (RSA: Running Spectral Analysis; OSA: Overall Spectral Analysis). (Reprinted with permission of Medtronic, Inc.).
88 |
ELECTROGASTROGRAM |
|
|
|
Table 1. List of Systems and Procedures for Recording EGG Used by Different Groups |
||||
|
|
|
|
|
References |
Hardware System |
Analysis Method |
Procedure (Duration and Meal) |
|
|
|
|
|
|
Dutch research |
Custom-built four- |
Running spectral |
2 h before and 3 h |
|
groups (8,83) |
channels (band-pass |
analysis by short- |
after meal (a pancake, 276 kcal) |
|
|
|
filter: 0.01–0.5 Hz, |
time Fourier |
|
|
|
sampling rate: 1 Hz) |
transform (STFT) |
|
McCallum and |
MicroDigitrapper |
Running spectral |
(1) 30 min before and 2 h after meal |
|
Chen (42,79), |
(Synectics Medical, |
analysis by STFT |
(turkey sandwich, 500 kcal) |
|
Parkman et al. (46,71) |
Inc.): single channel |
(Gastrosoft Inc., |
(2) 60 min before and 60 min after meal |
|
Chen et al. (75,76) |
(cut-off frequency: |
Synetics Medical) |
(two scrambled egg with two |
|
|
|
1–16 cpm, sampling |
or adaptive |
pieces of toasted bread 200 mL |
|
|
rate: 1 or 4 Hz). |
analysis method ) |
water, 282 kcal) |
|
|
Commercial four- |
|
|
|
|
channel EGG |
|
|
|
|
recording device (cut- |
|
|
|
|
off frequencies: 1.8–16 |
|
|
|
|
cpm) (Medtronic- |
|
|
|
|
Synectics, |
|
|
|
|
Shoreview, MN) |
|
|
Penn State groups |
An amplifier with |
Running spectral |
Water load test (45 min) |
|
(2,84) |
|
custom filters, a strip |
analysis by STFT |
|
|
|
chart recorder (cut- |
and a data sheet |
|
|
|
off frequency: 1–18 |
with percentage |
|
|
|
cpm, sampling |
distribution of |
|
|
|
frequency: 4.27 Hz) |
EGG power in |
|
|
|
|
four frequency |
|
|
|
|
ranges |
|
|
|
|
|
|
the skin and electrodes. The abdominal surface where electrodes are to be positioned should be shaved if necessary, cleaned and abraded with some sandy skin-prepara- tion jelly (e.g., Ominiprep, Weaver, Aurora, CO) in order to reduce the impedance between the bipolar electrodes to > 10 kV. The EGG may contain severe motion artifacts if the skin is not well prepared.
Position of the Electrodes. Standard electrocardio- graphic-type electrodes are commonly used for EGG recordings. Although there is no established standard, it is generally accepted that the active recording electrodes should be placed as close to the antrum as possible to yield a high signal-to-noise ratio (80). The EGG signals can be recorded with either unipolar or bipolar electrodes, but bipolar recording yields signals with a higher signal-to- noise ratio. One commonly used configuration for recording one-channel EGG is to place one of two active electrodes on the midline halfway between the xiphoid and umbilicus and the other active electrode 5 cm to the left of the first active electrode, 30 cephalad, at least 2 cm below the rib cage, in the midclavicular line. The reference electrode is placed on the left costal margin horizontal to the first active electrode (42,81) (Fig. 4a). One commonly used configuration of electrodes for making four-channel EGG recordings is shown in Fig. 4a, including four active electrodes along the antral axis of the stomach, a reference EGG electrode over the xyphoid process, and a ground EGG electrode on patient’s left side (75–78).
Positioning the Patient. The subject needs to be in a comfortable supine position or sit in a reclining chair in a quiet room throughout the study. Whenever possible, the supine position is recommended, because the subject is
more relaxed in this position, and thus introduces fewer motion artifacts. The subject should not be engaged in any conversations and should remain as still as possible to prevent motion artifacts (7,8,79).
Appropriate Length of Recording and Test Meal
The EGG recording is usually performed after a fast of 6 h or more. Medications that might modify GMA (prokinetic and antiemetic agents, narcotic analgesics, anticholinergic drugs, non-steroidal anti-inflammatory agents) should be stopped at least 48 h prior to the test (6,7). The EGG should be recorded for 30 min or more (no < 15 min in any case) in the fasting state and for 30 min or more in the fed state. A recording < 30 min may not provide reliable data and may not be reproducible attributed to different phases of migrating motor complex (82) in the fasting state.
The test meal should contain at least 250 kcal with no > 35% of fat (82). Solid meals are usually recommended although a few investigators have used water as the test ‘‘meal’’ (see Table 1).
EGG DATA ANALYSIS
In general, there are two ways to analyze EGG signals. One is time-domain analysis or waveform analysis, and the other is frequency-domain analysis. Numerous EGG data analysis methods have been proposed (18,19,24,27,53,55,56,84–97).
Time-Domain Data Analysis
Like other surface electrophysiological recordings, the EGG recording contains gastric signal and noise.
ELECTROGASTROGRAM 89
Table 2. Composition of the EGG
|
Components |
Frequency (cpm) |
|
|
|
Signal |
Normal slow wave |
2.0–4.0 |
|
Bradygastria |
0.5–2.0 |
|
Tachygastria |
4.0–9.0 |
|
Arrhythmia |
NAa |
Noise |
Respiratory |
12–24 |
|
Small bowel |
9–12 |
|
ECG |
60–80 |
|
Motion artifacts |
Whole range |
aNot available
Compared with other surface recordings, such as ECG, the quality of EGG is usually poor. The gastric signal in the EGG is disturbed or may even be completely obscured by noise (see Table 2). The frequency of gastric signals is from 0.5 to 9.0 cpm, including normal (regular frequency of 2– 4 cpm) and abnormal frequencies. The gastric signals with abnormal frequencies may be divided further into bradygastria (regular frequency of 0.5–2.0 cpm), tachygastria (regular frequency of 4–9 cpm) and arrhythmia (irregular rhythmic activities) (62).
The noise consists of respiratory artifacts, interferences from the small bowel, ECG, and motion artifacts (see Table 2). The respiratory artifact has a frequency from 12 to 24 cpm. It is a common and thorny problem. It is superimposed upon almost every EGG recording if not appropriate processed. Occasionally, the slow wave of the small intestine may be recorded in the EGG. The frequency of intestinal slow waves is 12 cpm in duodenum and 9 cpm in the ileum. The intestinal slow wave is usually weaker than the gastric slow wave. One can avoid recording intestinal slow waves by placing electrodes in the epigastric area. The frequency of ECG is between 60 and 80 cpm. It can be eliminated using conventional low pass filtering because its frequency is much higher than that of the gastric signal component. The frequency of motion artifacts is in the whole recording frequency range. To
minimize motion artifacts, the subject must not talk and should remain still during recording.
The time-domain analysis methods with the aid of computers that were introduced to facilitate the EGG data analysis include (1) adaptive filtering. It is used to reduce noise such as respiratory artifacts with minimal distortion of the gastric signal component of interest (27,90,91), (2) coherent averaging. It is applied to filter out random noise by averaging a large number of EGG waves (85), (3) use of feature analysis and artificial neural networks to automatically detect and delete motion artifacts (93,94), and (4) use of independent component analysis to separate gastric signals from multichannel EGGs (97).
When noise level is low, it is possible to visually analyze the raw EGG tracing (3,6,84,98) to identify periods of artifact and provide a qualitative determination of recording segments with normal frequencies of 3 cpm and those of abnormally high (tachygastria) or low (bradygastria) and the presence or absence of a signal power increase after eating a test meal. Artifacts usually are readily recognized visually as sudden, high amplitude off-scale deflections of the EGG signal (see Fig. 6). Artifactual periods must be excluded before analysis. This is because
(a) they are usually strong in amplitude and may completely obscure the gastric signal; (b) they have a broad-band spectrum and their frequencies overlap with that of the gastric signal; therefore they are not separable using even spectral analysis method, and jeopardize any kind of quantitative analyses of the EGG data (79).
EGG Parameters (99)
Although a noise-free EGG signal is attainable by means of advanced signal processing techniques (27,86), the waveform analysis of the EGG has rarely been used, because the waveform of the EGG is related to many factors, including the thickness of the abdominal wall of the subject, skin preparation, position of the electrodes, and characteristics of the recording equipment (100). Furthermore, the number of specific characteristics of the EGG is limited. With single-channel EGG recording, only frequency and
(a) |
|
|
EGG tracing |
|
|
|
200 |
|
|
|
|
|
|
|
|
|
|
|
|
|
100 |
|
|
|
|
|
|
00 |
5 |
10 |
15 |
20 |
25 |
30 |
|
|
|
Time (min) |
|
|
|
Figure 6. The EGG data analysis. (a) A 30 min EGG recording. (b) The power spectra of the 30 min EGG data. The EGG dominant frequency (DF) and power at DF can be determined from the spectrum,
(c) adaptive running spectra. Each curve (from bottom to top) is the spectrum of 2 min EGG data. The percentage of normal slow waves (or dysrhythmias) can be determined from the spectra by counting spectral peaks in each frequency band.
Dominant |
(b) |
Overall spectrum |
|
(c) |
Running spectra |
|
||
35 |
|
|
|
|
|
|
|
|
power |
|
|
|
|
60 |
|
|
|
|
30 |
|
|
|
|
50 |
|
|
|
25 |
|
|
|
|
|
|
|
|
|
|
|
|
|
|
|
|
|
20 |
|
|
|
|
40 |
|
|
|
15 |
|
|
|
|
30 |
|
|
|
10 |
|
|
|
|
|
|
|
|
|
|
|
|
20 |
|
|
|
|
5 |
|
|
|
|
|
|
|
|
5 |
10 |
15 |
20 |
0 |
5 |
10 |
|
|
0 |
|||||||
|
|
Frequency (cpm) |
|
|
Frequency (cpm) |
|
||
|
Dominant frequency |
|
|
|
% of 2-4 cpm wave |
|
||
90 ELECTROGASTROGRAM
amplitude can be measured. Recent computer simulations and experiments have shown that the propagation of the gastric slow wave can be identified from the multichannel EGG recordings (27,100), it is, however, difficult to get this information from waveform analysis (27). Accordingly, quantitative data analyses of the EGG are mostly based on spectral analysis methods. Some important EGG parameters obtained by the spectral analysis methods are described as in the following sections.
EGG Dominant Frequency and Dominant Power. The frequency believed to be of gastric origin and at which the power in the EGG power spectrum has a peak value in the range of 0.5–9.0 cpm is called the EGG dominant frequency. The dominant power is the power at the dominant frequency. The EGG power can be presented in a linear or decibel (dB) unit. The dominant frequency and power of the EGG are often simplified as EGG frequency and EGG power. Figure 6 shows the definition of the dominant frequency and power of the EGG. Simultaneous cutaneous and serosal (13,17–19) or mucosal (11,16) recordings of GMA have shown that the dominant frequency of the EGG accurately represents the frequency of the gastric slow wave. The dominant power of the EGG reflects the amplitude and regularity of gastric slow waves. The gastric slow wave is regarded as abnormal if the EGG dominant frequency is not within a certain frequency range (e.g., 2–4 cpm). Although there is no established definition for the normal range of the gastric slow wave, it is generally accepted that the dominant frequency of the EGG in asymptomatic normal subjects is between 2.0 and 4.0 cpm (5,6,41,72). The EGG, or a segment of the EGG, is defined as tachygastria if its frequency is > 4.0 cpm, but < 9.0 cpm, bradygastria if its frequency is < 2.0 cpm and arrhythmia if there is a lack of a dominant frequency (see Table 2).
Power Ratio or Relative Power Change. As the absolute value of the EGG dominant power is related to many factors, such as the position of the electrodes, the preparation of skin and the thickness of the abdominal wall, it may not provide much useful information. One of the commonly used EGG parameters associated with the EGG dominant power is the power ratio (PR) or the relative power change after an intervention such as meal, water, or medication. Note that the power of the EGG dominant frequency is related to both the amplitude and regularity of the EGG. The power of the EGG dominant frequency increase when EGG amplitude increases. It also increases when the EGG becomes more regular. Previous studies have shown that relative EGG power (or amplitude) change reflects the contractile strength of the gastric contractions (22,33,37).
Percentage of Normal Gastric Slow Waves. The percentage of normal slow waves is a quantitative assessment of the regularity of the gastric slow wave measured from the EGG. It is defined as the percentage of time during which normal gastric slow waves are observed in the EGG.
Percentage of Gastric Dysrhythmias Including Bradygastria, Tachygastria, and Arrhythmia. The percentage of gas-
tric dysrhythmia is defined as the percentage of time during which gastric dysrhythmia is observed in the EGG. In contrast to the percentage of normal gastric slow waves in an EGG recording, this parameter represents the abnormality of the EGG or gastric slow waves.
Instability Coefficients. The instability coefficients are introduced to specify the stability of the dominant frequency and power of the EGG (99). The instability coefficient (IC) is defined as the ratio between the standard deviation (SD) and the mean:
IC ¼ SD/mean 100%
The clinical significance of the instability coefficient has been demonstrated in a number of previous studies (37,40,99). The instability coefficients defined by Geldof et al. is slightly different from the one defined above. More information can be found in Refs. 83,101.
Percentage of EGG Power Distribution. The percentage of EGG power distribution was introduced by Koch and Stern (102) and is defined as the percentage of total power in a specific frequency range in comparison with the power in the total frequency range from 1 to 15 cpm. For example;
% of (2.4–3.6 cpm) ¼ the power within 2.4–3.6 cpm/(the total power from 1 to 15 cpm) 100%
Using this parameter, Koch et al. (102) found that the percentage of power in the 3-cpm range was significantly lower in patients with idiopathic gastroparesis compared to patients with obstructive gastroparesis. They also found that the percentage of power in the tachygastria range (3.6–9.9 cpm) correlated significantly with the intensity of nausea reported during vector-induced motion sickness (103). The advantage of this method is that it is easy for computation. We should be aware, however, that only relative values of this parameters in comparison with the control data should be used. Even in normal subjects, the percentage of normal EGG activity computed in this way will never be 100%. Note that this parameter is sensitive to noise, since any noise component in the frequency band of 1–15 cpm affects the computation of this parameter. Harmonics of the fundamental 3 cpm slow wave may be computed as tachygastria (8,74).
Percentage of Slow Wave Coupling. Slow wave coupling is a measure of the coupling between two EGG channels. The percentage of slow wave coupling is defined as the percentage of time during which the slow wave is determined to be coupled. The slow waves between two EGG channels are defined as coupled if the difference in their dominant frequencies is < 0.2 (77,78,95) or 0.5 cpm (76).
Methods to Obtain EGG Parameters
Spectral analysis methods are commonly used for calculation of the EGG parameters, including power spectral analysis and running spectral analysis (RSA) or time-frequency analysis. The frequency and power of the EGG can be derived from the power spectral density. The periodogram is one of the commonly used methods for the calculation of
the power spectrum density (73). In this method, EGG data samples are divided into consequent segments with certain overlap. A FT is performed on each data segment, and the resultant functions of all segments are averaged. The periodogram method is more appropriate for the computation of the power spectrum of a prolonged EGG recording. Whenever there are enough data samples, the periodogram method instead of the sample spectrum should be used for the calculation of the dominant frequency and power of the EGG (21). Another method to estimate the frequency and power of EGG is to use a parametric method such as autoregressive modeling (AR) parameters (19). These AR parameters are initially set at zeros and are iteratively adjusted using the EGG samples. After a certain number of iterations, the EGG signal can be represented by these AR parameters. That is, the power spectrum of the EGG signals can be calculated from these parameters (19,27). The problem is the appropriate selection of the model order or the number of parameters. Too few parameters reduce the accuracy, and too many increasing the computing time (98). Although this method is somewhat time consuming, the advantage is that compared to FFT-based methods, the period over which the signal is analyzed can be much shorter (19).
To extract not only information about the frequency of the EGG, but also information about time variations of the frequency, a running spectral analysis method using FFT was first introduced by a Dutch group (24) and later used by others (25,26,39). This method consists of a series of sequential sample spectra. It is calculated as follows: For a given data set of EGG, a time window (e.g., Hanning window) with a length of D samples is applied to the first D samples, a FFT with the same length is calculated, and a sample spectrum is obtained for the first block of data. The sample spectrum of the next time step is obtained in the same way by shifting the windows of some samples forward. The advantage of this method is easy for implantation. Its drawback is that it may not be able to provide accurate time frequency estimations when the characteristics of the EGG signal change rapidly (72,104).
To avoid the averaging effect introduced by the FFT, Chen et al.(28) developed an adaptive spectral analysis based on the adaptive autoregressive moving average model (27). The main advantage of this method is that it is able to provide the instantaneous frequency of an EGG signal with short duration (29). Thus it is very useful for the detection of gastric dysrhythmias with brief duration, but may not be a good choice for the estimation of the EGG power (104). Recently, an exponential distribution (ED) method was also introduced for representation of EGG (92). The performance of the ED method is in between the RSA and the adaptive method. The cross-terms may deteriorate the performance of the ED method if the EGG signal contains several different frequency components (104). Time–frequency analysis methods other than those mentioned above have also been used, such as wavelet transform and fast Hartley transform (89). The description of these methods is mathematically complex and beyond the scope of this article. The detailed information can be found in (5) and (89).
An example of the calculation of the EGG parameters is shown in Fig. 6. The upper panel presents an EGG record-
ELECTROGASTROGRAM 91
ing obtained in a human subject. The power spectrum of this 30-min EGG is shown in the lower left panel. The lower right panel shows the power spectra of the 30-min EGG calculated by the adaptive spectral analysis method (28). Each line in Fig. 6c represents the power spectrum of 2-min nonoverlap data (from bottom to top). The percentage of normal slow wave and dysrhythmias can be calculated from these spectra. Of 15 spectra, 12 have peaks in the 2–4 cpm range, that is, 80% of the EGG recording has normal slow waves. Three spectra (two in the bradygastria range and one in the tachygastria range) have peaks outside the normal slow wave range. The percentage of dysrhythmias is then 20%.
EGG IN ADULTS
EGG in Healthy Subjects
Definitions of what constitutes a normal EGG have been provided by careful analysis of EGG recordings from normal volunteers (6).
Normal EGG Frequency Range. Several studies (4,41,49,68,70,71) in healthy adults have shown that EGG in the fasting state is characterized by a stable slow wave dominant frequency (DF) (median: 3.0 cpm; range: 2– 4 cpm) with a relatively small amplitude. Immediately after the test meal, the EGG frequency decreases from the baseline for a short period [ 5 min. (4)] and then gradually increases to above the baseline level (media: 3.2 cpm; range: 2–4 cpm). It has been shown that the postprandial EGG DF is also dependent on the type and specific qualities of the ingested test meal (99). Solid meals slightly, but significantly, increase EGG DF, whereas liquid meals temporarily reduce the EGG DF.
Based on the normal EGG frequency range of 2–4 cpm, the overall results of four studies in 189 normal subjects suggest that 70% is an appropriate lower limit of normal for the percentage of the recording time for the EGG rhythm to be in the 2.0–4.0-cpm range (4,41,49,68,70,71).
Note that the definition of normal EGG frequency range reported in the literature varies considerately (see Table 1). The Penn State group defined the percentage of normal EGG activity as the percentage of the power in the frequency range of 2.4–3.6 cpm compared to the total power from 1 to 15 cpm (84). Accordingly, dysrhythms are considered present when too much power is in the low frequency range (bradygastria) or in the high frequency range (tachygastria). This approach is debatable due to the following reasons: (1) The EGG is not sinusoid and thus its power spectrum contains harmonics that are related to the waveform, but not at all associated with gastric rhythmicity. In this method, however, the harmonics are considered as tachgastria (8). (2) The method is very sensitive to motion artifacts that can result in abnormal frequency spectra with significant power in the low frequency range (8,9). Apparently, the differences in the definitions of the normal frequency range of EGG or dysrhthmias are at least related the following two factors: (1) Relative small numbers of subjects were included in the above EGG studies; (2) different analysis methods were used to analyze the EGG

92 ELECTROGASTROGRAM
data. To establish better definitions of normal frequency rang and dysrhythmias, an international multicenter EGG study with a relative large sample size is needed and the currently used analysis methods should be applied to compare the results.
EGG Power in the Fasting and EGG Power Ratio. Absolute values of EGG power during fasting and the postprandial period are affected by a number of variables including body habitus, electrodes placement, and body position (6,105). However, these factors do not influence the relative value in EGG power, that is, the power ratio between the preand postprandial powers. Depending on meals consumed, 90– 95% of healthy volunteers exhibit increased postprandial power at DF (6,41,71). Note that different meals may have different effects on the EGG. The main results for the effects of different meals on the EGG power are summarized as follows (99):
Water: Water induces an increase in EGG dominant power and a decrease in EGG dominant frequency. In a study with 10 normal subjects drinking 140 mL water (106), it was found that the EGG dominant frequency was slightly, but significantly, lower than the baseline in the fasting state during the first 10 min after the drink (2.95 vs. 2.73 cpm, p < 0.05). The power of the EGG at the dominant frequency was significantly higher after the drink than the baseline. A 3 dB increase in EGG dominant power (equivalent to 41% increase in 3 cpm amplitude) was observed. Similar observations were reported by several other investigators (66,107). In a recently performed study, simultaneous EGG and serosal recordings of gastric myoelectrical activity were made in patients before and after a drink of water (66). Statistical analysis demonstrated that the EGG dominant power change after a drink of water was correlated with that observed in the serosal recording (Spearman’s correlation coefficient: r ¼ 0.757, p ¼ 0.007) and the change of EGG dominant frequency was the same as that from serosal recordings.
Milk: To investigate whether there is a different effect between non-nutritive (water) and a nutritive liquid meal, Chen et al.repeated the study procedure mentioned above in Ref. 106 by asking volunteers to drink 140 mL of 2% milk. The results showed that milk decreases the amplitude of EGG. The average decrease in EGG power in the 10 subjects within the first 10 min was 3.8 dB (equivalent to 50% decrease in amplitude (108).
Solid meal: The effects of solid meal on the EGG have been studied by numerous investigators (5,16,33,101,106). More significant increase in EGG dominant power was observed after the solid meal than after a drink of water. For example, the average EGG dominant power after a solid meal over 10 subjects was 6 dB higher than the preprandial value, equivalent to a 100% increase in amplitude (106) (see Fig. 7a and b). The actual amount of increase in EGG dominant power is believed to be associated with the volume and content of the meal (see next section). The dominant frequency of the EGG seems to increase as well after a test meal. Similar to the change in EGG dominant frequency after a drink of water, this increase is often small, but significant (106).
Figure 7. Preand postprandial EGG recordings in humans. (a) and (b): normal EGG patterns that show an increase in EGG amplitude postprandialy; (c) and (d): dysryhthmic EGG pattern and a substantial decrease in EGG amplitude after the meal.
EGG IN PATIENTS
Abnormal EGG
A variety of abnormalities have been described on EGG recordings from patients with motility disorders. For example, abnormal EGGs are noted with nausea, vomiting, early satiety, anorexia, and dyspepsia including gastroparesis (41–44,102), nonulcer or functional dyspepsia (46– 50,76,109), motion sickness (5,25,110), pregnancy (38– 40), and eating disorders (35). Typical EGG abnormalities in patients with motility disorders or symptoms include (1) absence of normal slow waves, which is shown in the EGG power spectra as a lack of peaks in the 2–4 cpm frequency range; (2) gastric dysrhythmias, including bradygastria, tachygastria, and arrhythmia (see Fig. 8); (3) deterioration of the EGG after a test meal, which is shown as a decrease in EGG power in the 2–4 cpm frequency range (see Fig. 7c and d), (4) slow wave uncoupling between different gastric segments detected from a multichannel EGG recording (76–78,95,96).
Definition of an abnormal EGG is mainly determined by comparison of EGG findings in healthy volunteers and symptomatic patients (41). At present, it is widely accepted that an EGG is considered as abnormal if the DF is in the tachyand/or bradygastric frequency ranges for > 30% of the time. This number takes into account the observation that healthy volunteers exhibit periods of time representing up to 30% of recording time in which recognizable EGG rhythms are not distinguishable from background electrical noise either on visual inspection or computer analysis.
ELECTROGASTROGRAM 93
In addition, a decreased power ratio after a solid meal is also an indication of an abnormal EGG (6,7,41,68–71).
Some institutions have advocated the use of percentage distribution of EGG power in the three major frequency bands to summarize the absolute signal amplitude in the bradygastric, normal rhythm, and tachygastria ranges (2,84,111). For this parameter, an EGG is considered abnormal if the percentage distribution of total EGG power in the tachygastric range is > 20% (6,112). Power distributions in the bradygastric frequency range are highly variable and may be affected by minor variations in the signal baseline or subtle motion artifacts. Thus the calculation of the percentage of the total EGG power in the bradygastric frequency range may not be reliable for the determination of bradygastria (6).
Clinical Role of EGG. The FDA approved EGG as a test for patient evaluation in 2000. The FDA statement on EGG concluded that EGG is a noninvasive test for detecting gastric slow waves and is able to differentiate adult patients with normal myoelectrical activity from those with bradygastrias and techygastrias. The EGG can be considered as part of a comprehensive evaluation of adult patients with symptoms consistent with gastrointestinal motility disorders (6).
The members of the American Motility Society Clinical GI Motility Testing Task Force proposed the following indications for EGG as a diagnostic study to noninvasively record gastric myoelectrical activity in patients with unexplained persistent or episodic symptoms that may be related to a gastric motility and/or myoelectrical disorder
(6). The EGG can be obtained: (1) to define gastric myoelectric disturbances in patients with nausea and vomiting unexplained by other diagnostic testing or associated with functional dyspepsia and (2) to characterize gastric myoelectric disturbances associated with documented gastroparesis.
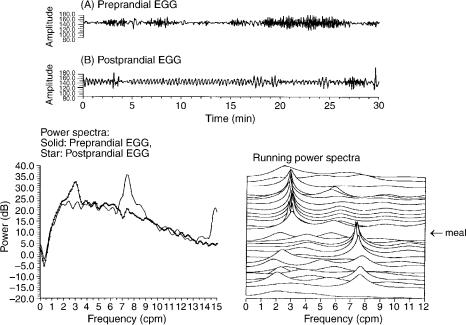
Figure 8. The EGG recordings in a patient with gastroparesis: (a) 30-min preprandial EGG recording, (b) 30-min postprandial EGG. Lower left panel: Power spectra of preprandial EGG (solid line) and postprandial EGG (line with star) shows abnormal response to a meal (decrease in postprandial EGG power) and tachgastria after meal (EGG dominant frequency: 7.4 cpm). Lower right panel shows the running spectra of 30-min preprandial EGG and 30-min postprandial EGG demonstrating the presence of 7–8 cpm tachygastrial peaks before meal and normal 3-cpm peaks after meal.
The future clinical applications of EGG are in three main areas: (1) To assist in the clinical evaluation and diagnosis of patients with gastric motility disorders. (2) To determine the gastric response to either caloric stimuli or exogenous stimuli, such as pharmacologic and prokinetic agents or gastrointestinal hormones or gastric electrical stimulation or for patients before and after kidney– pancreas (KP) transplant (113–115). (3) To further evaluate the role of EGG in research and clinical work in infants and children (6,7,116).
EGG IN INFANTS AND CHILDREN
Although the majority of EGG studies are being performed in adults, there is an increased interest for the clinical application of EGG to pediatric patients. In infants, current diagnostic methods for the assessment of gastric motility, such as intraluminal manometry and radionuclide isotope study, are very much limited. Consequently, little is known on gastric myoelectrical in infants since mucosal–serosal recordings are not feasible, and much less information is available in infants than adults on gastric motility. The EGG is therefore an attractive noninvasive alternative to study gastric myoelectrical and motor activities in infants and children. In recent years, a small number of pediatric gastroenterologists and researchers, including Peter Milla, Alberto Ravelli, Salvatore Cucchiara, Giuseppe Riezzo, and Jiande Chen, et al. have began to use the EGG to study the pathophysiology of gastric motility in infants and children (11).
Patterns of GMA in Healthy Pediatric Subjects with Different Ages
To investigate whether EGG patterns are associated with ages, Chen et al. (117) performed EGG studies in five groups of healthy subjects including 10 preterm newborns,

94 ELECTROGASTROGRAM
8 full-term newborns, 8 full-term infants (ages 2–6 months), 9 children (ages 4–11 years), and 9 adults. The Digitrpper EGG recorder was used to record EGG signals for 30 min before and 30 min after a test meal in each subject. Spectral analysis methods were applied to computer EGG parameters. The results showed that the percentage of 2–4 cpm slow waves was 26.6 3.9% in the preterm newborns, 30.0 4.0% in full-term newborns, 70 6.1% in 2–6-months old infants (P < 0.001 compared with newborns), 84.6 3.2% in 4–11-year old children (P < 0.03 compared with infants), and 88.9 2.2% in the adults (P > 0.05 compared with children). This study has shown that regular gastric slow waves (2–4 cpm) are absent at birth, present at age of 2–4 months, and well developed at the age of 4–11 years. The EGG in healthy children is similar to that in healthy adults.
Using the percentage of total EGG power in the frequency range 2.5–3.6 cpm as a measure of normal gastric slow waves, Koch et al. reported similar findings in preterm and full-term infants with ages from 3 to 50 days: a low percentage of normal gastric slow waves, no difference between preterm and fullterm infants, and no difference between fasting EGG and fed EGG (111). These studies suggest that gastric slow waves are largely absent at birth, and there is a maturing process after birth.
To study the development or maturation of gastric slow waves in preterm infants, Liang et al. (118) performed a follow-up EGG study in 19 healthy preterm infants at postnatal ages of 1 and 2 weeks and 1, 2, 4, and 6 months (gestational age at birth: 33.5 2.6 week). The results showed that the percentage of normal slow waves was low at birth and there was a progressive increase with age during the first 6 months of life (see Fig. 9). These results suggest that normative EGG data should be established for different age groups and age-matched controls
|
|
|
|
|
|
|
|
|
Preprandial |
|
|
|
|
|
|
|
|
|
|
|
|
|
|
|
|
|
|
|
|
|
|
|
|
|
|
|
|
|||||||||||||||||||||||||
|
100 |
|
|
|
|
|
|
|
Postprandial |
|
|
|
p<0.02 |
|||||||||||||||||||||||||||||||||||||||||||||||||
|
|
|
|
|
|
|
|
|
|
|
||||||||||||||||||||||||||||||||||||||||||||||||||||
|
|
|
|
|
|
|
|
|
|
|
|
|
|
|
|
|
|
|
|
|
|
|
|
|
|
p<0.2 |
|
|
|
|
|
|
|
|
|
|
|
|
|
|
|
|
|
|
|
|
|
|
|
|
|
|
|
|
||||||||
waves |
90 |
|
|
|
|
|
|
|
|
|
|
|
|
|
|
|
|
|
|
|
|
|
|
|
|
|
|
|
|
|
|
|
|
|
|
|
|
|
|
|
|
|
|
|
|
|
|
|
|
|
|
|
|
|
||||||||
|
|
|
|
|
|
|
|
|
|
|
|
|
|
|
|
|
|
|
|
|
|
|
|
|
|
|
|
|
|
|
|
|
|
|
|
|
|
|
|
|
|
|
|
|
|
|
|
|
|
|
|
|
||||||||||
|
|
|
|
|
|
|
|
|
|
|
|
|
|
|
|
|
|
|
|
|
|
|
|
|
|
|
|
|
|
|
|
|
|
|
|
|
|
|
|
|
|
|
|
|
|
|
|
|
||||||||||||||
80 |
|
|
|
|
|
p<0.01 |
|
p<0.002 |
|
|
|
|
|
|
|
|
|
|
|
|
|
|
|
|
|
|
|
|
|
|
|
|
|
|
|
|
|
|
|
|
|
|
|
|
||||||||||||||||||
|
|
|
|
|
|
|
|
|
|
|
|
|
|
|
|
|
|
|
|
|
|
|
|
|
|
|
|
|
|
|
|
|
|
|
|
|
|
|
|
|
|
|||||||||||||||||||||
|
|
|
|
|
|
|
|
|
|
|
|
|
|
|
|
|
|
|
|
|
|
|
|
|
|
|
|
|
|
|
|
|
|
|
|
|||||||||||||||||||||||||||
|
|
|
|
|
|
|
|
|
|
|
|
|
|
|
|
|
|
|
|
|
|
|
|
|
|
|
|
|
|
|
|
|
|
|
||||||||||||||||||||||||||||
-4 cpm |
70 |
|
|
|
|
|
|
|
|
|
|
|
|
|
|
|
|
|
|
|
|
|
|
|
|
|
|
|
|
|
|
|
|
|
|
|
|
|
|
|
|
|
|
|
|
|
|
|
|
|
|
|
|
|||||||||
60 |
|
|
|
|
|
|
|
|
|
|
|
|
|
|
|
|
|
|
|
|
|
|
|
|
|
|
|
|
|
|
|
|
|
|
|
|
|
|
|
|
|
|
|
|
|
|
|
|
|
|
|
|
|
|
|
|
|
|
|
|
|
|
|
|
|
|
|
|
|
|
|
|
|
|
|
|
|
|
|
|
|
|
|
|
|
|
|
|
|
|
|
|
|
|
|
|
|
|
|
|
|
|
|
|
|
|
|
|
|
|
|
|
|
|
|
|
|
|
|
|
|
|
|
||
of 2 |
50 |
|
|
|
|
|
|
|
|
|
|
|
|
|
|
|
|
|
|
|
|
|
|
|
|
|
|
|
|
|
|
|
|
|
|
|
|
|
|
|
|
|
|
|
|
|
|
|
|
|
|
|
|
|
|
|
|
|
|
|
|
|
(%) |
|
|
|
|
|
|
|
|
|
|
|
|
|
|
|
|
|
|
|
|
|
|
|
|
|
|
|
|
|
|
|
|
|
|
|
|
|
|
|
|
|
|
|
|
|
|
|
|
|
|
|
|
|
|
|
|
|
|
|
|
|
|
Percentage |
40 |
|
|
|
|
|
|
|
|
|
|
|
|
|
|
|
|
|
|
|
|
|
|
|
|
|
|
|
|
|
|
|
|
|
|
|
|
|
|
|
|
|
|
|
|
|
|
|
|
|
|
|
|
|
|
|
|
|
|
|
|
|
30 |
|
|
|
|
|
|
|
|
|
|
|
|
|
|
|
|
|
|
|
|
|
|
|
|
|
|
|
|
|
|
|
|
|
|
|
|
|
|
|
|
|
|
|
|
|
|
|
|
|
|
|
|
|
|
|
|
|
|
|
|
|
|
|
|
|
|
|
|
|
|
|
|
|
|
|
|
|
|
|
|
|
|
|
|
|
|
|
|
|
|
|
|
|
|
|
|
|
|
|
|
|
|
|
|
|
|
|
|
|
|
|
|
|
|
|
|
|
|
|
|
|
|
|
||
|
|
|
|
|
|
|
|
|
|
|
|
|
|
|
|
|
|
|
|
|
|
|
|
|
|
|
|
|
|
|
|
|
|
|
|
|
|
|
|
|
|
|
|
|
|
|
|
|
|
|
|
|
|
|
|
|
|
|
|
|
|
|
|
20 |
|
|
|
|
|
|
|
|
|
|
|
|
|
|
|
|
|
|
|
|
|
|
|
|
|
|
|
|
|
|
|
|
|
|
|
|
|
|
|
|
|
|
|
|
|
|
|
|
|
|
|
|
|
|
|
|
|
|
|
|
|
|
|
|
|
|
|
|
|
|
|
|
|
|
|
|
|
|
|
|
|
|
|
|
|
|
|
|
|
|
|
|
|
|
|
|
|
|
|
|
|
|
|
|
|
|
|
|
|
|
|
|
|
|
|
|
|
|
|
|
|
|
|
|
|
10 |
|
|
|
|
|
|
|
|
|
|
|
|
|
|
|
|
|
|
|
|
|
|
|
|
|
|
|
|
|
|
|
|
|
|
|
|
|
|
|
|
|
|
|
|
|
|
|
|
|
|
|
|
|
|
|
|
|
|
|
|
|
|
|
|
|
|
|
|
|
|
|
|
|
|
|
|
|
|
|
|
|
|
|
|
|
|
|
|
|
|
|
|
|
|
|
|
|
|
|
|
|
|
|
|
|
|
|
|
|
|
|
|
|
|
|
|
|
|
|
|
|
|
|
|
|
0 |
|
|
|
|
|
|
|
|
|
|
|
|
|
|
|
|
|
|
|
|
|
|
|
|
|
|
|
|
|
|
|
|
|
|
|
|
|
|
|
|
|
|
|
|
|
|
|
|
|
|
|
|
|
|
|
|
|
|
|
|
|
|
|
|
|
1 wk |
2 wk 1 mo |
|
2 mo 4 mo 6 mo |
|||||||||||||||||||||||||||||||||||||||||||||||||||||||
|
|
|
|
|
|
|||||||||||||||||||||||||||||||||||||||||||||||||||||||||
Figure 9. Preprandial and postprandial percentages of the normal 2–4-cpm slow waves in preterm infants at the ages of 1 and 2 weeks and 1, 2, 4, and 6 months. The P values resulted from comparison between paired fasting data or paired fed data.
are necessary for the interpretation of EGG from diseased neonates and infants.
EGG Norms in Healthy Children and Effects of Age, Gender, and BMI
As with any novel technique, the establishment of normal values is a prerequisite for reliable application across populations. Studies on EGG performed in healthy adults have found no major differences in EGG characteristics among age group (68,69,71). Using the same EGG recording and analysis system as utilized in healthy adults, Riezzo et al. performed EGG studies before and after a meal in 114 healthy children (age range: 6–12 years) (69) and Levy et al.conducted EGG studies in 55 healthy children (age range: 6–18 years) for a 1 h baseline preprandial period and a 1 h postprandial period after consummation of a standard 448 kcal meal (119). These studies have shown that the EGG patterns in the healthy children ages from 4 to 18 years are very similar to those in the healthy adults and the key normative values are not influenced by age and gender.
Applications in Pediatric Patients
Electrogastrogram has also been applied to evaluate pediatric patients with various diseases that are associated with gastric motility disorders. Functional dyspepsia presents as a challenge to clinicians with its debilitating features and no organic findings. Invasive diagnostic tests are limited in pediatric practice. Whereas, noninvisive EGG has been used and will be increasingly used to identify possible malfunctioning of the stomach, Cucchiara et al. (120) detected abnormal patterns of the EGG, encompassing all range of dysrhythmia, in 12 out of 14 patients with functional dyspepsia. Abnormalities in gastric myoelectrical activity were also observed from the EGG in pediatric patients with central nervous system disorders, chronic renal failure, and intestinal pseudoobstruction (98,121,122).
FUTURE PROSPECTS
The recording and analysis of the EGG are well established although not yet completely standardized. It is clear that the EGG is a reliable measurement of gastric slow waves and reflects relative contractile activity of the stomach. Clinical applications of the EGG are indicated in numerous studies. However, cautions should be made during recording to minimize motion artifact and in the interpretation of the EGG parameters. Future development in EGG methodology should be focused to reveal more information regarding spatial abnormalities of gastric slow waves and relevant information directly related to gastric contractility. In this regard, multichannel EGG may play a more important role in both electrophysiological studies of the stomach and clinical applications. Recently, several studies have been performed using a four-channel EGG system to derive spatial information from the multichannel EGG. These include spatial distribution of slow-wave frequency and amplitude, slow-wave coupling and propagation (75–78). The gastric slow wave propagation was measured by analyzing the phase shifts or time lags of
the EGG signal among different recording channels using cross-covariance analysis (75). Slow-wave coupling was defined as similar frequencies of the EGG signals in different channels and a cross-spectral analysis method has been established to compute the percentage of slow-wave coupling (93). Two single-center studies have suggested that patients with functional dyspepsia have impaired slow-wave propagation and coupling (76,78). Further multicenter studies are needed to determine how the expanded utility of the multichannel EGG.
The EGG is not only of great clinical significance in diagnosing gastric motility disorders, but may also play an important role in predicting and validating gastric electrical stimulation (GES) (116,123). Previous studies have established the efficacy of GES in reducing symptoms of gastroparesis. However, approximately one-third of the patients were shown to have poor response to GES therapy and the mechanism by which GES acts to improve gastroparetic symptoms is currently unclear (124,125). Physiological studies have demonstrated that gastric slow wave activity depends on the function of interstitial cells of Cajal (ICC) in the stomach (126–128). The ICC networks in the myenteric region of the gastric corpus and antrum (IC– MY) have been identified as the source of electrical slow waves that control the maximum frequency and propagation direction of gastric contractions. Ordog et al. (127) demonstrated that the loss of gastric IC–MY resulted in the loss of electrical slow waves and eliminated the ability the musculature to generate slow waves in response to depolarizing stimuli. Thus functional ICC is critical for the production and maintenance of normal slow wave activity and gastric motility. Degeneration of ICC is often found in some GI tract conditions characterized by ineffective motility of the affected segment. Recently, preliminary experiments have demonstrated (a) a normal baseline EGG is significantly correlated with an improved symptomatic outcome after chronic high frequency GES for refractory gastroparesis compared to an abnormal baseline EGG with which 50% of patients were nonresponders to the high frequency GES therapy; (b) the absence of ICC was correlated with abnormal EGG and patients with an absence of ICC showed less symptom improvement (123,129). These data suggest that baseline EGG status could be used to predict long-term symptom improvement in gastroparetic patients treated with GES. Specifically, marked gastric dysrhythmias as determined by the baseline EGG study is a predictor to a poor response to high frequency GES. Further studies are required to determine the role of EGG in the management of GI motility disorders.
BIBLIOGRAPHY
Cited References
1.Alvarez WC. The electrogastrogram and what it shows. JAMA 1922;78:1116–1118.
2.Stern RM, Koch KL, Stewart WR, Vasey MW. Electrogastrography: Current issues in validation and methodology. Psychophysiology 1987;24:55–64.
3.Abell TL, Malagelada J-R. Electrogastrography: Current assessment and future perspectives. Dig Dis Sci 1988;33: 982–992.
ELECTROGASTROGRAM 95
4.Geldof H, Van Der Schee EJ. Electrogastrography: Clinical applications. Scand J Gastroenterol 1989;24(Suppl. 171): 75–82.
5.Chen JZ, McCallum RW. Electrogastrography. Principles and Applications. New York: Raven Press; 1994.
6.Parkman HP, Hasler WL, Barnett JL, Eaker EY. Electrogastrography: a document prepared by the gastric section of the American Motility Society Clinical GI Motility Testing Task Force. Neurogastroenterol Motil 2003;15:89–102.
7.Camilleri M, Hasler W, Parkman HP, Quigley EMM, Soffer E. Measurement of gastroduodenal motility in the GI laboratory. Gastroenterology 1998;115:747–762.
8.Verhagen MAM, VanSchelven L J, Samsom M, Smout AJPM. Pitfalls in the analysis of electrogastrographic recordings. Gastroenterology 1999;117:453–460.
9.Mintchev MP, Kingma YJ, Bowes KL. Accuracy of coutaneous recordings of gastricelectrical activity. Gastroenterology 1993;104:1273–1280.
10.Lorenzo CD, Reddy SN, Flores AF, Hyman PE. Is electrogastrography a substitute for manometric studies in chidren with functional gastrointestinal disirders? Dig Dis Sci 1997;42(1):2310–2316.
11.Stern RM. The history of EGG. Neurogastroenterologia 2000;1:20–26.
12.Tumpeer IH, Blitzsten PW. Registration of peristalsis by the Einthoven galvanometer. Am J Dis Child 1926;11:454–455.
13.Tumpeer IH, Phillips B. Hyperperistaltic electrographic effects. Am J Med Sci 1932;184:831–836.
14.Davis RC, Galafolo L, Gault FP. An exploration of abdominal potentials. J Com Psysiol Psychol 1957;50:519–523.
15.Davis RC, Galafolo L, Kveim K. Conditions associated with gastrointestinal activity. J Com Physiol Psychol 1959;52: 466–475.
16.Stevens LK, Worrall N. External recording of gastric activity: the electrogastrogram. Physiol Psychol 1974;2:175–180.
17.Brown BH, Smallwood RH, Duthie HL, Stoddard CJ. Intestinal smooth muscle electrical potentials recorded from surface electrodes. Med Biol Eng Comput 1975;13:97–102.
18.Smallwood RH. Analysis of gastric electrical signals from surface electrodes using phase-lock techniques. Med Biol Eng Comput 1978;16:507–518.
19.Linkens DA, Datardina SP. Estimations of frequencies of gastrointestinal electrical rhythms using autoregressive modeling. Med Biol Eng Comput 1978;16:262–268.
20.Nelsen TS, Kohatsu S. Clinical electrogastrography and its relationship to gastric surgery. Am J Surg 1968;116:215– 222.
21.Chen J, McCallum RW. Electrogastrography: measurement, analysis and prospective applications. Med Biol Eng Comput 1991;29:339–350.
22.Smout JPM, van der Schee EJ, Grashuis JL. What is measured in electrogastrography? Dig Dis Sci 1980;25:179–187.
23.Koch KL, Stern RM. The relationship between the cutaneously recorded electrogastrogram and antral contractions in men. In: Stern RM, Koch KL, editors. Electrogastrography. New York: Praeger; 1985.
24.van der Schee EJ, Grashuis JT. Running spectral analysis as an aid in the representation and interpretation of electrogastrographical signal. Med Biol Eng Comput 1987;25:57–62.
25.Stern RM, Koch KL, Stewart WR, Lindblad IM. Spectral analysis of tachygastria recorded during motion sickness. Gastroenterology 1987;92:92–97.
26.Pfister CJ, Hamilton JW, Nagel N, Bass P, Webster JG, Thompkins WJ. Use of spectral analysis in the detection of frequency differences in the electrogastrograms of normal and diabetic subjects. IEEE Trans Biomed Eng 1988;BME- 35:935–941.
96ELECTROGASTROGRAM
27.Chen J. Adaptive filtering and its application in adaptive echo cancellation and in biomedical signal processing, Ph.D. dissertation, Department of Electrical Engineering. Katholieke Universiteit Leuven, Belgium; 1989.
28.Chen J, Vandewalle J, Sansen W, Vatrappen G, Jannssens J. Adaptive spectral analysis of cutaneous electrogastric signals using autoregressive moving average modelling. Med Biol Eng Comput 1990;28:531–536.
29.Chen JDZ, Stewart WR, McCallum RW. Spectral analysis of episodic rhythmic variations in the cutaneous electrogastrogram. IEEE Trans Biomed Eng 1993;BME-40:128–135.
30.Sobakin MA, Smirnov IP, Mishin LN. Electrogastrography. IRE Trans Biomed Electron 1962;BME-9:129–132.
31.Hamilton JW, Bellahsene B, Reichelderfer M, Webster JG, Bass P. Human electrogastrograms: Comparison of surface and mucosal recordings. Dig Dis Sci 1986;31:33–39.
32.Bortolotti M, Sarti P, Barbara L, Brunelli F. Gastric myoelectrical activity in patients with chronic idiopathic gastroparesis. J Gastrointest Motility 1990;2:104–108.
33.Koch KL, Stewart WR, Stern RM. Effect of barium meals on gastric electromechanical activity in man. Dig Dis Sci 1987;32:1217–1222.
34.Chen J, Richards R, McCallum RW. Frequency components of the electrogastrogram and their correlations with gastrointestinal motility. Med Biol Eng Comput 1993;31:60– 67.
35.Abell TL, Malagelada J-R, Lucas AR, Brown ML, Camilleri M, GoVL,AzpirozF,CallawayCW,Kao PC,ZinsmeisterAR,et al. Gastric electromechanical and nerohorminal function in anorexia nervosa. Gastroenterology 1987;93:958–965.
36.Geldof H, van der Schee EJ, Grashuis JL. Electrogastrographic characteristics of interdigestive migrating complex in humans. Am J Physiol 1986;250:G165–171.
37.Chen JDZ, Richards RD, McCallum RW. Identification of gastric contractions from the cutaneous electrogastrogram. Am J Gastroenterol 1994;89:79–85.
38.Abell TL. Nausea and vomiting of pregnancy and the electrogastrogram: Old disease, new technology. Am J Gastroenterol 1992;87:689–681.
39.Koch KL, Stern RM, Vasey M, Botti JJ, Creasy GW, Dwyer A. Gastric dysrhythmias and nausea of pregnancy. Dig Dis Sci 1990;35:961–968.
40.Riezzo G, Pezzolla F, Darconza G, Giorgio I. Gastric myoelectrical activity in the first trimester of pregnancy: A cutaneous electrogastrographic study. Am J Gastroenterol 1992;87:702–707.
41.Chen J, McCallum RW. Gastric slow wave abnormalities in patients with gastroparesis. Am J Gastroenterol 1992;97: 477–482.
42.Chen JZ, Lin Z, Pan J, McCallum RW. Abnormal gastric myoelectrical activity and delayed gastric emptying in patients with symptoms suggestive of gastroparesis. Dig Dis Sci 1996;41(8):1538–1545.
43.Abell TL, Camilleri M, Hench VS, et al.Gastric electromechanical function and gastric emptying in diabetic gastroparesis. Eur J Gastroenterol Hepatol 1991;3:163–167.
44.Koch KL, Stern RM, Stewart WR, Dwyer AE. Gastric emptying and gastric myoelectrical activity in patients with diabetic gastroparesis: Effect of long-term domperidone treatment. Am J Gastroenterol 1989;84:1069–1075.
45.Cucchiara S, Riezzo G, Minella R, et al. Electrogastrography in non-ulcer dyspepsia. Arch Disease Childhood 1992;67(5): 613–617.
46.Parkman HP, Miller MA, Trate D, Knight LC, Urbain J-L, Maurer AH, Fisher RS. Electrogastrography and gastric emptying scintigraphy are complementary for assessment of dyspepsia. J Clin Gastroenterol 1997;24:214–219.
47.Pfaffenbach B, Adamek RJ, Bartholomaus C, Wegener M. Gastric dysrhythmias and delayed gastric emptying in patients with functional dyspepsia. Dig Dis Sci 1997;42 (10):2094–2099.
48.Lin X, Levanon D, Chen JDZ. Impaired postprandial gastric slow waves in patients with functional dyspepsia. Dig Dis Sci 1998;43(8):1678–1684.
49.Lin Z, Eaker EY, Sarosiek I, McCallum RW. Gastric myoelectrical activity and gastric emptying in patients with functional dyspepsia. Am J Gastroenterol 1999;94(9): 2384–2389.
50.Leahy A, Besherdas K, Clayman C, Mason I, Epstein O. Abnormalities of the electrogastrogram in functional dyspepsia. Am J Gastroenterol 1999;94(4):1023–1028.
51.Hongo M, Okuno Y, Nishimura N, Toyota T, Okuyama S. Electrogastrography for prediction of gastric emptying state. In: Chen JZ, McCallum RW, editors. Electrogastrography: Principles and Applications. New York: Raven Press; 1994.
52.Smallwood RH. Gastrointestinal electrical activity from surface electrodes. Ph.D. dissertation Sheffield (UK).
53.Smout AJPM. Myoelectric activity of the stomach: gastroelectromyography and electrogastrography. Ph.D. Dissertation, Erasmus Universiteit Rotterdam, Delft University Press, 1980.
54.Kingma YJ. The electrogastrogram and its analysis. Crit Rev Biomed Eng 1989;17:105–132.
55.van der Schee EJ. Electrogastrography: signal analysis aspects and interpretation. Ph.D. Dissertation, Erasmus Universiteit Rotterdam, Delft University Press, 1984.
56.Stern RM, Koch KL, editors. Electrogastrography: Methodology, Validation and Application. New York: Praeger; 1985.
57.Sarna SK, Daniel EE. Gastrointestinal electrical activity: Terminology. Gastroenterology 1975;68:1631–1635.
58.Hinder RA, Kelly KA. Human gastric pacemaker potential: Site of orgin, spread, and response to gastric transsaction and proximal gastric vagotomy. Am J Surg 1977;133:29–33.
59.Kelly KA. Motiltiy of the stomach and gastroduodenal junction. In: Johnson IA, editor. Physiology of the Gastrointestinal Tract. New York: Raven; 1981.
60.Sanders KM. A case for interstitial cells of Cajal as pacemakers and mediators of neurotransmission in the gastrointestinal tract. Gastroenterology 1996;112(2):492–445.
61.Abell TL, Malagelada J-R. Glucagon-evoked gastric dysrhythmias in humans shown by an improved electrogastrographic technique. Gastroenterology 1985;88:1932–1940.
62.Chen JDZ, Pan J, McCallum RW. Clinical significance of gastric myoelectrical dysrhythmas. Dig Dis 1995;13: 275–90.
63.Qian LW, Pasricha PJ, Chen JDZ. Origin and patterns of spontaneous and drug-induced Canine Gastric Myoelectrical Dysrhythmias. Dig Dis Sci 2003;48:508–515.
64.Familoni BO, Bowes KL, Kingma YJ, Cote KR. Can transcutaneous recordings detect gastric electrical abnormalities? Gut 1991;32:141–146.
65.Chen J, Schirmer BD, McCallum RW. Serosal and cutaneous recordings of gastric myoelectrical activity in patients with gastroparesis. Am J Physiol 1994;266:G90–G98.
66.Lin Z, Chen JDZ, Schirmer BD, McCallum RW. Postprandial response of gastric slow waves: correlation of serosal recordings with the electrogastrogram. Dig Dis Sci 2000; 45(4):645– 651.
67.Riezzo G, Pezzolla F, Thouvenot J, et al. Reproducibility of cutaneous recordings of electrogasography in the fasting state in man. Pathol Biol 1992;40:889–894.
68.Pfaffenbach B, Adamek RJ, Kuhn K, Wegneer M. Electrogastrography in health subjects: Evaluation of normal values, influence of age and gender. Dig Dis Sci 1995;40: 1445–1450.
69.Riezzo G, Chiloiro M, Guerra V. Electrogastrography in health children: Evaluation of normal values, influence of age, gender and obesity. Dig Dis Sci 1998;43:1646– 1651.
70.Riezzo G, Pezzolla F, Giorgio I. Effects of age and obesity on fasting gastric electrical activity in man: a cutaneous electrogastrographic study. Digestion 1991;50:176–181.
71.Parkman HP, Harris AD, Miller MA, Fisher RS. Influence of age, gender, and menstrual cycle on the normal electrogastrogram. Am J Gastroenterol 1996;91:127–133.
72.Chen JDZ, McCallum RW. Clinical application of electrogastrography. Am J Gastroenterol 1993;88:1324–1336.
73.Oppenheim AV, Schafer RW. Digital Signal Processing. New Jersey: Prentice Hall; 1975.
74.Mintchev MP, Rashev PZ, Bowes KL. Misinterpretation of human electrogastrograms related to inappropriate data conditioning and acquisition using digital computers. Dig Dis Sci 2000;45(11):2137–2144.
75.Chen JDZ, Zhou X, Lin XM, Ouyang S, Liang J. Detection of gastric slow wave propagation from the cutaneous electrogastrogram. Am J Physiol 1999;227:G424–G430.
76.Lin XM, Chen JDZ. Abnormal gastric slow waves in patients with functional dyspepsia assessed by multichannel electrogastrography. Am J Physiol 2001;280:G1370–G1375.
77.Simonian HP, Panganamamula K, Parkman HP, Xu X, Chen JZ, Lindberg G, Xu H, Shao C, Ke M-Y, Lykke M, Hansen P, Barner B, Buhl H. Multichannel electrogastrography (EGG) in normal subjects: A multicenter study. Dig Dis Sci 2004;49:594–601.
78.Simonian HP, Panganamamula K, Chen JDZ, Fisher RS, Parkman HP. Multichannel electrogastrography (EGG) in symptomatic patients: A single center study. Am J Gastroenterol 2004;99:478–485.
79.Chen JZ, Lin Z, McCallum RW. Toward ambulatory recording of electrogastrogram. In: Chen JZ, McCallum RW, editors. Electrogastrography: Principles and Applications. New York: Raven Press; 1994.
80.Mirizzi N, Scafoglieri U. Optimal direction of the electrogastrographic signal in man. Med Biol Eng Comput 1983; 21:385–389.
81.Patterson M, Rintala R, Lloyd D, Abernethy L, Houghton D, Williams J. Validation of electrode placement in neonatal electrogastrography. Dig Dis Sci 2001;40(10):2245–2249.
82.Levanon D, Zhang M, Chen JDZ. Efficiency and efficacy of the electrogastrogram. Dig Dis Sci 1998;43(5):1023–1030.
83.Smout AJPM, Jebbink HJA, Samsom M. Acquisition and analysis of electrogastrographic data. In: Chen JDZ, McCallum RW, editors. Electrogastrography: principles and applications. New York: Raven Press; 1994. p 3–30.
84.Koch KL, Stern RM. Electrogastrographic data and analysis. In: Chen JDZ, McCallum RW, editors. Electrogastrography: Principles and Applications. New York: Raven Press; 1994. p 31–44.
85.Volkers ACW, van der Schee EJ, Grashuis JL. Electrogastrography in the dog: Waveform analysis by a coherent averaging technique. Med Biol Eng Comput 1983;21:51–64.
86.Chen J. A computerized data analysis system for electrogastrogram. Comput Biol Med 1992;22:45–57.
87.Familoni BO, Kingma YJ, Bowes KL. Study of transcutaneous and intraluminal measurement of gastric electrical activity in human. Med Biol Eng Comput 1987;25:397–402.
88.Familoni BO, Kingma YJ, Bowes KL. Noninvasive assessment of huma gastric motor function. IEEE Trans Biomed Eng 1987;BME-34:30–36.
89.Mintchev MP, Bowes KL. Extracting quantitative information from digital electrogastrograms. Med Biol Eng Comput 1996;34:244–248.
ELECTROGASTROGRAM 97
90.Chen J, Vandewalle J, Sansen W, et al. Adaptive method for cancellation of respiratory artifact in electrogastric measurements. Med Biol Eng Comput 1989;27:57–63.
91.Chen JZ, Lin Z. Comparison of adaptive filtering in time-, transforemand frequency-domain: A electrogastrographic study. Ann Biomed Eng 1994;22:423–431.
92.Lin Z, Chen JDZ. Time-frequency representation of the electrogastrogram–application of the exponential distribution. IEEE Trans Biomed Eng 1994;41(3):267–275.
93.Lin Z, Chen JDZ. Applications of feed-forward neural networks in the electrogastrograms. In: Akay M, editor. Nonlinear Biomedical Signal Processing. Piscataway (NJ): IEEE Press; 2000. p 233–255.
94.Wang ZS, He Z, Chen JDZ. Filter banks and neural networkbased future extraction and automatic classification of electrogastrogram. Ann Biomed Eng 1999;27:88–95.
95.Wang ZS, Elsenbruch S, Orr WC, Chen JDZ. Detection of gastric slow wave uncoupling from multi-channel electrogastrogram: validations and applications. Neurogastroenterol Motil 2003;15:457–465.
96.Liang J, Cheung JY, Chen JDZ. Detection and deletion of motion artifacts in electrogastrogram using feature analysis and neural networks. Ann Biomed Eng 1997;25:850–857.
97.Wang ZS, Cheung JY, Chen JDZ. Blind separation of multichannel electrogastrograms using independent component analysis. Med Biol Eng Comput 1999;37:80–86.
98.Ravelli AM, Milla PJ. Electrogastrography in vomiting chidren with disorders of the central nervous system. In: Chen JDZ, McCallum RW, editors. Electrogastrography: Principles and Applications. New York: Raven Press; 1994. p 403–410.
99.Chen JDZ, McCallum RW. Electrogastrographic parameters and their clinical significance. In: Chen JDZ, McCallum RW, editors. Electrogastrography: Principles and Applications. New York: Raven Press; 1994. p 45–73.
100.Liang J, Chen JDZ. What can be measured from surface electrogastrography? Dig Dis Sci 1997;42(7):1331–1343.
101.Geldof H, van der Schee EJ, Smout AJPM. Myoelectrical activity of the stomach in gastric ulcer patients: An electrogastrographic study. J Gastrointest Motil 1989;1:122– 130.
102.Koch KL, Bingaman S, Sperry N, Stern RM. Electrogastrography differentiates mechanical vs. idiopathic gastroparesis in patients with nausea and vomiting. Gastroenterology 1991;100:A99, (Abstract).
103.Xu L, Koch KL, Summy-Long J, Stern RM, Demers L, Bingaman S. Hypothalamic and gastric myoelectrical responses to vection in healthy Chinese subjects. Am J Physiol 1993;265:E578–E584.
104.Lin Z, Chen JDZ. Time-frequency analysis of the electrogastrogram. In: Akay M, editor. Time-Frequency and Wavelets in Biomedical Engineering. Piscataway, NJ: IEEE Press; 1996. 147–181.
105.Sanaka MR, Xing JH, Soffer EE. The effect of body posture on electrogastrogram. Am J Gastroenterol 2001;96:S73. (Abstract).
106.Chen J, McCallum RW. The response of electrical activity in normal human stomach to water and solid meal. Med Biol Eng Comput 1991;29:351–357.
107.Watanabe M, Shimada Y, Sakai S, Shibahara N, Matsumi H, Umeno K, Asanoi H, Terasawa K. Effects of water ingestion on gastric electrical activity and heart-rate variability in healthy human subjects. J Autonomic Nervous System 1996;58:44–50.
108.Chen J, McCallum RW. Effect of milk on myoelectrical activity in normal human stomach: An electrogastrographic study. Med Biol Eng Comput 1992;30:564–567.