

98ELECTROMYOGRAPHY
109.Lin ZY, Chen JDZ, McCallum RW, Parolisi S, Shifflett J, Peura D. The prevalence of electrogastrogram abnormalities in patients with non-ulcer and H. pylori infection: results of H. pylori eradication. Dig Dis Sci 2001;46(4):739–745.
110.Stern RM, Koch KL, Leibowitz HW, Lindblad I, Shupert C, Stewart WR. Tachygastria and motion sickness. Aviat Space Environ Med 1985;56:1074–1077.
111.Koch KL, Tran TN, Stern RM, Bringaman S, et al.Gastric myoelectrical activity in premature and term infants. J Gastrointest Motil 1993;5:41–47.
112.Koch KL, Bringaman S, Tran TN, Stern RM. Visceral perceptions and gastric myoelectrical activity in healthy women and in patients with bulimia nervosa. Neurogastronetrol Motil 1998;10:3–10.
113.Hathaway DK, Abell T, Cardoso S, Heartwig MS, Gebely S, Gaber AO. Improvement in autonomic and gastric function following pancreas-kidney versus kidney-alone transplantation and the correlation with quality of life. Transplantation 1994;57:816.
114.Gaber AO, Hathaway DK, Abell T, Cardoso S, Heartwig MS, Gebely S. Improved autonomic and gastric function in pan- creas-kidney vs. kidney-alone transplantation contributes to quality of life. Transplant Proc 1994;26:515.
115.Cashion AK, Holmes SL, Hathaway DK, Gaber AO. Gastroparesis following kidney/pancreas transplant. Clin Transplant 2004;18:306–311.
116.Levanon D, Chen JDZ. Electrogastrography: its role in managing gastric disorders. (Invited Review). J Pediatr Gastroenterol Nutr 1998;27:431–443.
117.Chen JDZ, Co E, Liang J, Pan J, Sutphen J, Torres-Pinedo RB, Orr WC. Patterns of gastric myoelectrical activity in human subjects of different ages. Am J Physiol 1997;272: G1022–G1027.
118.Liang J, Co E, Zhang M, Pineda J, Chen JDZ. Development of gastric slow waves in preterm infants measured by electrogastrography. Am J Physiol (Gastrointest Liver Physiol) 1998;37:G503–G508.
119.Levy J, Harris J, Chen J, Sapoznikov D, Riley B, De La Nuez W, Khaskeberg A. Electrogastrographic norms in children: toward the development of standard methods, reproducible results, and reliable normative data. J Pediatr Gastroenterol Nutr 2001;33(4):455–461.
120.Cucchiara S, Riezzo G, Minella R, et al. Electrogastrography in non-ulcer dyspepsia. Arch Disease Childhood 1992;67(5): 613–617.
121.Ravelli AM, Ledermann SE, Bisset WM, Trompeter RS, Barratt TM, Milla PJ. Gastric antral myoelectrical activity in children wit chronic renal failure. In: Chen JDZ, McCallum RW, editors. Electrogastrography: Principles and Applications. New York: Raven Press; 1994. p 411– 418.
122.Devane SP, Ravelli AM, Bisset WM, Smith VV, Lake BD, Milla PJ. Gastric antral dysrhythmias in children wit chronic idiopathic intestinal pseudoobstruction. Gut 1992; 33:1477–1481.
123.Forster J, Damjanov I, Lin ZY, Sarosiek I, Wetzel P, McCallum RW. Absence of the interstitial cells of Cajal in patients with gastroparesis and correlation with clinical findings. J Gastrointest Sur 2005;9:102–108.
124.Lin ZY, Chen JDZ. Advances in electrical stimulation of the gastrointestinal tract. Crit Rev Biomed Eng 2002;30(4–6): 419–457.
125.Abell T, McCallum RW, Hocking M, Koch K, Abrahamssion H, LeBlang I, Lindberg G, Konturek J, Nowak T, Quigley EMM, Tougas G, Starkebaum W. Gastric electrical stimulation for medically refractory gastroparesis. Gastroenterology 2003;125:421–428.
126.Dickens EJ, Hirst GD, Tomita T. Identification of rhythmically active cells in guinespig stomach. J Physiol (London) 1999;514:515–531.
127.Ordog T, Ward SM, Sanders KM. Interstitial cells of Cajal generate slow waves in the murine stomach. J Physiol 1999; 518:257–269.
128.Hanani M, Freund HR. Interstitial cells of Cajal—their role in pacing and signal transmission in digestive system. Acta Physiol Scand 170;177–190.
129.Lin ZY, Sarosiek I, Forster J, McCallum RW. Association between baseline parameters of the electrogastrogram and long-term symptom improvement in gastroparetic patients treated with gastric electrical stimulation. Neurogastroenterol Motil 2003;15:345–346.
Reading List
Stern RM, Koch KL. Using electrogastrography to study motion sickness. In: Chen JDZ, McCallum RW, editors. Electrogastrography: Principles and Applications. New York: Raven Press; 1994. p 199–218.
See also GASTROINTESTINAL HEMORRHAGE; GRAPHIC RECORDERS.
ELECTROMAGNETIC FLOWMETER. See
FLOWMETERS, ELECTROMAGNETIC.
ELECTROMYOGRAPHY
CARLO DE LUCA
Boston University
Boston, Massachusetts
INTRODUCTION
Electromyography is the discipline that deals with the detection, analysis, and use of the electrical signal that emanates from contracting muscles.
This signal is referred to as the electromyographic (EMG) signal, a term that was more appropriate in the past than in the present. In days past, the only way to capture the signal for subsequent study was to obtain a ‘‘graphic’’ representation. Today, of course, it is possible to store the signal on magnetic tape, disks, and electronics components. Even more means will become available in the near future. This evolution has made the graphics aspect of the nomenclature a limited descriptor. Although a growing number of practitioners choose to use the term ‘‘myoelectric (ME) signal’’, the term ‘‘EMG’’ still commands dominant usage, especially in clinical environments.
An example of the EMG signal can be seen in Fig. 1. Here the signal begins with a low amplitude, which when expanded reveals the individual action potentials associated with the contractile activity of individual (or a small group) of muscle fibers. As the force output of the muscle contraction increases, more muscle fivers are activated and the firing rate of the fibers increases. Correspondingly, the amplitude of the signal increases taking on the appearance and characteristics of a Gaussian distributed variable.
Figure 1. The EMG signal recorded with surface electrodes located on the skin above the first dorsal interosseous muscle in the hand. The signal increases in amplitude as the force produced by the muscle increases.
The novice in this field may well ask, why study electromyography? Why bother understanding the EMG signal? There are many and varied reasons for doing so. Even a superficial acquaintance with the scientific literature will uncover various current applications in fields such as neurophysiology, kinesiology, motor control, psychology, rehabilitation medicine, and biomedical engineering. Although the state of the art provides a sound and rich complement of applications, it is the potential of future applications that generates genuine enthusiasm.
HISTORICAL PERSPECTIVE
Electromyography had its earliest roots in the custom practiced by the Greeks of using electric eels to ‘‘shock’’ ailments out of the body. The origin of the shock that accompanied this earliest detection and application of the EMG signal was not appreciated until 1666 when an Italian, Francesco Redi, realized that it originated from muscle tissue (1). This relationship was later proved by Luigi Galvani (2) in 1791 who staunchly defended the notion. During the ensuing six decades, a few investigators dabbled with this newly discovered phenomenon, but it remained for DuBois Reymond (3) in 1849 to prove that the EMG signal could be detected from human muscle during a voluntary contraction. This pivotal discovery remained untapped for eight decades awaiting the development of technological implements to exploit its prospects. This interval brought forth new instruments such as the cathode ray tube, vacuum tube amplifiers, metal electrodes, and the revolutionary needle electrode which provided means for conveniently detecting the EMG signal. This simple implement introduced by Adrian and Bronk (4) in 1929 fired the imagination of many clinical researchers who embraced electromyography as an essential resource for diagnostic procedures. Noteworthy among these was the contribution of Buchthal and his associates.
ELECTROMYOGRAPHY 99
Guided by the work of Inman et al. (5), in the mid-1940s to the mid-1950s several investigations revealed a monotonic relationship between the amplitude of the EMG signal and the force and velocity of a muscle contraction. This significant finding had a considerable impact: It dramatically popularized the use of electromyographic studies concerned with muscle function, motor control, and kinesiology. Kinesiological investigations received yet another impetus in the early 1960s with the introduction of wire electrodes. The properties of the wire electrode were diligently exploited by Basmajian and his associates during the next two decades.
In the early 1960s, another dramatic evolution occurred in the field: myoelectric control of externally powered prostheses. During this period, engineers from several countries developed externally powered upper limb prostheses that were made possible by the miniaturization of electronics components and the development of lighter, more compact batteries that could be carried by amputees. Noteworthy among the developments of externally powered prostheses was the work of the Yugoslavian engineer Tomovic and the Russian engineer Kobrinski, who in the late 1950s and early 1960s provided the first examples of such devices.
In the following decade, a formal theoretical basis for electromyography began to evolve. Up to this time, all knowledge in the field had evolved from empirical and often anecdotal observations. De Luca (6,7) described a mathematical model that explained many properties of the time domain parameters of the EMG signal, and Lindstrom
(8) described a mathematical model that explained many properties of the frequency domain parameters of the EMG signal. With the introduction of analytical and simulation techniques, new approaches to the processing of the EMG signal surfaced. Of particular importance was the work of Graupe and Cline (9), who employed the autoregressive moving average technique for extracting information from the signal.
The late 1970s and early 1980s saw the use of sophisticated computer algorithms and communication theory to decompose the EMG signal into the individual electrical activities of the muscle fibers (10–12). Today, the decomposition approach promises to revolutionize clinical electromyography and to provide a powerful tool for investigating the detailed control schemes used by the nervous system to produce muscle contractions. In the same vein, the use of a thin tungsten wire electrode for detecting the action potential from single fibers was popularized for clinical applications (13,14). Other techniques using the surface EMG signal, such as the use of median and mean frequencies of the EMG signal to describe the functional state of a muscle and the use of the conduction velocity of the EMG signal to provide information on the morphology of the muscle fibers began to take hold. For a review, see De Luca (15).
The 1990s saw the effective application of modern signal processing techniques for the analysis and use of the EMG signal. Some examples are the use of time and frequency analysis of the surface EMG signal for measuring the relative contribution of low back muscles during the presence and absence of low back pain (16); the use of
100 ELECTROMYOGRAPHY
CAUSATIVE
|
|
|
|
|
EXTRINISIC |
. |
|||
|
|
|
||
|
ELECTRODE: |
|||
|
-CONFIGURATION |
. |
||
|
-MOTOR POINT |
|||
|
. |
|||
|
-MUSCLE EDGE |
. |
||
|
-FIBER ORIENT. |
|||
|
-TENDON |
. |
||
|
INTRINSIC |
. |
||
|
|
|
||
|
NUMBER ACTIVE MU |
|||
|
MU FIRING RATE |
. |
||
|
(SYNCHRONIZATION) |
|||
|
MU FORCE TWITCH |
|||
|
FIBER TYPE |
|||
|
LACTIC ACID (pH) |
|||
|
BLOOD FLOW |
. |
||
|
FIBER DIAMETER |
. |
||
|
ELECTRODE |
. |
||
|
FIBER LOCATION |
|||
|
SUBCUTANEOUS |
. |
||
|
. |
|||
|
TISSUE |
|||
|
OTHER FACTORS |
|
|
|
|
FACTORS |
|
|
|
. |
EMG SIGNAL |
INTERPRETATION |
||
INTERMEDIATE |
. |
DETERMINISTIC |
|
|
|
|
|||
.DIFF. ELECTRODEFILTER |
|
ACTIVENUMBERMU |
|
|
|
|
|||
. |
DETECTION |
. |
|
MU FORCE |
. |
|
|
|
|
|
TWITCH |
|
|
|
|
||||
VOLUME |
|
MUSCLE FIBER |
. |
|
|
. |
MUSCLE |
||
. |
SUPERPOSITION . |
|
INTERACTIONS |
|
|
FORCE |
|||
|
MU FIRING |
. |
|
|
(FORCE-NET |
||||
|
|
|
RATE |
|
AMPLITUDE |
|
TORQUE) |
||
|
|
|
|
NUMBER |
|
|
|
|
|
. |
|
. |
. |
. |
. (RMS/ARV) . |
. ACTIVATIONMUSCLE |
|||
SIGNAL |
DETECTED MU |
||||||||
CROSSTALK |
|
. |
MUAP |
. |
|
|
|||
. CONDUCTION . |
AMPLITUDE |
|
|
|
(ON/OFF) |
||||
. |
MUAP |
. |
. |
|
. FATIGUEMUSCLE |
||||
|
VELOCITY |
|
DURATION |
SPECTRAL |
|||||
|
|
|
|
|
|
VARIABLES |
|
|
|
. SPATIAL |
. |
. |
MUAP |
. |
(MEDIAN . |
. |
|
||
|
/MEAN FREQ.) |
MUSCLE |
|||||||
|
SHAPE |
|
|
|
|||||
|
FILTERING |
|
|
RECRUITMENT . |
|
|
BIOCHEM. |
||
|
|
|
|
STABILITY |
|
|
|
|
|
|
|
|
|
|
|
|
|
|
CJ DeLuca |
Figure 2. Relationship among the various factors that affect the EMG signal. [Reproduced with Permission from C. J. De Luca, ‘‘The Use of Surface Electromyography in Biomechanics.’’ In the Journal of Applied Biomechanics, Vol. 13(No 2): p 139, Fig. 1.]
systematic measurements of the muscle fiber conduction velocity for measuring the severity of the Duchenne Dystrophy (17); the analysis of motor unit action potential delay for locating the origin, the ending and the innervation zone of muscle fibers (18); and the application of time–frequency analysis of the EMG signal to the field of laryngology (19).
New and exciting developments are on the horizon. For example, the use of large-scale multichannel detection of EMG signals for locating sources of muscle fiber abnormality (20); application of neural networks to provide greater degrees of freedom for the control of myoelectric prostheses (21), and for the analysis of EMG sensors data for assessing the motor activities and performance of sound subjects (22) and Stroke patients (23). Yet another interesting development is the emerging use of sophisticated Artificial Intelligence techniques for the decomposing the EMG signal (24). The reader who is interested in more historical and factual details is referred to the book Muscles Alive (25).
DESCRIPTION OF THE EMG SIGNAL
The EMG signal is the electrical manifestation of the neuromuscular activation associated with a contracting muscle. The signal represents the current generated by the ionic flow across the membrane of the muscle fibers that propagates through the intervening tissues to reach the detection surface of an electrode located in the environment. It is a complicated signal that is affected by the anatomical and physiological properties of muscles and the control scheme of the nervous system, as well as the characteristics of the instrumentation used to detect and observe it. Some of the complexity is presented in Fig. 2 that depicts a schematic diagram of the main physiological, anatomical and biochemical factors that affect the EMG signal. The connecting lines in the diagram show the interaction among three classes of factors that influence the EMG signal. The causative factors have a basic or elemental effect on the signal. The intermediate factors represent physical and physiological phenomena that are
influenced by one or more of the causative factors and in turn influence the deterministic factors that represent physical characteristics of the action potentials. For further details see De Luca (26).
In order to understand the EMG signal, it is necessary to appreciate some fundamental aspects of physiology. Muscle fibers are innervated in groups called motor units, which when activated generate a motor unit action potential. The activation from the central nervous system is repeated continuously for as long as the muscle is required to generate force. This continued activation generates motor unit action potential trains. These trains from the concurrently active motor units superimpose to form the EMG signal. As the excitation from the Central Nervous System increases to generate greater force in the muscle, a greater number of motor units are activated (or recruited) and the firing rates of all the active motor units increases.
Motor Unit Action Potential
The most fundamental functional unit of a muscle is called the motor unit. It consists of an a-motoneuron and all the muscle fibers that are innervated by the motoneuron’s axonal branches. The electrical signal that emanates from the activation of the muscle fibers of a motor unit that are in the detectable vicinity of an electrode is called the motor unit action potential (MUAP). This constitutes the fundamental unit of the EMG signal. A schematic representation of the genesis of a MUAP is presented in Fig. 3. Note the many factors that influence the shape of the MUAP. Some of these are (1) the relative geometrical relationship of the detection surfaces of the electrode and the muscles fibers of the motor unit in its vicinity; (2) the relative position of the detection surfaces to the innervation zone, that is, the region where the nerve branches contact the muscle fibers; (3) the size of the muscle fibers (because the amplitude of the individual action potential is proportional to the diameter of the fiber); and (4) the number of muscle fibers of an individual motor unit in the detectable vicinity of the electrode.
|
|
1 |
|
|
+ |
|
|
2 |
|
|
+ |
|
|
i |
|
Detection |
+ |
|
site |
|
|
|
|
|
|
n |
α Motoneuron |
= |
|
Muscle fiber |
h(t) |
|
|
|
|
Geometrical |
Tissue |
|
arrangement |
and |
|
of electrodes |
electrode |
Superposition |
and |
filter |
of |
active |
functions |
action |
fibers |
|
potentials |
Figure 3. Schematic representation of the generation of the motor unit action potential.
The last two factors have particular importance in clinical applications. Considerable work has been performed to identify morphological modifications of the MUAP shape resulting from modifications in the morphology of the muscle fibers (e.g., hypertrophy and atrophy) or the motor unit (e.g., loss of muscle fibers and regeneration of axons). Although usage of MUAP shape analysis is common practice among neurologists, interpretation of the results is not always straightforward and relies heavily on the experience and disposition of the observer.
Motor Unit Action Potential Train
The electrical manifestation of a MUAP is accompanied by a contractile twitch of the muscle fibers. To sustain a muscle contraction, the motor units must be activated repeatedly. The resulting sequence of MUAPs is called a motor unit action potential train (MUAPT). The waveform of the MUAPs within a MUAPT will remain constant if the geometric relationship between the electrode and the active muscle fibers remains constant, if the properties of the recording electrode do not change, and if there are no significant biochemical changes in the muscle tissue. Biochemical changes within the muscle can affect the conduction velocity of the muscle fiber and the filtering properties of the muscle tissue.
The MUAPT may be completely described by its interpulse intervals (the time between adjacent MUAPs) and the waveform of the MUAP. Mathematically, the interpulse intervals may be expressed as a sequence of Dirac delta impulses diðtÞ convoluted with a filter hðtÞ that represents the shape of the MUAP. Figure 4 presents a graphic representation of a model for the MUAPT. It follows that the MUAPT, uiðtÞ can be expressed as
Xn
uiðtÞ ¼ hiðt tkÞ
k¼1
ELECTROMYOGRAPHY 101
d (t − tk)
u(t)
h(t)
tk |
t |
Xt
P
FOURIER TRANSFORM
|
× |
= |
|
|
|
FREQUENCY |
FREQUENCY |
FREQUENCY |
Figure 4. Model for a motor unit action potential train (MUAPT) and the corresponding Fourier transform of the interpulse intervals (IPIs), the motor unit actions potentials (MUAP), and the MUAPT.
where
Xk
tk ¼ xl for k; l ¼ 1; 2; 3; . . . ; n
l¼1
In the above expression, tk represents the time locations of the MUAPs, x represents the interpulse intervals, n is the total number of interpulse intervals in a MUAPT, and i, k, and l are integers that denote specific events.
By representing the interpulse intervals as a renewal process and restricting the MUAP shape so that it is invariant throughout the train, it is possible to derive the approximations
Mean rectified value
¼ Efjuiðt; FÞjg liðt; FÞ Z0 |
1 jhiðtÞjdt |
|
Mean squared value |
||
¼ MSfjuiðt; FÞjg liðt; FÞ Z0 |
1 hi2ðtÞdt |
|
where F is the force generated by the muscle and is the firing rate of the motor unit.
The power density spectrum of a MUAPT was derived from the above formulation by LeFever and De Luca [(27) and independently by Lago and Jones (28)]. It can be expressed as
Sui ðv; t; FÞ ¼ Sdi ðv; t; FÞjHið jvÞj2
¼liðt;FÞ f1 jMð jv;t;FÞj2g |
fjHiðjvÞj |
2 |
g |
1 2 RealfMðjv;t;FÞgþjMð jv;t;FÞj2 |
|
for 6¼0
where is the frequency in radians per second, Hið jvÞ is the Fourier transform of hiðtÞ, and Mð jv; t; FÞ is the Fourier transform of the probability distribution function, pxðx; t; FÞ of the interpulse intervals.
102 ELECTROMYOGRAPHY
Figure 5. An EMG signal formed by adding (superimposing) 25 mathematically generated MUAPTs.
The EMG Signal
The EMG signal may be synthesized by linearly summing the MUAPTs. This approach is expressed in the equation
Xp
mðt; FÞ ¼ uiðt; FÞ
i¼1
and is displayed in Fig. 5, where 25 mathematically generated MUAPTs were added to yield the signal at the bottom. This composite signal bears striking similarity to the real EMG signal.
From this concept, it is possible to derive expressions for commonly used parameters: mean rectified value, root- mean-squared (rms) value, and variance of the rectified EMG signal. The interested reader is referred to Muscles Alive (25).
Continuing with the evolution of the model, it is possible to derive an expression for the power density spectrum of the EMG signal:
Smðv; t; FÞ ¼ Rðv; dÞ2pðFÞ |
Sui |
ðv; tÞ þ qðFÞ |
Sui ujðv; tÞ3 |
|||
6 |
X |
|
X |
7 |
||
|
|
|
|
6¼ |
||
4 |
i |
¼ |
1 |
|
i j |
5 |
|
|
|
i; j¼1 |
|
||
where Rðv; dÞ ¼ K sin2ðvd=2yÞ is the bipolar electrode filter function; d is the distance between detection surfaces of the electrode; is the angular frequency; y is the conduction velocity along the muscle fibers; Sui ðvÞ is the power density of the MUAPT, uiðtÞ; Suiuj ðvÞ is the cross-power density spectrum MUAPTs uiðtÞ and ujðtÞ; p is the total number of MUAPTs that constitute the signal; and q is the number of MUAPTs with correlated discharges.
Lindstrom (8), using a dipole model, arrived at another expression for the power density spectrum:
h i
Smðv; t; FÞ ¼ Rðv; dÞ 1y2ðt; FÞGðvd2yðt; FÞÞ
This representation explicitly denotes the interconnection between the spectrum of the EMG signal and the conduction velocity of the muscle fibers. Such a relationship is implicit in the previously presented modeling approach because any change in the conduction velocity would directly manifest itself in a change in the time duration
of h(t) as seen by the two detection surfaces of a stationary bipolar electrode.
ELECTRODES
Two main types of electrodes are used to detect the EMG signal: one is the surface (or skin) electrode and the other is the inserted (wire or needle) electrode. Electrodes are typically used singularly or in pairs. These configurations are referred to as monopolar and bipolar, respectively.
Surface Electrodes
There are two categories of surface electrode: passive and active. Passive electrode consists of conductive (usually metal) detection surface that senses the current on the skin through its skin electrode interface. Active electrodes contain a high input impedance electronics amplifier in the same housing as the detection surfaces. This arrangement renders it less sensitive to the impedance (and therefore quality) of the electrode–skin interface. The current trend is towards active electrodes.
The simplest form of passive electrode consists of silver disks that adhere to the skin. Electrical contact is greatly improved by introducing a conductive gel or paste between the electrode and skin. The impedance can be further reduced by removing the dead surface layer of the skin along with its protective oils; this is best done by light abrasion of the skin.
The lack of chemical equilibrium at the metal electrolyte junction sets up a polarization potential that may vary with temperature fluctuations, sweat accumulation, changes in electrolyte concentration of the paste or gel, relative movement of the metal and skin, as well as the amount of current flowing into the electrode. It is important to note that the polarization potential has both a direct current (dc) and an alternating current (ac) component. The ac component is greatly reduced by providing a reversible chloride exchange interface with the metal of the electrode. Such an arrangement is found in the silver–silver chloride electrodes. This type of electrode has become highly popular in electromyography because of its light mass (0.25 g), small size (< 10 mm diameter), and high reliability and durability. The dc component of the polarization potential is nullified by ac amplification when the electrodes are used in pairs. This point is elaborated upon in later sections of this article.
The active surface electrodes have been developed to eliminate the need for skin preparation and conducting medium. They are often referred to as ‘‘dry’’ or ‘‘pasteless’’ electrodes. These electrodes may be either resistively or capacitively coupled to the skin. Although the capacitively coupled electrodes have the advantage of not requiring a conductive medium, they have a higher inherent noise level. Also, these electrodes do not have long term reliability because their dielectric properties are susceptible to change with the presence of perspiration and the erosion of the dielectric substance. For these reasons, they have not yet found a place in electromyography.
An adequately large input impedance is achieved when resistance is on the order of 10 TV and capacitance is small
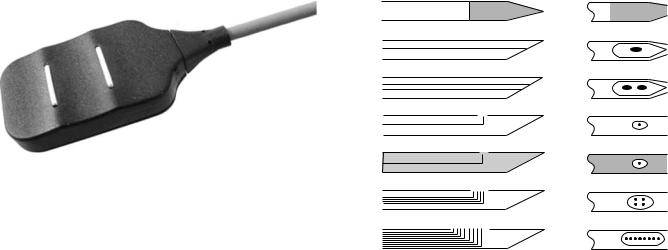
Figure 6. Examples of active surface electrode in bipolar configurations from Delsys Inc. The spacing between the bars is 10 mm, the length of the bars is 10 mm and the thickness is 1 mm. These electrodes do not require any skin preparation or conductive paste or gels.
(typically, 3 or 4 pF). The advent of modern microelectronics has made possible the construction of amplifiers housed in integrated circuitry which have the required input impedance and associated necessary characteristics. An example of such an electrode is presented in Fig. 6. This genre of electrodes was conceptualized and first constructed at the NeuroMuscular Research Laboratory at Children’s Hospital Medical Center, Boston, MA in the late 1970s. They each have two detection surfaces and associated electronic circuitry within their housing.
The chief disadvantages of surface electrodes are that they can be used effectively only with superficial muscles and that they cannot be used to detect signals selectively from small muscles. In the latter case, the detection of ‘‘cross-talk’’ signals from other adjacent muscles becomes a concern. These limitations are often outweighed by their advantages in the following circumstances:
1. When representation of the EMG signal corresponding to a substantial part of the muscle is required.
2. In motor behavior studies, when the time of activation and the magnitude of the signal contain the required information.
3. In psychophysiological studies of general gross relaxation of tenseness, such as in biofeedback research and therapy.
4. In the detection of EMG signals for the purpose of controlling external devices such as myoelectrically controlled prostheses and other like aids for the physically disabled population.
5. In clinical environments, where a relatively simple assessment of the muscle involvement is required, for example, in physical therapy evaluations and sports medicine evaluations.
6. Where the simultaneous activity or interplay of activity is being studied in a fairly large group of muscles under conditions where palpation is impractical, for example, in the muscles of the lower limb during walking.
7. In studies of children or other individuals who object to needle insertions.
ELECTROMYOGRAPHY 103
a
b
c
d
e
f
g
Figure 7. Examples of various needle electrodes: (a) A solid tip single-fiber electrode. If it is sufficiently thin, it can be inserted into a nerve bundle and detect neuroelectrical signals. (b) Concentric needle with one monopolar detection surface formed by the beveled cross-section of centrally located wire typically 200 mm in diameter. Commonly used in clinical practice. (c) Bipolar needle electrode with two wires exposed in cross-section, typically 100 mm in diameter. Used in clinical practice. (d) Single-fiber electrode with 25 mm diameter wire. Used to detect the activity of individual muscle fibers. (e) Macroelectrode with 25 mm diameter wire and with the cannula of the needle used as a detection surface. Used to detect the motor unit action potential from a large portion of the motor unit territory. (f) Quadrifilar planar electrode with four 50 mm wires located on the corners of a square 150 mm apart (center to center). Used for multiple channel recordings and in EMG signal decomposition technique. (g) Multifilar electrode consisting of a row of wires, generally used to study the motor unit territory.
Needle Electrodes
By far, the most common indwelling electrode is the needle electrode. A wide variety is commercially available. (see Fig. 7). The most common needle electrode is the ‘‘concentric’’ electrode used by clinicians. This monopolar configuration contains one insulated wire in the cannula. The tip of the wire is bare and acts as a detection surface. The bipolar configuration contains a second wire in the cannula and provides a second detection surface. The needle electrode has two main advantages. One is that its relatively small pickup area enables the electrode to detect individual MUAPs during relatively low force contractions. The other is that the electrodes may be conveniently repositioned within the muscle (after insertion) so that new tissue territories may be explored or the signal quality may be improved. These amenities have naturally led to the development of various specialized versions such as the multifilar electrode developed by Buchthal et al. (29), the planar quadrifilar electrode of De Luca and Forrest (30), the single fiber electrode of Ekstedt and Sta˚lberg (13), and the macroelectrode of Sta˚lberg (14). The single-fiber electrode consists of a thin, stiff, sharpened metal filament, usually made of tungsten. When inserted into a muscle it detects the action potentials of individual fibers. This electrode has
104 ELECTROMYOGRAPHY
proven to be useful for neurological examinations of deinnervated muscles. Examples of these electrodes may be seen in Fig. 7.
Wire Electrodes
Since the early 1960s, this type of electrode has been popularized by Basmajian and Stecko (31). Similar electrodes that differ only in minor details of construction were developed independently at about the same time by other researchers. Wire electrodes have proved a boon to kinesiological studies because they are extremely fine, they are easily implanted and withdrawn from skeletal muscles, and they are generally less painful than needle electrodes whose cannula remains inserted in the muscle throughout the duration of the test.
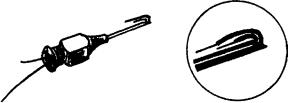
Wire electrodes may be made from any small diameter, highly nonoxidizing, stiff wire with insulation. Alloys of platinum, silver, nickel, and chromium are typically used. Insulations, such as nylon, polyurethane, and Teflon, are conveniently available. The preferable alloy is 90% platinum, 10% iridium; it offers the appropriate combination of chemical inertness, mechanical strength, stiffness and economy. The Teflon and nylon insulations are preferred because they add some mechanical rigidity to the wires, making them easier to handle. The electrode is constructed by inserting two insulated fine (25–100 mm in diameter) wires through the cannula of a hypodermic needle. Approximately 1–2 mm of the distal tips of the wire is deinsulated and bent to form two staggered hooks (see Fig. 8 for completed version). The electrode is introduced into the muscle by inserting the hypodermic needle and then withdrawing it. The wires remain lodged in the muscle tissues. They may be removed by gently pulling them out: They are so pliable that the hooks straighten out on retraction.
In kinesiological studies, where the main purpose of using wire electrodes is to record a signal that is proportional to the contraction level of muscle, repositioning of the electrode is not important. But for other applications, such as recording distinguishable MUAPTs, this limitation is counterproductive. Some have used the phrase ‘‘poke and hope’’ to describe the standard wire electrode technique for this particular application. Another limitation of the wire electrode is its tendency to migrate after it has been inserted, especially during the first few contractions of the muscle. The migration usually stops after a few contractions. Consequently, it is recommended to perform a half dozen or so short duration contraction before the actual recording session begins.
Figure 8. A bipolar wire electrode with its carrier needle used for insertion.
Electrode Maintenance
Proper usage of wire and needle electrodes requires constant surveillance of the physical and electrical characteristics of the electrode detection surfaces. Particular attention should be given to keeping the tips free of debris and oxidation. The reader is referred to the book Muscles Alive (25) for details on these procedures as well as suggestions for sterilization.
How to Choose the Proper Electrode
The specific type of electrode chosen to detect the EMG signal depends on the particular application and the convenience of use. The application refers to the information that is expected to be obtained from the signal; for example, obtaining individual MUAPs or the gross EMG signal reflecting the activity of many muscle fibers. The convenience aspect refers to the time and effort the investigator wishes to devote to the disposition of the subject or patient. Children, for example, are generally resistant to having needles inserted in their muscles.
The following electrode usage is recommended. The reader, however, should keep in the mind that crossover applications are always possible for specific circumstances.
Surface Electrodes
Time force relationship of EMG signals. Kinesiological studies of surface muscles. Neurophysiological studies of surface muscles. Psychophysiological studies.
Interfacing an individual with external electromechanical devices.
Needle Electrode
MUAP characteristics.
Control properties of motor units (firing rate, recruitment, etc.).
Exploratory clinical electromyography.
Wire Electrodes
Kinesiological studies of deep muscles. Neurophysiological studies of deep muscles. Limited studies of motor unit properties.
Comfortable recording procedure from deep muscles.
Where to Locate the Electrode
The location of the electrode should be determined by three important considerations: (1) signal/noise ratio, (2) signal stability (reliability), and (3) cross-talk from adjacent muscles. The stability consideration addresses the issue of the modulation of the signal amplitude due to relative movement of the active fibers with respect to the detection surfaces of the electrode. The issue of cross-talk concerns the detection by the electrode of signals emanating from adjacent muscles.
For most configurations of needle electrodes, the question of cross-talk is of minor concern because the electrode
is so selective that it detects only signals from nearby muscle fibers. Because the muscle fibers of different motor units are scattered in a semirandom fashion throughout the muscle, the location of the electrode becomes irrelevant from the point of view of signal quality and information content. The stability of the signal will not necessarily be improved in any one location. Nonetheless, it is wise to steer clear of the innervation zone so as to reduce the probability of irritating a nerve ending.
All the considerations that have been discussed for needle electrodes also apply to wire electrodes. In this case, any complication will be unforgiving in that the electrode may not be relocated. Since the wire electrodes have a larger pickup area, a concern arises with respect to how the location of the insertion affects the stability of the signal. This question is even more dramatic in the case of surface electrodes.
For surface electrodes, the issue of cross-talk must be considered. Obviously, it is not wise to optimize the signal detected, only to have the detected signal unacceptably contaminated by an unwanted source. A second consideration concerns the susceptibility of the signal to the architecture of the muscle. Both the innervation zone and the tendon muscle tissue interface have been found to alter the characteristics of the signal. It is suggested that the preferred location of an electrode is in the region halfway between the center of the innervation zone and the further tendon. See the review article by De Luca (12) for additional details.
SIGNAL DETECTION: PRACTICAL CONSIDERATIONS
When attempting to collect an EMG signal, both the novice and the expert should remember that the characteristics of the observed EMG signal are a function of the apparatus used to acquire the signal as well as the electrical current that is generated by the membrane of the muscle fibers. The ‘‘distortion’’ of the signal as it progresses from the source to the electrode may be viewed as a filtering sequence. An overview of the major filtering effects is presented in Fig. 9. A brief summary of the pertinent facts follows. The reader interested in additional details is referred to Muscles Alive (25).
Tissue(s) |
Electrode- |
|
|
|
Bipolar |
|
|
||||
electrolyte |
|
|
|
electrode |
|
|
|||||
(low pass filter) |
|
|
|
|
|
|
|
|
|||
(anisotropy) |
interface |
|
|
|
configuration |
|
|
||||
(high pass filter) |
|
|
|
(bandpass filter) |
|
|
|||||
|
|
|
|
|
|
|
|
|
|
||
|
|
|
|
|
|
|
|
|
|
|
|
Physiological |
|
|
|
|
|
|
|
||||
EMG signal |
|
|
|
|
|
|
|
||||
Observable |
|
|
|
|
|
|
|
||||
Recorder |
|
|
|
Amplifier |
|
|
|||||
EMG signal |
|
|
(bandpass filter) |
|
|
|
(bandpass filter) |
|
|
||
|
|
|
|
|
|
|
|
|
|
|
|
Figure 9. Block diagram of all the major aspects of the signal acquisition procedure. Note the variety of physical properties that act as filters to the EMG signal before it can be observed. The term ‘‘physiological EMG signal’’ refers to the collection of signals that emanate from the surface of the muscle fibers. These are not observable.
ELECTROMYOGRAPHY 105
Electrode Configuration
The electrical activity inside a muscle or on the surface of the skin outside a muscle may be easily acquired by placing an electrode with only one detection surface in either environment and detecting the electrical potential at this point with respect to a ‘‘reference’’ electrode located in an environment that either is electrically quiet or contains electrical signals unrelated to those being detected. (‘‘Unrelated’’ means that the two signals have minimal physiological and anatomical associations.) A surface electrode is commonly used as the reference electrode. Such an arrangement is called monopolar and is at times used in clinical environments because of its relative technical simplicity. A schematic arrangement of the monopolar detection configuration may be seen in Fig. 10. The monopolar configuration has the drawback that it will detect all the electrical signals in the vicinity of the detection surface; this includes unwanted signals from sources other than the muscle of interest.
The bipolar detection configuration overcomes this limitation (see Fig. 10). In this case, two surfaces are used to detect two potentials in the muscle tissue of interest each with respect to the reference electrode. The two signals are then fed to a differential amplifier which amplifies the
|
Amp. |
EMG Sig. |
|
Detection |
|
Reference |
|
electrode |
|
electrode |
|
m + n |
|
Electrically |
|
|
unrelated |
||
Muscle |
|
||
|
tissue |
||
|
|
||
|
(a) |
|
|
|
+ |
|
|
|
Diff. |
EMG Sig. |
|
|
amp. |
||
|
|
||
Detection |
|
Reference |
|
electrode |
|
electrode |
|
m1 + n |
m2 + n |
Electrically |
|
unrelated |
|||
Muscle |
|
||
|
tissue |
(b)
Figure 10. (a) Monopolar detection arrangement. (b) Bipolar detection arrangement. Note that in the bipolar detection arrangement, the EMG signals are considered to be different, whereas the noise is similar.
106 ELECTROMYOGRAPHY
difference of the two signals, thus eliminating any ‘‘common mode’’ components in the two signals. Signals emanating from the muscle tissue of interest near the detection surface will be dissimilar at each detection surface because of the localized electrochemical events occurring in the contracting muscle fibers, whereas ‘‘ac noise’’ signals originating from a more distant source (e.g., 50 or 60 Hz electromagnetic signals radiating from power cords, outlets, and electrical devices) and ‘‘dc noise’’ signals (e.g., polarization potentials in the metal electrolyte junction) will be detected with an essentially similar amplitude at both detection surfaces. Therefore, they will be subtracted, but not necessarily nullified prior to being amplified. The measure bf the ability of the differential amplifier to eliminate the common mode signal is called the common mode rejection ratio.
Spatial Filtering
1. As the signal propagates through the tissues, the amplitude decreases as a function of distance. The amplitude of the EMG signal decreases to approximately 25% within 100 mm. Thus, an indwelling electrode will detect only signals from nearby muscle fibers.
2. The filtering characteristic of the muscle tissues is a function of the distance between the active muscle fibers and the detection surface(s) of the electrode. In the case of surface electrodes, the thickness of the fatty and skin tissues must also be considered. The tissues behaves as a low pass filter whose bandwidth and gain decrease as the distance increases.
3. The muscle tissue is anisotropic. Therefore, the orientation of the detection surfaces of the electrode with respect to the length of the muscle fibers is critical.
Electrode Electrolyte Interface
1. The contact layer between the metallic detection surface of the electrode and the conductive tissue forms an electrochemical junction that behaves as a high pass filter.
2. The gain and bandwidth will be a function of the area of the detection surfaces and any chemical electrical alteration of the junction.
Bipolar Electrode Configuration
1. This configuration ideally behaves as a bandpass filter; however, this is true only if the inputs to the amplifier are balanced and the filtering aspects of the electrode electrolyte junctions are equivalent.
2. A larger interdetection surface spacing will render a lower bandwidth. This aspect is particularly significant for surface electrodes.
3. The greater the interdetection surface spacing, the greater the susceptibility of the electrode to detecting measurable amplitudes of EMG signals from adjacent and deep muscles. Again, this aspect is particularly significant for surface electrodes.
4. An interdetection surface spacing of 1.0 cm is recommended for surface electrodes.
Amplifier Characteristics
1. These should be designed and/or set for values that will minimally distort the EMG signal detected by the electrodes.
2. The leads to the input of the amplifier (actually, the first stage of the amplification) should be as short as possible and should not be susceptible to movement. This may be accomplished by building the first stage of the amplifier (the preamplifier) in a small configuration which should be located near (within 10 cm) the electrode. For surface EMG amplifiers the first stage is often located in the housing of the electrodes.
3. The following are typical specifications that can be attained by modern day electronics. It is worth noting that the values below will improve as more advanced electronics components become available in the future.
(a)Common-mode input impedance: As large as possible (typically > 1015 V in parallel with < 7 pF).
(b)Common mode rejection ratio: > 85 dB.
(c)Input bias current: as low as possible (typically < 5 fA).
(d)Noise (shorted inputs) < 1.5 mV rms for 20–500 Hz bandwidth.
(e)Bandwidth in hertz (3 dB points for 12 dB/octave or more rolloff):
Surface electrodes |
20–500 |
Wire electrodes |
20–2,000 |
Monopolar and bipolar |
20–5,000 |
needle electrodes for general use |
|
Needle electrodes for signal |
1,000–10,000 |
decomposition |
|
Single fiber electrode |
1,000–10,000 |
Macroelectrode |
20–5,000 |
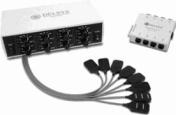
An example of an eight-channel modern surface EMG amplifier is presented in Fig. 11. Such systems are
Figure 11. An eight-channel surface EMG system from Delsys Inc. The dimensions of this device (205 108 57 mm) are typical for current day units. Note that the active electrodes connect to an input unit that is separate from the body of the amplifier and can be conveniently attached to the body of the subject.

available in configurations of various channels up to 32, but 8 and 16 channel versions are most common.
Recording Characteristics
The effective or actual bandwidth of the device or algorithm that is used to record or store the signal must be greater than that of the amplifiers.
Other Considerations
1. It is preferable to have the subject, the electrode, and the recording equipment in an electromagnetically quiet environment. If all the procedures and cautions discussed in this article are followed and heeded, high quality recordings will be obtained in the electromagnetic environments found in most institutions, including hospitals.
2. In the use of indwelling electrodes, great caution should be taken to minimize (eliminate, if possible) any relative movement between the detection surfaces of the electrodes and the muscle fibers. Relative movements of 0.1 mm may dramatically alter the characteristics of the detected EMG signal and may possibly cause the electrode to detect a different motor unit population.
SIGNAL ANALYSIS TECHNIQUES
The EMG signal is a time and force (and possibly other parameters) dependent signal whose amplitude varies in a random nature above and below the zero value. Thus, simple average aging of the signal will not provide any useful information.
Rectification
A simple method that is commonly used to overcome the above restriction is to rectify the signal before performing mode pertinent analysis. The process of rectification involves the concept of rendering only positive deflections of the signal. This may be accomplished either by eliminating the negative values (half-wave rectification) or by inverting the negative values (full-wave rectification). The latter is the preferred procedure because it retains all the energy of the signal.
Averages or Means of Rectified Signals
The equivalent operation to smoothing in a digital sense is averaging. By taking the average of randomly varying values of a signal, the larger fluctuations are removed, thus achieving the same results as the analog smoothing operation. The mathematical expression for the average or mean of the rectified EMG signal is
Z tj
jmðtÞjtj ti ¼ 1tj ti jmðtÞjdt
ti
where ti and tj are the points in time over which the integration and, hence, the averaging is performed. The shorter the time interval, the less smooth the averaged value will be.
ELECTROMYOGRAPHY 107
The preceding expression will provide only one value over the time window T ¼ tj ti. To obtain the time varying average of a complete record of a signal, it is necessary to move the time window T duration along the record. This operation is referred to as moving average.
Z tþT
jmðtÞj ¼ 1T |
jmðtÞjdt |
t
Like the equivalent operation in the analogue sense, this operation introduces a lag; that is, T time must pass before the value of the average of the T time interval can be obtained. In most cases, this outcome does not present a serious restriction, especially if the value of T is chosen wisely. For typical applications, values ranging from 100 to 200 ms are suggested. It should be noted that shorter time windows, T, yield less smooth time dependent average (mean) of the rectified signal.
Integration
The most commonly used and abused data reduction procedure in electromyography is integration. The literature of the past three decades is swamped with improper usage of this term, although happily within the past decade it is possible to find increasing numbers of proper usage. When applied to a procedure for processing a signal, the temp integration has a well-defined meaning that is expressed in a mathematical sense. It applies to a calculation that obtains the area under a signal or a curve. The units of this parameter are volt seconds (V s). It is apparent that an observed EMG signal with an average value of zero will also have a total area (integrated value) of zero. Therefore, the concept of integration may be applied only to the rectified value of the EMG signal.
Z tþT
IfjmðtÞjg ¼ |
jmðtÞjdt |
t
Note that the operation is a subset of the procedure of obtaining the average rectified value. Since the rectified value is always positive, the integrated rectified value will increase continuously as a function of time. The only difference between the integrated rectified value and the average rectified value is that in the latter case the value is divided by T, the time over which the average is calculated. If a sufficiently long integration time T is chosen, the integrated rectified value will provide a smoothly varying measure of the signal as a function of time. There is no additional information in the integrated rectified value.
Root-Mean-Square (rms) Value
Mathematical derivations of the time and force dependent parameters indicate that the rms value provides more a more rigorous measure of the information content of the signal because it measures the energy of the signal. Its use in electromyography, however, has been sparse in the past. The recent increase is due possibly to the availability of analog chips that perform the rms operation and to the increased technical competence in electromyography. The time-varying rms value is obtained by performing the
108 ELECTROMYOGRAPHY
operations described by the term in reverse order; that is,
|
Z |
rms fmðtÞg ¼ 1T |
t tþT m2ðtÞdt!1=2 |
This parameter is recommended above the others.
Zero Crossings and Turns Counting
This method consists of counting the number of times per unit time that the amplitude of the signal contains either a peak or crosses a zero value of the signal. It was popularized in electromyography by Williston (32). The relative ease with which these measurements could be obtained quickly made this technique popular among clinicians. Extensive clinical applications have been reported, some indicating that discrimination may be made between myopathic and normal muscle; however, such distinctions are usually drawn on a statistical basis.
This technique is not recommended for measuring the behavior of the signal as a function of force (when recruitment or derecruitment of motor units occurs) or as a function of time during a sustained contraction. Lindstro¨m et al. (33) showed that the relationship between the turns or zeros and the number of MUAPTs is linear for low level contractions. But as the contraction level increases, the additionally recruited motor units contribute MUAPTs to the EMG signal. When the signal amplitude attains the character of Gaussian random noise, the linear proportionality no longer holds.
Frequency Domain Analysis
Analysis of the EMG signal in the frequency domain involves measurements and parameters that describe specific aspects of the frequency spectrum of the signal. Fast Fourier transform techniques are commonly available and are convenient for obtaining the power density spectrum of the signal.
Three parameters of the power density spectrum may be conveniently used to provide useful measures of the spectrum. They are the median frequency, the mean frequency, and the bandwidth of the spectrum. Other parameters, such as the mode frequency and ratios of segments of the power density spectrum, have been used by some investigators, but are not considered reliable measures given the inevitably noisy nature of the spectrum. The median frequency and the mean frequency are defined by the equations:
fmed |
1 |
Z0 |
Smð f Þdf ¼ Zfmed Smð f Þdf |
fmean ¼ |
Z0f fSmð f Þdf Z0f Smð f Þdf |
where Smð f Þ is the power density spectrum of the EMG signal. Stulen and De Luca (34) performed a mathematical analysis to investigate the restrictions in estimating various parameters of the power density spectrum. The median and mean frequency parameters were found to be the most reliable, and of these two the median frequency was found to be less sensitive to noise. This quality is particu-
larly useful when a signal is obtained during low level contractions where the signal to-noise ratio may be < 6.
The above discussion on frequency spectrum parameters removes temporal information from the calculated parameters. This approach is appropriate for analyzing signals that are stationary or nearly stationary, such as those emanating from isometric, constant-force contractions. Measurement of frequency parameters during dynamic contractions requires techniques that retain the temporal information. During the past decade time–frequency analyses techniques have evolved in the field of Electromyography, as they have in the realm of other biosignals such as ECG and EEG. Early among the researchers to apply these techniques to the EMG signal were Contable et al. (35) who investigated the change in the frequency content of EMG signals during high jumps, and Roark et al. (19) who investigated the movement of the thyroarytenoid muscles during vocalization. In both these applications, the time–frequency techniques were essential because they investigated muscles that contracted dynamically and briefly.
Much of the work presented here is adapted, with permission, from Refs. 25, pp. 38, 58, 68, 74, and 81. The author thanks Williams & Wilkens for permission to extract this material.
BIBLIOGRAPHY
Cited References
1.Biederman W. Electrophysiology. 1898.
2.Galvani L. De Viribus Electricitatis. (R. Green, Transl.) London and New York: Cambridge University Press; 1953.
3.Du Bois RE. Untersuchungen uber theirische electricita¨t. 2, 2nd P. Berlin: Verlag von G. Reimer; 1849.
4.Adrian ED, Bronk DW. J Physiol (London) 1929;67:19.
5.Inman VT, Sauders JBCM, Abbott LC J. Bone Jt Surg 1944;26:1.
6.De Luca CJ. MS [dissertation]. University of New Brunswick; 1968.
7.De Luca CJ. Biol Cybernet 1975;19:159.
8.Lindstrom LR. On the Frequency Spectrum of EMG Signals. Technical Report, Research Laboratory of Medical Electronics. Gothenburg, Sweden: Chalmers University of Technology; 1970.
9.Graupe D, Cline WK. IEEE Trans Syst Man Cybernet SMC 1975;5:252.
10.LeFever RS, De Luca CJ. Proceedings of the 8th Annual Meeting of Social Neuroscience; 1985. p 299.
11.LeFever RS, De Luca CJ. IEEE Trans Biomed Eng BME 1982;29:149.
12.McGill KC, Cummins KL, Dorfman LJ. IEEE Trans Biomed Eng 1985;32:470–477.
13.Ekstedt J, Sta˚lberg E. In: Desmedt JE, editor. New Development EMG Clinical Neurophysiology 1. S. Karger; 1973. p 84.
14.Sta˚lberg EJ. Neurol Neurosurg Psychiat 1980;43:475.
15.De Luca CJ. CRC Crit Rev Biomed Eng 1984;11:251–279.
16.Roy SH, De Luca CJ, Emley MC. J Rehab Res Dev 1997;34(4): 405–414.
17.Knaflitz M, Balestra G, Angelini C, Cadaldini M. Basic App Myol 1996;6(2):70,115.
18.Masuda T, Miyano H, Sadoyama T. EEG Clin Neurophysiol 1983;55(5):594–600.
19.Roark RM, Dowling EM, DeGroat RD, Watson BC, Schaefer SD. J Speech Hear Res 1995;38(2):289–303.