

GIS For Dummies
.pdfChapter 11: Searching for Geographic Objects, Distributions, and Groups 171
The GUI approach usually asks you to search categories by using a series of logical or mathematical operators. You use the GUI to find the categories you’re interested in, and the search creates a whole new map for you.
Figure 11-4:
Changing the nominal categories of land use displayed on
the map.
Get to know your GUI search tool as soon as possible — you’ll use it often in your GIS work. Start with simple searches, and when you get comfortable with it, move to more complex searches. Have fun with it!
Finding polygons based on level
Many polygons come in ordinal (ranked) categories. The user might have created those categories for a particular use in which the scale is context-depen- dent (scalar), or another user might use more universally understood categories, such as predefined values for high, medium, and low housing densities.
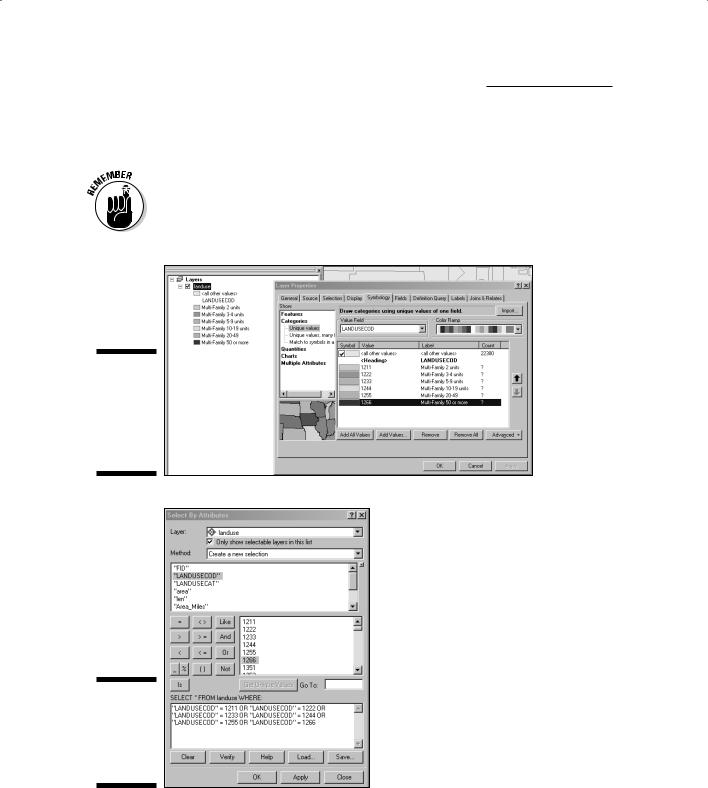
In a land-use map like the one shown in Figure 11-3, you can select Residential as a single category based on nominal data. But suppose that you want to be more specific. The map data might offer the residential land uses not just as a single category, but also at different levels based on the number or type of housing units. Figure 11-5 shows the map legend with a breakdown of residential land use in levels of multi-family units.
You might want to buy a home in a low-density residential neighborhood (one that doesn’t have many multi-family units). By selecting a polygon that represents low density levels from among all the other housing polygons, you can determine which parts of town would suit your living needs. Figure 11-6
172 Part III: Retrieving, Counting, and Characterizing Geography
shows how you can use a built-in GUI search function to select the levels of housing density from within the GIS database and create a new map from these more specific categories.
Searching for different attributes within a map legend doesn’t create a new layer. Most often, searching for attributes allows you to quickly change the display, but that’s about it. If you want to save and use the resulting map, you must use the GUI.
Figure 11-5:
Displaying land-use polygons based on ordinal categories.
Figure 11-6:
Selecting ordinal categories using landuse codes.
Chapter 11: Searching for Geographic Objects, Distributions, and Groups 173
Looking for polygons based on value
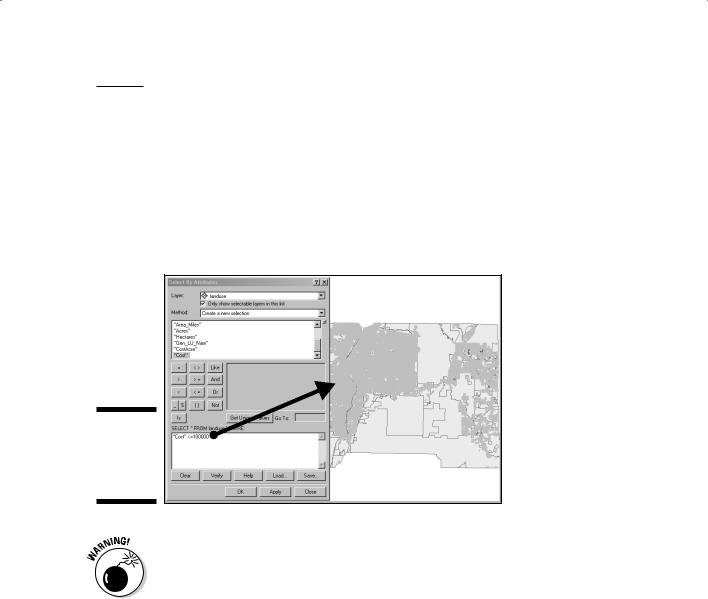
Suppose that, looking at a land-use map, you have a layer that shows the value of the land in dollars per acre. Such ratio-scale data are easy to separate from one another because they are numeric values. If you want to buy land that’s priced at $100,000 or less per acre, for example, you need only select all land parcels whose attributes match the value less than or equal to $100,000 (see Figure 11-7).
Figure 11-7:
Selecting polygons based on value.
Maps can trick you. Before you search for polygons based on value, be sure that you’re searching for the correct unit value. If you’re looking for land based on price, for example, you’re probably looking for price per unit area, not total price. If your map shows total price, you need to do some math to figure out the price per unit area.
Locating polygons based on size, shape, and orientation
Polygons come in different sizes and shapes. Asymmetrical polygons are aligned in a particular direction (north, south, east, west, northeast, southwest, or some other combination). You can find polygonal features based on their size, shape, and alignment, but some preparation must take place first. Don’t worry — the GIS software does the prep work. You just have to find and use its tools to do your search.
If you’re buying land, you need to know more than just how much it costs.
You also need to know how big it is. After all, if you can get land for less than
174 Part III: Retrieving, Counting, and Characterizing Geography
$100,000 per acre but you need 5 acres, you must specify the amount of land (the size of the parcel) in your search. The good news is that both raster and vector GIS calculate the size of the polygons when you input those polygons into the database.
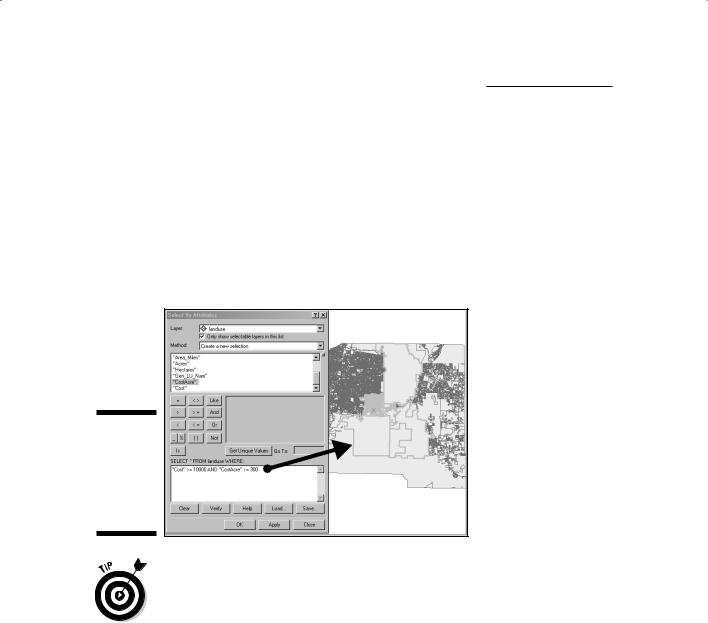
So, the software does the first part you need — determining the polygons’ sizes — for you. You can go into the software and find the polygons based on some set criteria that you define, such as >5 Acre. In fact, you can combine the >5 Acre search with the <=$100,000 per Acre search to find just the set of lots that you might want to buy. The results of a combined search look something like the map in Figure 11-8.
Figure 11-8:
Locating polygons based on size and price per
acre.
With GIS, you can use the many maps that you create to create even more maps, narrowing your search while you go. These steps show an example of how this narrowing-down process works:
1.Use your GIS interface to apply a SQL query that selects properties within a particular price range.
The resulting display highlights the properties that match your search.
2.In that same map (with the properties already highlighted), apply another query to select properties of a particular acreage.
When you get the results, you probably have more than one possible parcel to choose from. Some parcels might be much bigger than the 5 acres you need. You can modify your search to find only those parcels that are between 5 and 7 acres. (In fact, you could have done that in your first search.)

Chapter 11: Searching for Geographic Objects, Distributions, and Groups 175
3.Save the map you made (in this example, all the land parcels between 5 and 7 acres in size and priced at less than or equal to $100,000) to a new map.
But even then, you might have too many choices. Luckily, you can narrow your search even more. You notice that not all the parcels are the same shape: Some are long and skinny, and others are square and blocky. And you decide to select parcels on the basis of shape.
4.Visually inspect the polygon shapes that represent your selections up to this point and choose from what you see.
Perhaps you decide that you like the blocky parcels, as opposed to the ones that are long and skinny, and you want to narrow the selected properties accordingly. The good news is that you can spot (within your ever-narrowing set of properties) what you need right away.
You can calculate shape in GIS, but you don’t really need that level of technical detail right now. In fact, most GIS software is only beginning to deal with shape analysis. Such power will no doubt be increasingly available as GIS software developers create new programs for shape analysis.
Most GIS software allows you to draw boxes that touch the map features you want (which you can read about in Chapter 10), so you don’t have to do any fancy calculations. Just point and click.
5.Draw boxes that intersect the polygons you see that match your criteria.
Besides not wanting long, skinny parcels, you might want parcels that are oriented north and south, rather than east and west. Choose
selected polygons that are the right shape and oriented just the way you want them.
When you’re done, you can save this multi-step search as a map, as well. So, take the lead with your search criteria! Instead of relying solely on the GUI and SQL, you get to use your own powers of observation and select items based on what you see.
Finding polygons based on location and position
While you search for polygons, you may want to consider where they’re located and how they’re positioned. You may, for example, want your parcels within a certain distance of town so that you don’t have to travel too far every day. And maybe you want to find land near a lake so that you can go fishing without having to drive for hours. You might also want your land to be on a hill rather than in a valley, or in the foothills rather than in the mountains.

176 Part III: Retrieving, Counting, and Characterizing Geography
You can perform searches based on location and position by using the GUI query tool. In Chapter 12, I show you how to measure distance. Most GIS software even has a tool you can use to select objects that are touching (adjacent), so you know exactly what parcels of land are next to each other.
Like you do when locating parcels with particular sizes, shapes, and orientations, you can easily estimate distances from one polygon to another and use the graphical query tool — the little box that you drag over the polygons — to select the ones you want.
Defining the Groups You Want to Find
Your project goals almost entirely control how you choose the groups of features you want to find. No formula exists for choosing groups, but you can ask yourself some basic questions. These questions are based on the types of data you have, the theme or themes you’re interested in, and what feature properties and underlying geography you need to know about.
Looking for common properties
To find groups of geographic features — whether they’re points, lines, polygons, or even surfaces — you first need to know what properties they share. You already do this type of grouping naturally when you decide on the types of movies you like to watch (categories); whether to order a small, medium, or large pizza (rankings); or how much money to spend for various types
of entertainment (ranges). You can use the same thought process to select polygons by
Category: The same type of object. You can select all oak trees in a map of trees, single-family dwellings in a map of housing, highways in a map of transportation, agricultural lands in a land-use map, or alluvial fans in a landform map.
Rank: You can search for groups of features based on differences in rank. For example, separating cities by population ranges or selecting land units by high, medium, and low risk for earthquake or avalanche.
Scale: If you have point, line, area, and surface data measured at interval or ratio scales, you can group those features pretty simply. You can select all stores (points) that have a particular dollar value of sales, roads (lines) that have selected specific traffic volumes, land parcels (polygons) that fall within a range of value per acre, or topographic surfaces that have slopes at a given range of elevation that change over a certain distance.
Chapter 11: Searching for Geographic Objects, Distributions, and Groups 177
Spacing: You might want to select objects based on what they’re near, how far apart they are, their average spacing, or whether they’re evenly spaced, dispersed, or clustered.
You can apply all these methods to properties of the intervening space (the space between features), to the features themselves, and to those features’ shapes.
Looking for common positioning
Sometimes, you may find that geographic features seem to occur in some places and are totally absent or very poorly represented in other places. Such differences in density are not necessarily just statistical anomalies.
Instead, the features tend to occur in certain places because of some underlying process or control that causes them to occur in those places and not in other places (that is, the distributions are determined by another distribution or process). In other cases, the relative density of the features changes in an observable, statistically predictable fashion.
 Here’s a quick list of some features that might exhibit patterns related to some GIS form of controls or outside forces:
Earthquakes and volcanoes (related to the locations of continental plates)
Vegetation types (related to soil types, slope and aspect, or herbicides)
Mobile homes (related to zoning)
Vandalism (related to neighborhood type and/or gang activity)
Winter tourists (related to winter temperatures)
Because these features occur in one area versus another area, you have to deal with a new problem — that of determining why such differences exist. To a geographer, such patterns form questions. These questions might include:
Is the pattern real or a product of sampling (or lack of sampling)?
Some striking distribution changes aren’t necessarily accurate: They may be a result of lack of sampling. First, check whether your distribution reflects sampling methods, mistakes, omissions, or even oversampling in one area versus another. You need to know your data (a good reason to produce your own database when you can) or establish a way to spot-check your data for accuracy. Check out Chapter 8 for more on sampling.
Don’t just assume the patterns that occur on maps are accurate. Check the metadata for information on methods and sampling procedures, as well as any other information that allows you to verify the data’s reliability.
178 Part III: Retrieving, Counting, and Characterizing Geography
Is there a distinct difference between places where features occur?
Sudden changes most often indicate an equally abrupt change in some other factor that either controls or contributes to the existence of the features. And if your distribution changes gradually, a process is probably controlling that change. The process may occur naturally. Suppose you notice that the cotton plants that have grown in a certain place for a long time are starting to die off. The growing process takes nutrients from the soil, and the cotton plants — growing in one location year after year — have depleted the nutrients in that area.
If the distribution changes gradually and in a particular direction, this change may reflect the direction of change in an underlying process. For example, density may seem to change from the middle outward or from one direction to another. A change from the middle outward can indicate dispersion from high concentrations to low concentrations, while a directional movement can indicate movement toward more favorable environments, sources of nutrition, and so on. For example, a herd of bison may migrate toward new sources of plants for grazing.
Abrupt changes in distribution usually indicate the presence or absence of a controlling factor.
What area of the map does a set of points or lines occupy? When distributions are spottier and change from dense to sparse in a more variable way, you may find it difficult to figure out whether the patchy distributions (each of which might be either clearly defined or gradually changing) are related to one another functionally. But you absolutely must make this determination because your conclusion based on a distribution often assumes that the distribution maps are correct. When you create a grouping, having experience observing how distributions naturally cluster helps you determine where to draw the lines around groups of features. Some specialized software packages use sophisticated statistical techniques to make these grouping decisions, but most general GIS software is only just catching up.
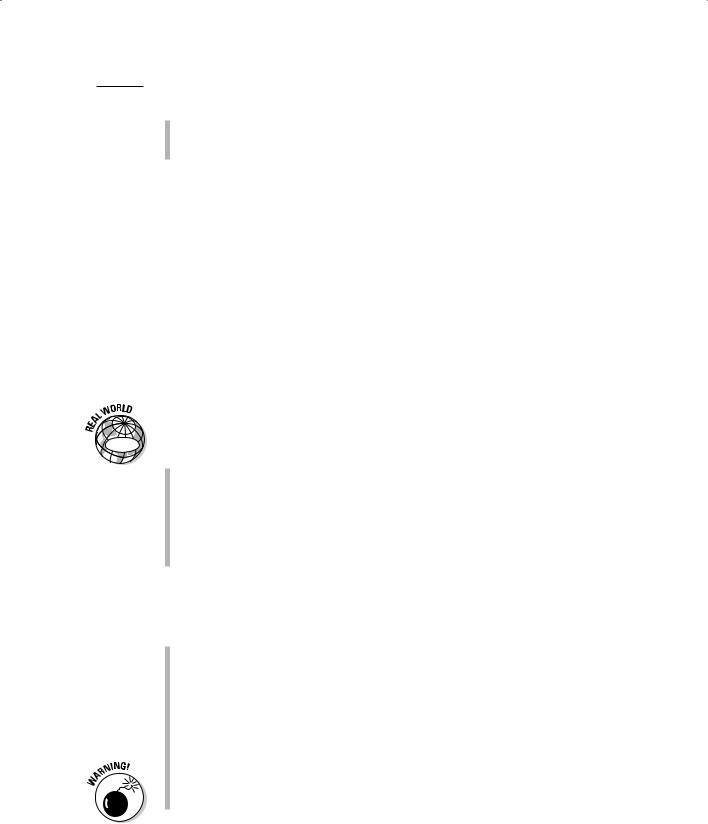
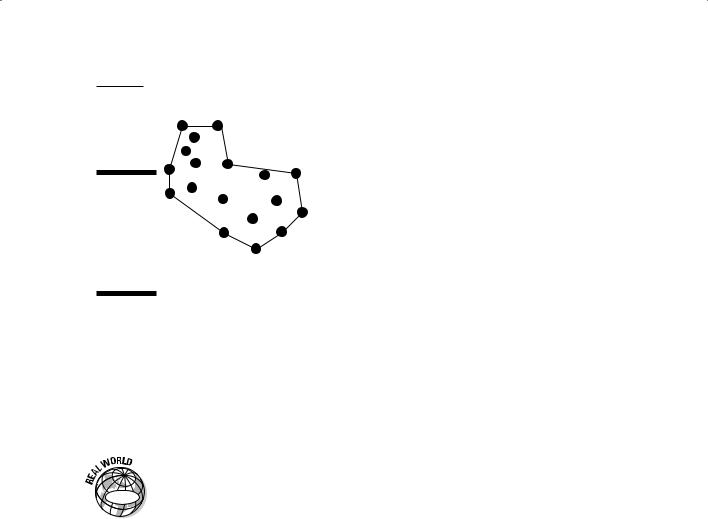
One basic method of enclosing distributions into a single polygon is almost like using shrink-wrap. You decide which points you want to include, and the software draws a polygon by connecting the outside points, creating the least convex polygon (like the one shown in Figure 11-9). This simple and easy method groups features rather nicely for most distributions. If you need more accurate methods, you can search the spatial statistics packages included in modern GIS software.
Does the area of distribution correspond to any other feature or distribution? When you begin to look at distributions and see patterns in those distributions, you naturally start asking whether one pattern is related to another, whether one causes the other to exist, and to what degree these patterns correspond. Chapter 15 addresses this question in detail.
Chapter 11: Searching for Geographic Objects, Distributions, and Groups 179
Figure 11-9:
The least convex polygon
approach to grouping
objects.
Least Convex Polygon
Grouping by what you already know
Even the seemingly mundane task of finding the location of geographic features lets you create new maps that answer questions and allow you to make powerful decisions. When you engage your GIS to find and group objects, you base your search strategy on your project goals (what you need to know), but also rely on what you already know to help direct your search.
|
Suppose that you’re an epidemiologist (a scientist who studies infections). You |
|
|
need to understand the distribution and spread of West Nile virus. West Nile |
|
GIS |
virus is spread by mosquitoes, which need standing water to breed. You must |
|
therefore identify places where outbreaks of the disease occur most fre- |
||
|
||
|
quently so that you can identify places where you can hopefully eliminate the |
|
|
cause (the infected mosquitoes). |
This basic scenario gives you all the building blocks you need to formulate your questions and decide what types of data groups you’re looking for. Just follow these steps:
1.Identify your target objects and a search strategy to find them.
To satisfy the goal in this example (eliminating infected mosquitoes), I want to locate and group two things: patients with West Nile virus and mosquito breeding grounds. You select, qualify, and group your data basing your strategy on what you know:
•To find patients: Look for point data in the form of the locations of patients. You need to group these patients into two classes: those who have contracted West Nile and those who haven’t.
Further qualify your patient data by selecting out the class data that occur in high density — for example, more than two cases of the disease per square mile. Now, you have a set of points that illustrates high versus low density of West Nile virus throughout

180 Part III: Retrieving, Counting, and Characterizing Geography
your study areas. By narrowing down the patient data groups, you may begin to see patterns emerging that suggest selected areas that might have high numbers of mosquitoes.
•To find mosquito breeding grounds: It’s really hard to map mosquitoes as point objects (they’re pretty little, and those GPS units make flying awfully difficult). But you do know that mosquitoes require standing water to breed. Standing water can be anything from ponds to puddles, pools to tires with water in them, and you just happen to have data on all these features. You need to group the polygons that are likely to have standing water and those that aren’t because you assume that areas with lots of standing water (a higher density of standing-water polygons) are much more likely to be mosquito breeding grounds.
So, you regroup your polygons based on how clustered they are, in relation to one another, using the feature’s geography — defined here as the distribution of the polygons — to give you a ranking of high, medium, and low potential for breeding mosquitoes.
2.Create maps showing your newly grouped target objects.
In this example, you have one map that shows concentrations of West Nile virus cases and another map that shows different levels of mosquito breeding potential.
3.Overlay and compare the maps showing the grouped objects.
If your assumptions are correct, you see higher concentrations of West Nile virus near the locations having a higher potential for mosquito breeding grounds. This correlation suggests exactly where you can begin a mosquito abatement program to reduce the risk of infection.
But you might also see situations in which higher outbreaks seem to occur where mosquito-breeding potential is medium or even low, suggesting that you need to do a further examination of geographic features that might account for these inconsistencies.
This example shows you how to perform a simple analysis of the types of objects (in this case, points and polygons), the measurement levels (nominal), and their geographic distributional attributes (concentrations of infections and of standing water sources).
You can use the same approach, basing your grouping strategy on what you need to know plus what you already know, to satisfy many other kinds of GIS projects. In any case, many features you want to group share both functional and spatial relationships. The functional relationships (such as cause and effect) help you decide which features you want to search, and the spatial relationships allow you to identify the degree of spatial co-occurrence (where different geographic features seem to occur in the same locations). Chapter 16 talks about how you can use GIS software to make these comparisons without guesswork.