

GIS For Dummies
.pdfChapter 7: Managing Multiple Maps 111
relating geographic data. You don’t often see the internal workings of the GIS, and I don’t go into unnecessary detail. You may want to choose a GIS software package for your organization sometime, so having a basic idea of how overlays work will help you in your selection process. Because how you work with overlay operations affects which GIS model you use, you need an understanding of the similarities and differences, strengths and weaknesses of each model to help you make the right choice.
Checking out a hybrid system model
One successful method of managing many different layers inside GIS is through a hybrid systems model conceived in the early 1960s during the development of the first operational GIS. The hybrid model structure recognizes the fundamental difference between graphics features (entities) and their descriptions (attributes). Many of the original vector-based GIS packages used the hybrid model, including the original ESRI ArcInfo software. See the sidebar “Combine and create with ArcInfo,” in this chapter, for a bit more about features and attributes in this hybrid system.
What makes this model a hybrid is that the two parts — the graphics (entity) part and the description (attribute) part — exist entirely separately from each other (see Figure 7-1). When you search a hybrid system, you retrieve the graphics part, meaning the geographic features, separately from the data part (the attributes for the features), but they are connected through software that communicates between these two parts.
In the original ArcInfo software, a retrieved layer was called a coverage because its primary function was to overlay other layers.
Software
Link
Figure 7-1:
The hybrid
GIS model.
Entity files |
Attribute files |
112 Part II: Geography Goes Digital
The entity files that make up the retrieved layer contain identification codes; feature types (point, line, or polygon); and (typically) information about
the number of features, their measurements, and sizes, all captured during the input process. The entity files connect with a set of computer code — called links or pointers — that literally point back and forth between each geographic object in the entity files and its description in the attribute files. These attribute files are stored within the tables of a traditional relational database management systems (RDBMS), which I discuss in Chapter 6.
When you retrieve and overlay two layers in a hybrid system, you get a third layer that combines the features and data of the other two. This combination requires the software to “rebuild” the entity and attribute files to match the changed topology of the third layer. Systems that work this way are called topological graphics data models.
The rebuilding process that these models use compares the new entity records in the one set of files with the attribute records in the other and then reworks the data to check, correct, and rebuild topological relationships. The system also needs to perform this topological rebuilding when it reconfigures the graphics of a single layer.
Different approaches to these systems, called integrated topological models, perform the rebuilding operations more or less simultaneously with the process of overlay and other analytical operations affecting topology, which makes your job somewhat easier because you don’t have to wait for the topology to be rebuilt.
Combine and create with ArcInfo
In some ways, the ArcInfo model is similar to the Map Analysis Package (MAP) model covered in Chapter 5 because each layer has a name (for example, Vegmap or Soilmap). The name provides access to each layer individually. When ArcInfo was popular, the commandline user interface addressed combinations of layers and their attributes through a natural language structure, again much like the MAP model. So, you could overlay layer1 onto layer2 to get layer3.
ArcInfo, a classic example of the hybrid system model, was created as a topological graphics
data model. When overlay operations combine the graphics of one layer (layer1) to those of another (layer2), the polygons themselves become unique combinations of the two originals. By combining layer1 and layer2, you create a totally new layer3 that must also have its appropriate entities, attributes, and topological structure. Layer3 now has new attributes that reflect the combination of layer1 and layer2 attributes, and those attributes are assigned to the new layer’s features (the unique polygons).

Chapter 7: Managing Multiple Maps 113
Eliminating pointers with integrated system models
Unlike hybrid systems, integrated systems treat entities, topology, and attributes all the same by storing them in the same sets of files. Integrated systems still treat each layer as a separate set of data and provide a naming mechanism so that they can find any layer needed. But the integrated systems don’t need links or pointers from entities to attributes because all the records are contained in the same RDBMS files (see Figure 7-2). Like the RDBMS itself, the integrated system simply connects one set of tables to another through relational joins.
Figure 7-2: |
|
|
The |
|
|
integrated |
|
|
GIS system |
Entity files |
Attribute files |
model. |
Most integrated systems were originally derived from other forms of spatial software that were more closely allied to facilities management and computer-aided manufacturing. Their original intended use was for visual overlay, not managing multiple maps for analytical combination. If you were doing facilities management, for example, you’d want to know the location of
specific pipes, fittings, access points, joints, and electrical wires and conduits relative to one another. A visual overlay could show you this positioning.
Although integrated GIS systems weren’t originally designed for overlay operations, they’ve evolved to perform such tasks quite effectively. One major difference between integrated and hybrid systems is that integrated systems don’t need pointers between two sets of files. If you plan to use your GIS to manage many layers that have limited overlay operations, the integrated system is a good choice.

114 Part II: Geography Goes Digital
Getting better control with object-oriented system models
The ESRI geodatabase model (covered in Chapter 6) is built on the hybrid concept (see “Checking out a hybrid system model,” earlier in this chapter) but possesses a unique and powerful object-oriented nature that makes handling layers, whether individually or in multiples, a bit more complex during database building. Objects, the groups of geographic features represented in the database, have a unique property called inheritance, which means
Objects can exhibit properties and rules that govern their behavior in your database. These properties and rules make the features you include in your GIS more realistic in their representation of geography.
Any feature that belongs to an object class (a class is a group of similar objects, such as streets or land-use polygons) shares (inherits) the properties of the class.
An object class can also belong to larger classes of objects that also share their properties. So, a group of forest polygons would share the properties of all forest polygons, but they would also share the properties of a larger class of polygons — vegetation polygons (see Figure 7-3).
|
|
Object class |
|
|
|
||||
|
|
|
|
|
|
|
|
|
|
|
|
|
|
|
|
|
|
|
|
|
|
|
|
|
|
|
|
|
|
Figure 7-3: |
|
|
|
|
|
|
|
|
Forest |
|
|
|
|
|
|
|
|||
Features |
|
|
Polygons |
|
Vegetation |
|
Type 1 |
||
that belong |
|
|
|
Polygon |
|
|
|||
|
|
|
|
|
|||||
|
|
|
|
|
|
|
|
||
to an |
|
|
|
|
|
|
|
Forest Type 2 |
|
|
|
|
|
|
|
|
|
||
object class |
|
|
|
|
|
|
|
|
Forest Type 3 |
inherit the |
|
|
|
|
|
|
|
|
|
properties |
|
|
|
|
|
|
|
|
|
|
|
|
|
|
|
|
|
|
|
of that |
Polygon #1 |
|
|
|
Polygon #2 |
|
|
|
|
class. |
|
|
|
|
|
|
|||
|
|
|
|
|
|
|
|
|
|
|
|
|
|
|
|
|
|
|
|
|
|
|
|
|
|
|
|
|
|
Class properties can include unique properties, such as your naming conventions, and even some unique rules of behavior. Class properties also prevent improper combinations through overlay and non-overlay operations alike. Rules prevent you from doing things such as creating GIS plans for building roads over rivers where no bridges exist. They protect you from creating mathematical inconsistencies by improperly combining layers of

Chapter 7: Managing Multiple Maps 115
different data measurement level, for example, by multiplying numbers that represent nominal categories by those representing ordinal, interval, or ratio scales of data measurement. (See Chapter 1 for an explanation of these data measurement levels.)
Having these built-in protections presumes that the governing rules exist somewhere in the database. Most object-oriented systems allow for a separate set of tables that contain these specific rules and logic. In that sense, such systems resemble the hybrid system more than the integrated one (I describe both system types in the preceding two sections). The good news for you is that the user interface doesn’t really depend on the system model so you can move from using one model to using another model seamlessly.
If you want to have some serious control over how your map variables interact (and if you know more than a bit about how the geography controls these interactions), an object-oriented system is your best choice because you can explicitly include your knowledge as rules and properties in your database.
Opting for an Object-Oriented Model
The speed and efficiency of modern computers have fundamentally altered the way computer systems, even large ones such as GIS, work. User interfaces have moved from command-line entry to graphical user interfaces; you can store large amounts of data on massive storage devices; and (most importantly) you find little difference in how programs that have different speeds and performance work on your system.
So, speed and efficiency don’t really play a part in your decision making, and choosing a system model has much more to do with what you want to accomplish and the nature of your analysis. These three major factors might help you decide on an object-oriented system model:
How well you know your data: If your system is based on a well-known geography (for example, on your knowledge of how crime occurs geographically), the object-oriented model allows you to code that logic into your database.
What depth of analysis you require: If you need to supply additional geographic rules and logics for some existing geographic features that you understand well, then you should use an object-oriented system model that allows you to include those rules.
How you see your GIS needs evolving: Moving toward the object-ori- ented GIS can help your system become more adaptable to innovations in system design that will continue to use object-oriented programming and database management techniques.

116 Part II: Geography Goes Digital
If your industry can use object-oriented data models (which I talk about in Chapter 6), take advantage of those models when you can. The vast majority of object-oriented data models are geodatabase models that work with ESRI ArcGIS software. Consult with others in your industry before you decide on a system.
Although object-oriented systems are powerful and provide a much better geography than simpler systems, you don’t have to use that power if you don’t have an immediate need for it. Many users of object-oriented GIS software never use the full potential of the object-oriented model, just as most folks never use the full potential of their word-processing software. In any case, the model’s power is there when and if you do need it.

Chapter 8
Gathering and Digitizing
Geographic Data
In This Chapter
Using the best data for your GIS
Incorporating data from GPS, remote sensing, field collection, and censuses
Adding existing maps to your GIS
No GIS can operate without substantial amounts of quality geographic data, no matter how you intend to use it. You can purchase these data
from commercial vendors, but the surest way to guarantee your GIS database integrity is to build it yourself or carefully supervise its construction for the specific task or tasks that you have in mind. You know exactly what you want your GIS to do and how you want it to help with your decision-making.
Because GIS offers so many possible applications, many possible types of data exist that you can put into the GIS. This chapter discusses a few examples in four basic data groups that you’re most likely to encounter — GPS, remote sensing, field data, and census data. In this chapter, I also show you how to work with existing maps and prepare them to be digitized.
Identifying Quality Data
The sources of GIS data, as well as their accuracies, sampling methods, and many other factors, affect not just the quality of a GIS database, but also how effectively it serves your decision-making needs. I’ve personally tried to build GIS databases based on over 10,000 observations of wild animals. Unfortunately, because the study was based on behavior, rather than movement through the study area, the researchers took the vast majority of the
samples in front of several den locations, making those samples unacceptable

118 Part II: Geography Goes Digital
for GIS implementation. Because the researchers collected all the data at one spot, while the data (animals, in this case) wandered all over the study area, the samples don’t reflect the spatial nature of the data. I’ve had similar problems because of data that has incorrect classifications, scale problems, timeliness issues, and so on.
If you want GIS to be useful for finding solutions to geographic problems, it needs to be appropriate (to the degree possible) in the following ways:
Scale or resolution: How much detail do you need for your study?
Measurement level: Do you need interval data, or are categories enough?
Accuracy: How well can your measurement tool capture your data?
Sampling method: Do you collect all the data in all the places you need?
Timeliness: Do you work with time-sensitive data that change quickly and need to be collected right away?
Data type: Are the data the appropriate data for you application, both in subject matter and in format? (Do you need field data or satellite data, for example, or do you need soil data rather than temperature data?)
Data classification system: Do you use the same data classes as other layers in your database (for example, land-use classes from 1955 versus 2005)?
Completeness: Have you collected all the data that you need to answer your question?
Select only the best-quality and most appropriate data type for your needs. Collecting more data than you need and gathering data that includes irrelevant details add to the costs and reduce the effectiveness of the resulting GIS.
Importing Statistical and Sensory Data
To keep things simple, I’ve divided GIS data into two types: statistical and sensory. This division is a bit artificial. I’m defining sensory data as those data most commonly associated with distant sensing devices, such as the Global Positioning System (GPS), and various forms of imagery, including both aerial photography and digital satellite data. Statistical data include field data and census data, both of which usually rely on some form of direct contact by a person to collect.

Chapter 8: Gathering and Digitizing Geographic Data 119
Getting information from GPS data
Folks often mistake GPS for GIS, partly because the two acronyms sound so much alike and partly because GPS is more common as a consumer product. Using the advanced technology of GPS to provide highly accurate location data is a huge bonus when building a GIS.
GPS requires a large number of satellites orbiting the Earth (32, as of this writing), strategically placed base stations, and receiving equipment (shown in Figure 8-1). By triangulating radio signals sent from these orbiting satellites down to Earth, geographers and geodetic scientists can calculate the latitude (north-south location) and longitude (east-west location), as well as elevation data, for virtually any location within the satellites’ lines-of-sight.
Figure 8-1:
A typical GPS receiving station.
120 Part II: Geography Goes Digital
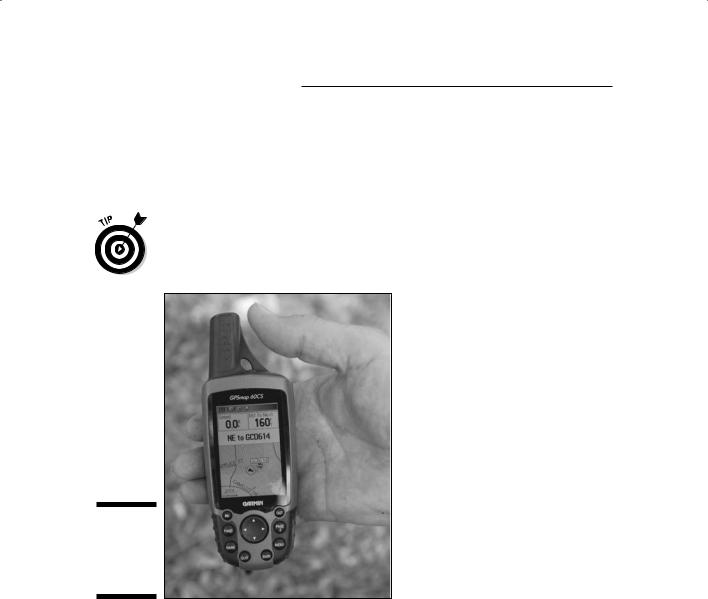
Because GPS requires line-of-sight, it isn’t as useful for places such as the tropical rainforest because the trees prevent the receiver and the satellite from seeing each other. Even in conditions without the problems of tree canopy, for best results, it takes three or more satellites and some expensive receiving equipment (what the stores call GPS units). But even inexpensive receivers can yield some incredibly accurate results (see Figure 8-2).
GPS receivers that cost less than $100 can still give you accuracies of less than 10 meters, depending on the number of satellites your unit can see at one time.
Figure 8-2:
An inexpensive handheld GPSreceiver.
Using remote sensing to create maps
Scientists have used aerial photographs to map portions of the Earth for nearly 100 years, and although the technology today is mostly digital rather than film, it’s still available. Most of the U.S. Geological Survey’s original topographic maps were derived directly from observations from aerial photographs. In fact, USGS created or improved a large majority of map products derived before the mid-1970s by interpreting these pictures.
When satellites sense the Earth, they detect radiation values for a large grid of small squares covering part of the earth’s surface, much like the grid cells described in Chapter 4. Because these grid cells are specifically related to recorded imagery, they’re called picture elements — or pixels, for short. Each