

GIS For Dummies
.pdfChapter 8: Gathering and Digitizing Geographic Data 131
A school needs a location near students. So, you need a map that shows where potential students live.
A school needs a location that’s not already built up. Okay, you need a map of available land for sale.
A school needs a location that’s accessible and legal. You want to position a school near streets (so, look for a street map), where it can access utilities (water, sewerage, electricity, gas maps) in an area that’s zoned for public buildings such as schools (a zoning map), and so on.
Cleaning up after digitizing
The result of digitizing maps — getting them into your computer — is to create a database for your GIS to use. But during the digitizing process, some inaccuracies may creep in. You need to look for two general types of errors when deciding whether your GIS database is ready for use: entity (graphical) and attribute (description) errors. Here’s a list of general rules that can help you decide whether your database is correct (keep in mind that many of these rules overlap):
All entities that you want to include are present.
Your database contains no unnecessary features.
All entities are in the correct location.
All entities are the correct size and shape.
All objects have the correct labels.
Each polygon has exactly one label.
All features are of the correct type.
To determine whether the database includes all the features you want or whether it contains unnecessary features, you often need a complete accounting of what you wanted to include in the first place. You prepare
maps prior to hand digitizing so that you know exactly what you need to digitize and what should be in your database when you are done. Because you can actually see the relationship between what you have completed digitizing and what you have not completed right on your computer monitor, heads-up digitizing has advantages over traditional digitizing methods.
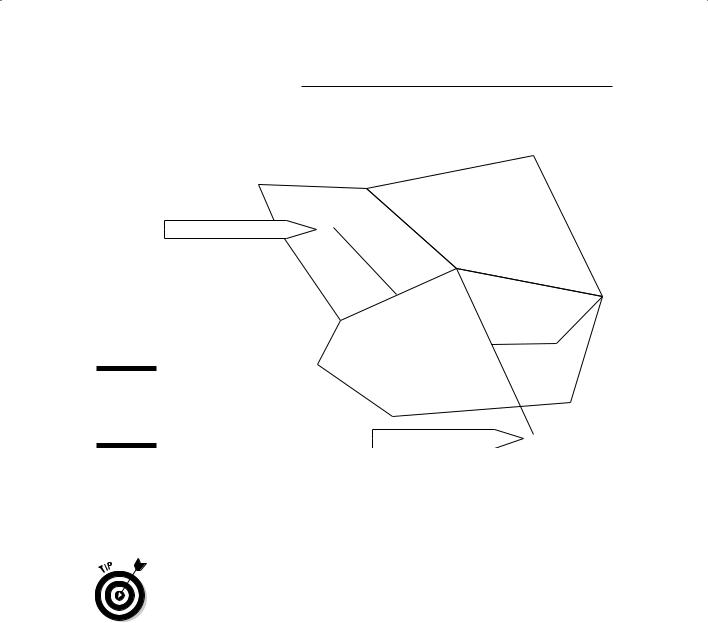
Entity errors that relate to the accuracy of location and position, collectively called dangling nodes (dangles, for short), come in two types — undershoots and overshoots (see Figure 8-10). Overshoots and undershoots might cause your GIS to either over-report or under-report the number of polygons in your database, which can also make your labels inaccurate.
132 Part II: Geography Goes Digital
Dangling Nodes
Undershoot
Figure 8-10:
Dangling nodes, or
dangles.
Overshoot
In most GIS software, digitizing modules ask you to define the nature of the features while you input them by assigning specific codes that indicate, for example, the beginning and ending of a line or polygon. If a line coded as a polygon fails to connect to create that polygon — if the line is a dangle — the software typically displays a graphic symbol indicating there is a problem.
In my experience, you can more easily find and correct overshoots than undershoots. Unless you’re Ms. or Mr. Stable, and you are very certain about exactly where you are digitizing, draw those lines too big, rather than too small.
Building the metadata
Some inexperienced GIS practitioners might lead you to believe that if you have a clean, error-free database, you’re ready to store, use, and share your data. Nothing can be further from the truth. I can’t tell you how often I’ve received databases, created with meticulous care, that still don’t really
explain exactly what they contain, how accurate that data is, the timeliness of the information, what the categories mean, and so forth. I needed something that describes the database. What I needed, and what you need to make your GIS database really useful, is metadata.

Chapter 8: Gathering and Digitizing Geographic Data 133
Metadata is data about data. It’s a complete description of the major facets of quality, source, and accessibility of the data that make them useful not only to you, but to others who might use the data after you do. In my teaching, I’ve used the phrase “tracking down the wetlands fox” from a newspaper article I saw years ago. That article described the difficulty of sharing databases when some of the layers contained multiple definitions of something as seemingly obvious as a wetland. Because it has different official definitions for different agencies, a wetlands map no longer contains distinct identifiable categories. Comparisons of different wetlands maps become impossible.
You can find many other examples of classification discrepencies, including comparisons of old soil maps with new ones, trying to link land-use patterns and land-cover patterns when the terms used are nearly identical for substantially different classes, and more. But these examples constitute only one type of metadata. The Federal Geographic Data Committee, which is responsible for maintaining spatial data standards in the U.S. Government, has developed a list of seven basic entries for geospatial metadata:
Identification: Defines the database name, developer, area of coverage, categories, themes, collection methods, and data access
Data quality: How accurate and complete the data are, adaptability for application, positional accuracy, completeness, consistency, and sources for derived data
Spatial data organization: Data model (Vector/Raster), number of spatial objects, additional non-coordinate methods of location encoding
Spatial reference: Latitude and longitude coordinates included, projections used, datums, parameters used for coordinate transformations
Entity and attribute information: Specific attributes, what information is encoded, codes, and code definitions
Distribution: Where and from whom to obtain the spatial data (you can often access and read the metadata before you actually obtain it), available formats, media type(s), online availability, and cost
Metadata reference: Compilation date and compiler
There are many excellent examples of metadata. Here is a URL for a typical set from the USGS vegetation database for a portion of South Florida:
http://sofia.usgs.gov/metadata/sflwww/vegmap.html
People (often, government agencies) have created numerous online tools for developing metadata. You can find information about some of these tools at http://sco.wisc.edu/wisclinc/metatool. Today, most com- mercial-grade GIS software includes such tools for you, so you don’t need

134 Part II: Geography Goes Digital
to use software and interfaces that you don’t already know. Moreover, the vendors recognize the need for compliance with established metadata standards, so the better companies always do their best to be both compliant and current. Most GIS software also includes a tool for including metadata with your datasets (Figure 8-11).
Figure 8-11:
The metadata tool inside ArcGIS.
Always provide the most current, complete, and accurate metadata you can. By the same token, never buy data for your GIS from a vendor who doesn’t supply complete metadata.
If your GIS software doesn’t include a metadata tool, you may need to find a third-party tool if you plan to share your data with others or your data must comply with data standards. Although such third-party metadata tools exist, you may find that using one is inconvenient. Creating, saving, and linking the metadata is easier when the tool is integrated into your GIS software.

Part III
Retrieving,
Counting, and
Characterizing
Geography

In this part . . .
The data you put into your GIS isn’t much use to you if you can’t search out specific data, compile that data,
and then analyze and interpret to make sense of it. This part shows you how to retrieve just the right data and then turn that data into the information that meets your needs. In this part, you find out how you can describe the geographic data you find both numerically and by type. You also see how you can order geographic features by their sizes and shapes, as well as by their locations — both in absolute and in relative terms. Searching out and characterizing geographic data are powerful skills that serve you well when you work with GIS.

Chapter 9
Finding Information
in Raster Systems
In This Chapter
Creating a map search plan
Performing a search with your GIS
Making sense of your search results
Grid-based maps indicate where geographic features are located on a geographic grid, how much space they occupy, and their locations
relative to other features on the map. So, grid-based maps give you an extremely easy to understand way of storing spatial information.
With paper maps, you get the information you need by reading and interpreting the printed map. Paper maps are limited because you can layer only so many geographic features onto one map before that map becomes unreadable. For example, even though each kind of feature relates to transportation information, you can’t effectively show highways, waterways, railways, and ATC flight patterns all on one paper map. That would be one confusing map! You’d probably divide this kind of information onto separate maps. To work with more than one or two types of information, you need to gather information from separate maps — and who wants to go through that effort?
In GIS, you can comfortably map many types of information to a geographic grid because all the information can be coded into a computer and selectively retrieved for whatever subset of data you want. You use computer search and retrieval techniques to get just the information you need. The GIS may contain geographic information about all crops grown in the United States. You can retrieve just the geographic information about soybeans
in part of Kansas, if that’s what you need. First, though, you need software programs that allow you to locate the features you need to find. This chapter gives you the rundown on the easiest, most hassle-free ways to get the information you need from your GIS.

138 Part III: Retrieving, Counting, and Characterizing Geography
Creating a Search Strategy
When you look for information on a map, you look for geographic objects and distributions that match the theme, or classification system, of the map. You might look for a street name on a road map, a town or state on a political map, a rock formation on a geological map, or a type of plant on a vegetation map.
On one map, you might be trying to find the boundaries of your property or the area that’s expected to flood during severe flood events. When you search for this type of information, you’re looking for point and line objects, as well as areas and the boundaries around those areas.
The level of geographic data measurement (nominal, ordinal, interval, ratio, and scalar levels) determines the mathematical nature of the data turned up by your search. For more information about geographic data measurement levels, see Chapter 3.
After you determine the topical, classification, and measurement constraints for a search, you’re ready to choose an analysis technique. GIS offers many complex analysis techniques, which I discuss in Part IV of this book.
|
An example of a complex analysis might include combining maps to deter- |
|
|
mine the best place to put a dam based on the amount of water in a stream, |
|
GIS |
the shape and size of the river valley, the number of people and homes that |
|
might be impacted, and the cost of putting the dam in at that location. The |
||
|
||
|
number of factors involved in analyzing where to put a dam requires you to |
|
|
be able to extract all sorts of information about the stream hydrology, the |
|
|
terrain, the surrounding population, and economic costs involved under |
|
|
certain conditions. |
All such analyses require software that can find the geographic features used in the database. Complex analysis often drives the search for information. Complex approaches nearly always require fairly simple forms of search strategy. So, whether you’re interested in complex analysis and modeling, or the plain vanilla results of a search, you need to understand the search process.
Locating objects on a map
When you read a map, you often need to find objects that you know exist somewhere in the map — you’re just not sure exactly where they’re located. In grid GIS, if you know the names, categories, or measurement levels of the object, you ask the software to find all the grid cells that share the name,

Chapter 9: Finding Information in Raster Systems 139
class, or data level you seek. The software finds objects by the codes you use to identify them when you create the data. After you decide on a specific search object, you can follow these general steps to find the object and verify the results in most raster GIS:
1.Select the map layer that contains your search object.
To locate all public school buildings, for example, you first select the map layer that corresponds to the object schools. You wouldn’t look in a map layer called hydrology, soils, or elevation to find the location of the schools. But a map layer called public buildings probably contains grid cells categorized as courthouse, library, civic center, and many others — including schools.
2.Specify the names, codes, measurements, and so on that identify your search object.
Look in the data that you or someone else produced to find out the code used for each object when the grid layer was created. In this example, you would determine the code used for schools and tell the computer to search for that in the grid layer called public buildings.
3.Review the retrieved information and make sure you got what you searched for.
The final map contains a subset of the data in the public buildings layer and will highlight only the cells containing the code for school buildings.
4.Name your new map.
You get the honor of providing a new name for the map. In this case, you’d likely call the map schools.
Folks run searches for all sorts of reasons, and the most simple (but not necessarily most common) is curiosity. You might want to know how the schools are distributed throughout the city. Or maybe you just want to simplify the map so that you can easily see individual schools without having to deal with all that annoying background. Most often, though, when you search for objects, you have a more complex question in mind. You may want to search for schools because you want to know where they’re located relative to other features, such as housing, so that you can buy a home near a public school.
People almost always have features or distributions other than simple location in mind when they perform a search in GIS. For example, you might look on a map for the location of your home, but you really want to find out whether you live within the same school district as a particular elementary school you want your children to attend.

140 Part III: Retrieving, Counting, and Characterizing Geography
Searching for linear features
Linear features are common search items. Among the most common linear features are roads and other transportation routes, such as rail lines. In grid GIS, these features appear as a series of connected grid cells within a transportation layer. Within that layer, you might be looking for just the Interstate Highway system in the United States or the Great Siberian Railroad within Russia.
You may be searching for these features to find the shortest route from one place to another, which requires the software to determine which roads would suit that search. Or you may want to know which roads allow hazardous cargo so that you can perform a later analysis of populations at risk. The software finds these linear features the same way it finds point objects — by the codes you use to identify them.
Searching for areas and distributions
You may want to search for areas in a GIS, such as large cities, counties, states, farmlands, or industrial areas. Or perhaps you want to determine distributions of birds and other wildlife, vegetation, disease, religions, population types, natural resource deposits, or literally thousands of other features. In fact, Roger Tomlinson developed the first GIS mainly to map resource distributions.
Searching for polygons (areas and distributions) in a GIS helps you determine how much of your specified search subject exists (which can be important information), but your search results can provide other insights, as well. For example, you may want to know if
Distributions are growing or shrinking. You may need to know the location of the current distribution of the imported fire ant or the Africanized bee in the United States and how that distribution changes over time.
Changes in distribution might affect other point, line, and area features. With information on the scope and movement of exotic (and often troublesome) species, you could prepare for their migration into areas that they don’t currently occupy.
Existing conditions might affect your future plans. You may want to know the locations of areas zoned for business so that you can make decisions about where to start a new business.