

GIS For Dummies
.pdfChapter 10: Finding Features in Vector Systems 151
Figure 10-2:
The ESRI geodatabase just says no to improper
connections.
Deciding How to Search the Systems
You can search for information in a GIS in many ways: You can grab a set of graphics from the screen, search by neighborhood characteristics and
adjacency, or look for a particular data type. Because this chapter discusses the vector data model, I focus on the most important ways that you typically search for geographic objects in a vector GIS, as follows:
Search by attributes, using the SQL interface. You can search for any attribute that you want, as long as the attribute is included in the database. For example, you can search a forest layer for areas infested with Dutch elm disease or the pine bark beetle. You can search a census layer for census tracts containing households that have a particular level of family income. Or you can search a transportation map for dirt roads. Basically, you can search any characteristic — size, color, variety, value, category, length, area, condition . . . you name it — that has an associated attribute stored in the database (or that the software can calculate from the database). If the information is in your database, the GIS can find it.
SQL (Structured Query Language) is the computer language used to formulate database queries based on logical or mathematical search operators. Polygon-based GIS packages rely heavily on this form of search strategy, even more than the grid-based systems do. Check out Chapter 9 for more about SQL.
Search for features by using the graphics interface. For example, you might see on-screen a set of features that you want to work with. You can use your cursor to draw a box around those features to select them.
152 Part III: Retrieving, Counting, and Characterizing Geography
Targeting the right data source
You need to identify three search criteria before you start a search (in either a raster or vector GIS) to help you make sure that you’re looking in the right place:
Theme or topic: The search for individual features is first directed to the layer that contains data for that theme. For example, a search for geological features such as mesas requires you to use the geology layer.
Classification system: Knowing what classification systems identify the information you need can help you decide what specific classes to search. If, for example, you’re looking for land to use for commercial development, you can find that information in a layer that uses the zoning classification system.
Level of measurement: The level of measurement determines what search values can find the data you want. For example, if you want to search for land-use codes (nominal data stored as integers), you probably don’t want to search for values of 9.3044211 (interval or ratio data) because the codes are not rational numbers.
Keeping the expected result in mind
In Chapter 9, I talk about how a search can drive analysis. Briefly, this concept involves planning your search so that you target the right data source (as discussed in the preceding section), look for the right criteria, and properly analyze the result. (See Chapter 9 for more explanation of the process.)
Follow these steps to work within the search-drives-analysis concept:
1. Define your question in geographic terms.
2.Decide on the spatial features that you need to work with.
3.Formulate your search based on your data needs.
4.Conduct your search.
5.Prepare to analyze the results.
Locating Specific Features with SQL
You’ll probably often want to search for specific point, line, or area features with your GIS. You might want to find specific types of trees (such as oaks) in a layer of trees, or you might want to find a set of slopes that range from 15

Chapter 10: Finding Features in Vector Systems 153
to 45 degrees in an elevation layer. The theme (for example, forests or elevation) directs you to the right layer, the classification limits what categories (such as oaks or slope) the software can effectively search, and the level of measurement determines the types of numerical data you find.
In the following sections, I outline how to use vector GIS to find specific features by using the SQL search engine. Each attribute search you perform — whether for points, lines, or polygons — follows the same procedure. I use ArcGIS for the examples, but any vector GIS should work pretty much the same way.
Getting to the point(s)
Perhaps you’re interested in the population statistics for the African continent, so you use the GIS data you just happen to have (okay, the data I happen to have) that shows the countries and cities of Africa. The data includes statistics on population both for countries and cities, so you know you have the right data source. You first want to know a little about the cities of Africa, and you start the search process to look for point features (the cities).
Follow these basic steps to perform any attribute-based search by using the SQL tool of your GIS:
1.Open your database.
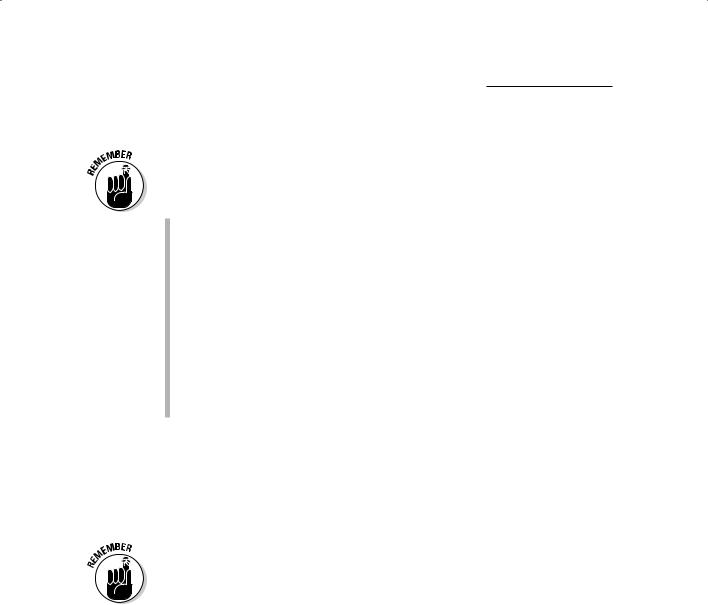
I load up my GIS and, using the ArcGIS user interface, pull up Africa on my screen. The data layers are active (which means they automatically display on-screen). In Figure 10-3, you can see that the countries and the major cities are already appearing. I can tell that the geographic features I want to examine are already available.
2.Highlight the theme you want to search.
In this example, I want to look at the city data, so I highlight the City theme.
3.(Optional) Open the attribute table for that theme to examine the data.
This process step is optional, but it helps you double check that the tables really contain data or determine what data you might want to search. Use it with your GIS searches — if you’re choosy like me and want to know for sure that the data exist. This lets you spread your wings a bit and let the GIS software help you sort through data to see what’s there.
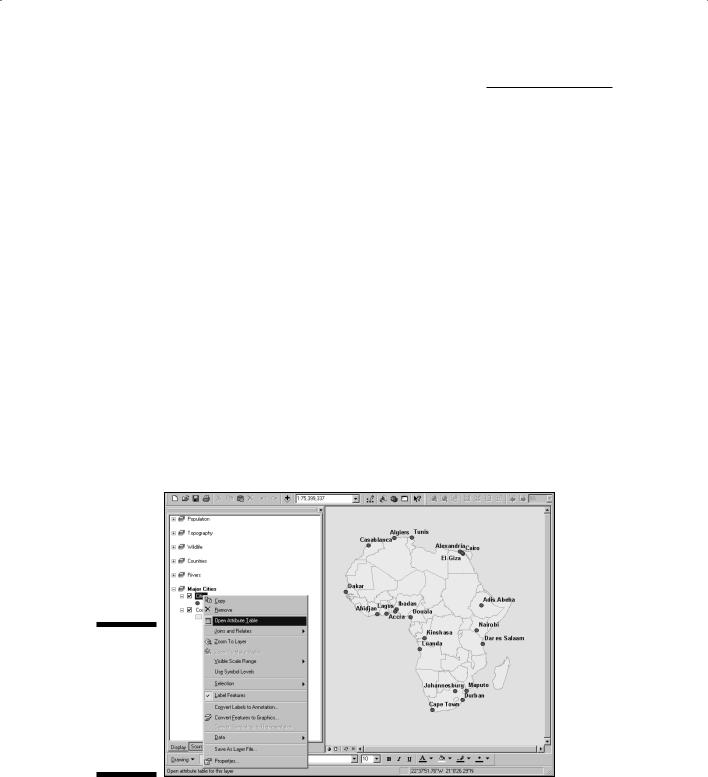
In ArcGIS, I right-click the theme so that the table containing the attributes appears. I see some pretty impressive sets of numbers there (see Figure 10-4). Your software may have a different way of viewing the tabular data.
154 Part III: Retrieving, Counting, and Characterizing Geography
4.Open the query tool.
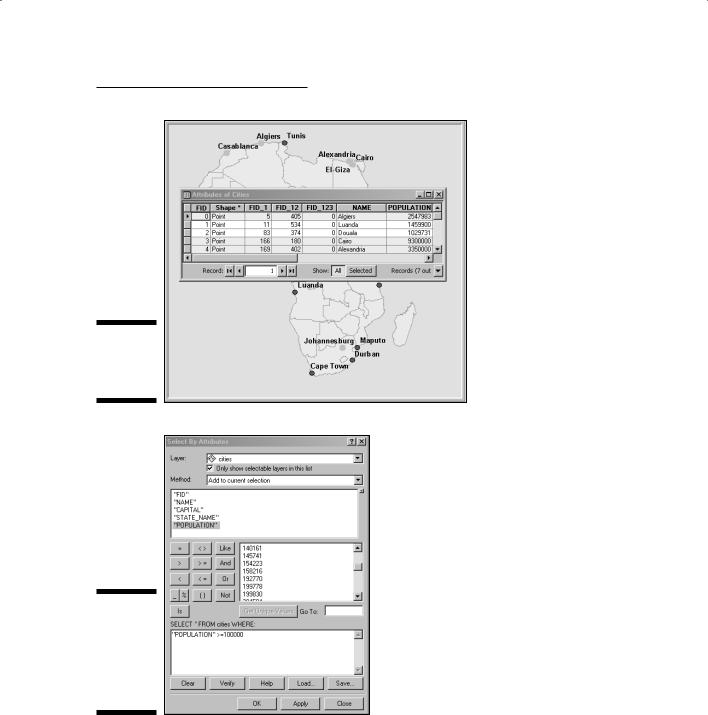
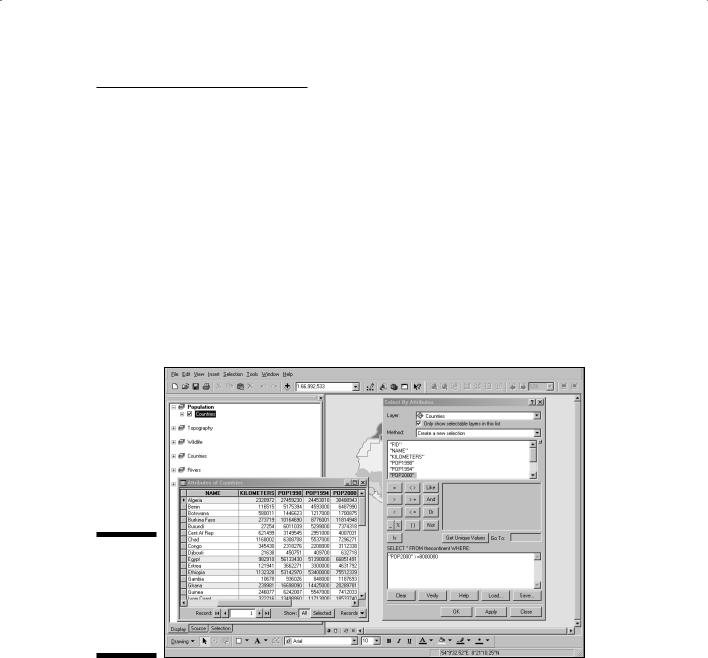
The search tool within ArcGIS has its own built-in SQL language. I open the search tool by choosing Selection Select by Attributes. This cool tool, shown in Figure 10-5, does two things that are pretty standard for GIS SQL tools:
•It lists all the categories of data in the database (so that you don’t have to know all the categories).
•It enables users to formulate a search strategy based on their criteria.
5.Formulate the query.
In this step, SQL jumps in to help. The interface you use may have drop-down lists to select from, check boxes to select, and so on. In this instance, I want to see only those African cities that have a population I specify. When I select the criteria, the ArcGIS software actually reproduces what I type and puts it in a little box at the bottom of my screen.
6.Apply the query.
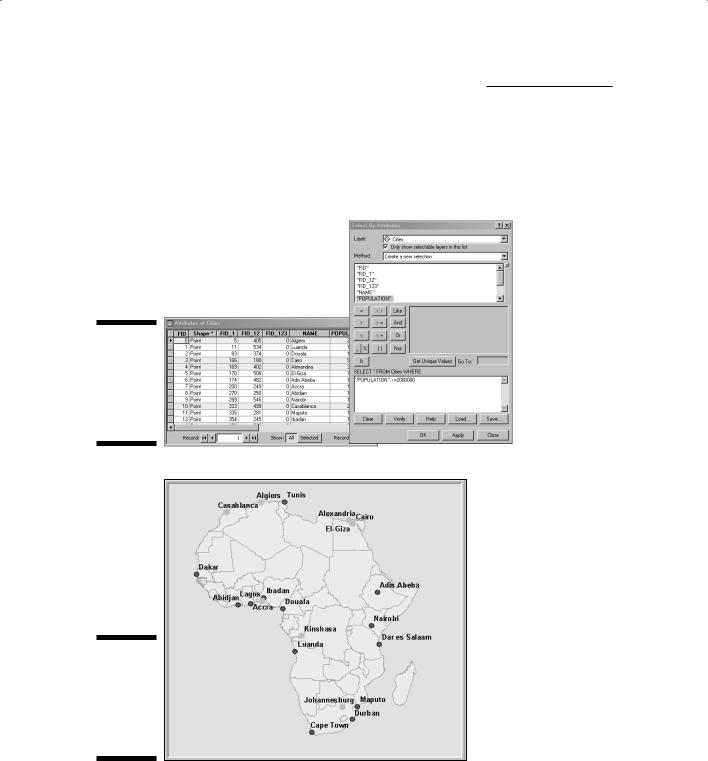
Your software may have a button to click to apply the query. In the ArcGIS software, I simply click the Apply button to apply the query. And after I do, the cities I selected based on my criteria are highlighted in the table, as shown in Figure 10-6.
Figure 10-3:
This map of Africa shows the country outlines and the major cities as points.
Chapter 10: Finding Features in Vector Systems 155
Figure 10-4:
A table of attributes in ArcGIS.
Figure 10-5:
The SQL tool inside ArcGIS lets you pick your search criteria.
7.View the results.
Your GIS may show the query results on the map immediately after you apply the query. Or you may have to do an extra step, such as perform a map retrieval or map display operation, to see them. After I apply the
156 Part III: Retrieving, Counting, and Characterizing Geography
query in ArcGIS, I can remove the table from view by either moving it aside or clicking the Close button. Then, all the cities I selected appear highlighted on the map, as shown in Figure 10-7. Because the map and the table are connected, what I select and highlight in the table is also selected and highlighted in the map.
Figure 10-6:
The cities that fit the criteria are now highlighted in the table.
Figure 10-7:
The cities highlighted in the table are also highlighted in the map.
Chapter 10: Finding Features in Vector Systems 157
You can perform this type of search for other features (such as lines and polygons) in the GIS, as well. With the database from the preceding example, you might do a quick analysis of country (rather than city) populations for African nations. After clearing all the point search selections, you could follow pretty much the same process to search for polygons (the countries) as in the example with points (the cities).
Suppose you want to see all countries in Africa that have a population of 8,000,000 or more. In the ArcGIS, you highlight the Countries theme (selecting the map from which you want to search for your population attributes), and then open your table. Next, use the selection or search tool to create a query that searches the Countries theme for countries that have a population of 8,000,000 or more. Apply the search. The countries satisfying your criteria are highlighted on the table, and the map also highlights the selected countries (see Figure 10-8).
Figure 10-8:
Countries are highlighted both in the table and on the map.
Keeping your searches
You can create some really cool layers just by searching for data and then, displaying what you find. And, you save and copy them in case you want to use them again. Each software package works a bit differently, but all enable you to save to the database the layers you create with your searches. For example, some programs use a Save button that has a picture (such as an image of a floppy disk); others use drop-down lists; and so on.

158 Part III: Retrieving, Counting, and Characterizing Geography
To copy the layers you create in the ArcGIS software, follow these steps:
1.Find your layer in the list on the left of the screen.
2.Right-click the layer name.
A pop-up menu appears. One of the menu options enables you to save the layer as a new layer (a copy, if you like). Here’s where you have some control over your ability to find the right layers in the future. If you call your creation Mylayer, that might be an accurate name, but it doesn’t really tell you much about the layer you created. What happens after you create ten layers and name them Mylayer01, Mylayer02, up to Mylayer10? The numbers don’t even hint at the layers’ content, and so the names don’t help you find the right layer when you return next week to review your work.
3.Select Save as Layer from the pop-up menu, select a folder to hold your layer, and type a descriptive name when prompted.
Developing a naming convention for your layers, even the intermediate steps you’ll eventually get rid of, can help you keep track of them. Make the names descriptive of either the layer’s thematic content (for example, oaktrees developed from a search of a layer called trees), or the its potential use (such as interimslopes for a data layer of all slopes between 15 and 45 degrees that you’ll tweak and eventually rename as a new layer called goodslopes).
What’s my line?
Although both raster and vector systems can represent lines, the vector data models are much better at displaying lines’ one-dimensional nature. More important to you, lines on maps represent features such as transportation networks. These networks allow you to model the movement of transportation vehicles, such as cars and trains. Companies use routing programs to plan routes for the delivery of mail and packages. GIS can track GPS-enabled UPS and FedEx trucks along their routes and efficiently direct nearby trucks to on-demand pickup locations. In fact, most goods and services will eventually travel along some form of ground transportation network that’s determined or monitored by some form of GIS.
Also, GIS helps with other important tasks related to entities that show up as lines on maps. For example
Finding the fastest route for a firetruck to get to a fire
Determining where a bus needs to go to pick up the most students
Finding out the amount of water flowing through sections of a river or stream (another entity easily represented by a line on a map)

Chapter 10: Finding Features in Vector Systems 159
Estimating how much and what kinds of vegetation might occur near a river or stream as determined by the amount of water available.
Evaluating the size of a waterway to determine whether boats can navigate the river
Before you can model transportation or examine the ecology of streams, you need to be able to retrieve and access the pieces of the network and the tabular data that are linked to those features. The selection and retrieval process is easy. In fact, the preceding sections show you how to retrieve population data (a human-related feature) by using points (African cities) and polygons (African countries). Follow these steps to retrieve line data, rather than point or polygon data:
1.Open your database.
For my search, I use the map of Africa and its associated attributes (which I discuss in the preceding sections).
2.Highlight the theme that you want to search.
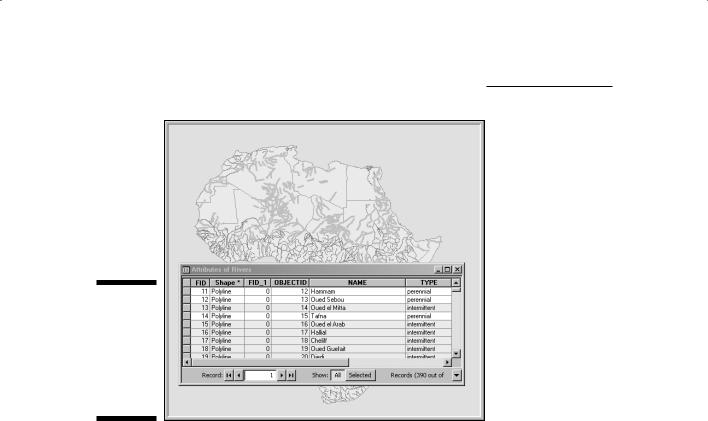
I want to know which of the many rivers in Africa are navigable because I want to move some equipment along the rivers for my scientist friends. To find the navigable rivers, I choose the theme called Rivers.
3.(Optional) Open the table for that theme to examine the data.
I might take a peek at the tables to make sure the attribute I’m looking for is in them. In this example, the attribute I need is Navigable.
4.Open the query tool.
5.Formulate the query.
I use my SQL search engine from the selection tool menu and create a search that looks for all rivers that are listed as Navigable.
6.Apply the query by clicking the Search button and using the Select by Attribute menu.
7.View the results.
The table highlights the features I want. In my example, the navigable rivers show up as thicker lines and correspond to the highlighted rows in the table (Figure 10-9).
You can find all sorts of points, lines, and polygons just by letting the SQL search engine rummage through your tables to find just what you want. The location of your study area doesn’t matter. As long as you have a GIS system that has points, lines, and polygons — and the correct associated attributes — you can find the data you’re looking for.
160 Part III: Retrieving, Counting, and Characterizing Geography
Figure 10-9:
The highlighted navigable rivers both in the tables and the maps.
Searching Vector Systems using Geography
In Chapter 9, I describe some successful strategies for finding geographic features and distributions. Two of those methods — graphicand location-based searches — are often combined in vector GIS.
You might assume that the primary purpose of GIS’s computer map display is for output, but making that assumption does a huge disservice both to the software and to you. If, as the examples in the preceding sections demonstrate, the tabular data that you used SQL to retrieve are explicitly linked to the graphic display, then you must be able to search the tables by starting with the graphic.
I can use the graphic interface to find things in my favorite Africa database (which I use in the preceding sections). Suppose I want to study the African countries for which I have data on major cities. Visually, I can see these countries because each country that has a major city is visible. But I want to create a map that highlights those countries, and I want tabular data for some later analysis.