

GIS For Dummies
.pdfChapter 4: Creating a Conceptual Model |
61 |
Defining Your Map’s Contents
Before you create a map, whether it’s analog (hard copy) or digital (electronic), you first need to be aware of the geography that you want to include. What elements you put into the maps, and what maps you put into the GIS, ultimately determine the effectiveness of your analysis.
Each particular subject has many kinds of geography associated with it. For example, you might be working with economic geography, medical geography, transportation geography, urban geography, and physical geography — and literally hundreds more. Each geography relates to the types of data you want to use in your own projects. So, for example, suppose you’re using GIS to improve the productivity of your stores — you rely on these geographies of your area:
The economic geography: Points out economic factors — such as average income of shoppers in your area — that apply to your stores
The transportation geography: Gives you an understanding of the transportation systems that people use to move to and from your stores
The physical geography: Helps you understand what impact climate and weather have on what you sell and when
Your mission, should you choose to accept it, is to pick the most appropriate geographies and the most useful parts of those geographies to build your GIS and its component maps.
Choosing a theme to map
I have a very simple trick that I use to decide what map or maps I’m going to include in a GIS. First, like with any project, I define the final product. If you plan to use GIS to define pieces of land that you can use for a housing development, for example, your final map should show you a list, preferably
prioritized, of possible locations for your land purchase. To outline the specifications for the content of the final map, you ask yourself these basic questions:
How big a piece of land do you need?
How much are you willing to pay for the land?
What are your locational constraints? Where would you prefer the land to be?
What are the legal constraints — such as zoning and ownership — for developing your land?
What physical constraints on the land are you willing to accept?
What are the infrastructure needs for this development?

62 |
Part II: Geography Goes Digital |
Your answers to the preceding questions suggest what data you need to put into the computer so that you can produce the final map you need:
You need a map that includes all the known land parcels so that the software can measure the size of each for you and find parcels that fit within your size requirement.
A map that includes the current sale price of the land allows the GIS to find parcels of land that are in your price range.
If you need land near hospitals, schools, the mountains, or other features, maps for each of these features can help you measure proximity to them.
Maps of zoning help you determine whether the land is zoned for residential development or whether you need to get a zoning variance to build there. You also want a land ownership map so that you know from whom you need to purchase the land, or even whether you can buy it at all.
You can map topography, soils, vegetation, bedrock, and other physical factors, and each factor provides important information that you can use to decide how much land manipulation you need to perform to develop there.
Maps that show availability of power, water, curb and gutter, and telecommunications systems help you understand if you have to pay to have these infrastructures put in.
By starting at the final product, you can break the final map down into the individual data component that are required to construct it. In the preceding example, you specify the details by asking questions about what you need to know to buy a parcel of land for development. You then translate your questions into the individual mapped features that you need to answer those questions.
Applying the methodology to any GIS project
If you don’t want to purchase land, or build homes, or anything related to real estate, you may be wondering if the example in the preceding section even applies to you. What if you’re trying to locate a new store, find the best place to establish a wildlife preserve, determine where crime is most likely to occur, or predict the risk of exposure to a hazardous waste cargo spill? Each scenario, no matter what the subject matter, still asks some question about location — where features are, where they could be, and/or where they should be.

Chapter 4: Creating a Conceptual Model |
63 |
Most major GIS decision-making operations deal with the locations or distributions of features. Sometimes, you use GIS to describe the impact that existing locations or distributions have, and other times, you use it to make decisions about where you want or need to put things such as businesses, public facilities, services, research facilities, personnel, or almost anything you can think of that occurs on the Earth. So, whatever your application, the methodology applies.
No matter what topic you’re mapping, you can best begin by specifying what you want as the final product. When you know what your final map should consist of, you can separate and categorize its relevant parts.
Breaking down the data you want to include
Each of the maps you select to include in a GIS database is composed of preselected geographic features, and each of those features has various geographic data associated with it. In some cases, you need all the data about a particular feature, and in other cases, you need only a selection.
Consider the housing development example from the section “Choosing a theme to map,” earlier in this chapter. You might find a map of the soils in your development area useful, but you really don’t care about the name of the soil nor whether it conforms to the latest soil survey classification
methods. You do want to know about the engineering properties of the soil, however. Can the soil support housing, or do you have to bring in soil from somewhere else? If you have to build a septic system, does the soil support that activity?
At this point in the model-creation process, you need to outline details of your project and ask the specific questions that tell you exactly what data you need from the thematic maps you’ve already chosen. The housing development project involves more than just land, and you need to outline all the pieces to end up with a complete database for your GIS. By creating this outline, you break the problem into neat chunks that you can more easily work with.
Say that you want to find a place to locate a bird sanctuary as part of your housing development, so you need to find a chunk of land that meets your project requirements of availability, size, price, location, accessibility, and usability. You have the following map themes at your disposal to help you find the right location:
64 |
Part II: Geography Goes Digital |
Land ownership: From the land ownership map, you can extract which owners you need to contact after you find out whether their land is
for sale. You may not be able to buy from certain land owners, such as Federal and State government agencies. So, you want to separate out private land from public land.
Land for sale: This map tells you which parcels of land are actually for sale, how big they are, and (hopefully) the price per acre. Your goal is to find a parcel of at least 20 acres that costs less than $2,000 per acre. And you want a single parcel of 20 acres, not a bunch of little parcels that add up to that size.
City limits: Because you want to have people visit the sanctuary, you want it to be near (less than 5 miles from) town. To know how far your sanctuary would be from town, you need a map that shows the city limits.
Transportation: Being close to town doesn’t help you if you have no transportation system. And you want people to be able to travel on twolane or wider roads (for example, highways). These require you have a transportation map so you can compare the locations of parcels to the locations of the roads.
Utilities: You want to have electricity, gas, and water available at the bird sanctuary site. This requires a map of utilities so you know how far away potential land parcels are from them.
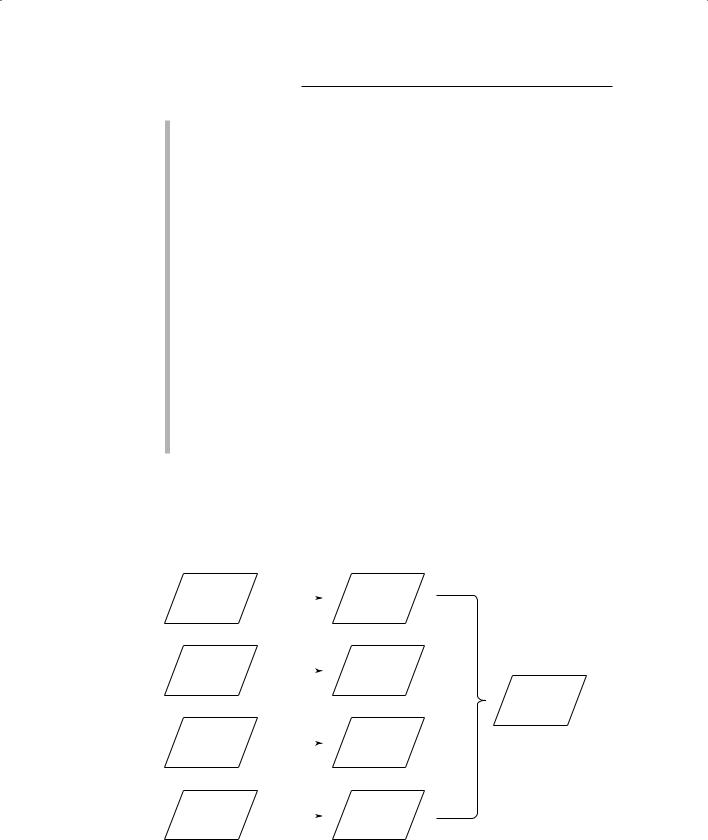
Figure 4-1 shows a flowchart of the process you go through to break down your project details and relate them to the information in your thematic maps. The final map (the bird sanctuary) is on the right, and you can see all its components on the left. Table 4-1 also shows a breakdown of project details, with the questions you ask along the way to identify the data you need to select.
|
Land |
|
Land for |
|
Ownership |
|
Sale |
|
City |
|
Within 5 |
|
Limits |
|
Miles |
|
|
|
Bird |
|
|
|
Sanctuary |
|
Transport |
|
Good Roads |
Figure 4-1: |
|
|
|
A GIS model |
|
|
|
flowchart |
|
|
|
for a bird |
Utilities |
|
Utilities |
sanctuary. |
|
Present |
|
|
|||
|
|
||
|
|
|
|
|
|
|
|

|
|
|
Chapter 4: Creating a Conceptual Model |
65 |
|||
|
|
|
|||||
|
|
|
|
|
|||
|
Table 4-1 |
Selecting Data from Map Themes |
|
||||
|
|
|
|
|
|
|
|
|
Project Detail |
Theme |
Questions to Ask |
Data to Select |
|
|
|
|
Land that can be |
Land |
Is the land pub- |
Privately owned |
|
||
|
purchased |
ownership |
licly or privately |
land |
|
||
|
|
|
|
owned? |
|
|
|
|
|
|
|
|
|
|
|
|
Land that’s |
Land for sale |
Which parcels |
Parcels for sale |
|
||
|
suitably sized |
|
|
are for sale? |
Size is at least 20 |
|
|
|
and priced |
|
|
How big are the |
|
||
|
|
|
acres |
|
|||
|
|
|
|
|
|||
|
|
|
|
parcels? |
Cost is less than |
|
|
|
|
|
|
How much do |
|
||
|
|
|
|
$2,000 per acre |
|
||
|
|
|
|
they cost? |
|
|
|
|
Land that’s |
City limits |
How far are the |
Parcels within 5 |
|
||
|
appropriately |
|
|
parcels from the |
miles of city limits |
|
|
|
located |
|
|
city limits? |
|
|
|
|
|
|
|
|
|
|
|
|
Land with access |
Transportation |
What kinds of |
Parcels acces- |
|
||
|
to adequate |
|
|
roads provide |
sible by 2-lane or |
|
|
|
transportation |
|
|
access to the |
wider roads |
|
|
|
|
|
|
parcels? |
|
|
|
|
Land with public |
Utilities |
What utilities |
Parcels that have |
|
||
|
utilities available |
|
|
are available for |
access to public |
|
|
|
|
|
|
which parcels? |
water, electricity, |
|
|
|
|
|
|
|
and gas |
|
|
Verifying your data’s characteristics
The preceding sections show you how to select appropriate map themes and then divide those themes into the individual data components that you need to match project details and answer your questions. So, you’ve identified the data components, but you need to know a little more about how those components are represented in a GIS as data.
Each digital thematic map is part of a larger group of digital maps that you use to answer your GIS question. Each map has features represented by points, lines, areas, and volumes that contain useful information for you. If you’re just starting your current GIS decision-making process, you need to know what data you have in the GIS database in the first place. And you also need to know the characteristics of those data, including
Level of data measurement: The data measurement available in the GIS can be nominal, ordinal, interval, or ratio. (See Chapter 3 for an explanation of these data measurements.)

66 |
Part II: Geography Goes Digital |
The level of detail: The scale of the mapped data helps you determine the level of detail available (larger scale gives you greater detail) and how the features are represented. A feature that looks like a point on a small-scale map probably shows up as an area on a mediumor largescale map. (Check out Chapter 2 for more on the importance of scale.)
All the questions you ask and answer to outline the GIS data you need are specific to your own project. My basic rule of thumb is to be comprehensive with your questions so that you can select the best, most complete set of data possible. You can generalize from detailed data much more easily than you can get specifics from general data.
Converting from Map to Computer
Computers can help you map your study area and analyze those maps, but only if you plan carefully what data you include and how you input that data into the computer. When you select your map’s content, you include the specific point, line, area, and surface features that can answer your project questions. But your computer doesn’t know as much as you do about maps.
In GIS terms, polygon refers to area, and surface means that a feature has a third dimension (for example, height).
Deciding how to represent your map
Cartographers use two general data forms that translate the map into digital form: raster (little squares or grid cells) and vector (or points, lines, and polygons). So raster data resemble a chessboard, and vector data resemble line drawings. Most GIS software today can handle both types of data, so don’t panic about which GIS software you need based on the type of data you want to use. Each conceptual model base (raster or vector) brings with it a unique set of tools, levels of accuracy, ways of modeling, and advantages and disadvantages, as covered in the following sections.
Picking a raster-based model
Understanding how raster-based GIS software is constructed and how the databases work with it is really pretty easy. This method will probably make perfect sense to you when you conceptualize your raster model. Before you know it, you’re thinking like a chess master, seeing squares everywhere and relating them to your next GIS move.

Chapter 4: Creating a Conceptual Model |
67 |
Think of raster, or grid cell, GIS like a checkerboard or chessboard. Each square is a single grid cell, and each grid cell represents a portion of the Earth. When mapping, you assume that portions of the Earth are square for simplicity, and the GIS software can adjust the Earth coordinates for this assumption.
Raster GIS represents all forms of geographic features by using square grid cells, each of which represents a portion of your map. You can conceptualize each of these grid cells as a part of a checkerboard. The following bullets take you through the thought process for each feature type:
Points: In a conceptual model of geography, points have no dimensions (length or width). Of course, you have to take liberties to use grid cells to represent dimensionless points because grid cells do have both length and width. If you make these grid cells really, really small, like the dots on a TV screen, this whole idea is a bit easier to accept.
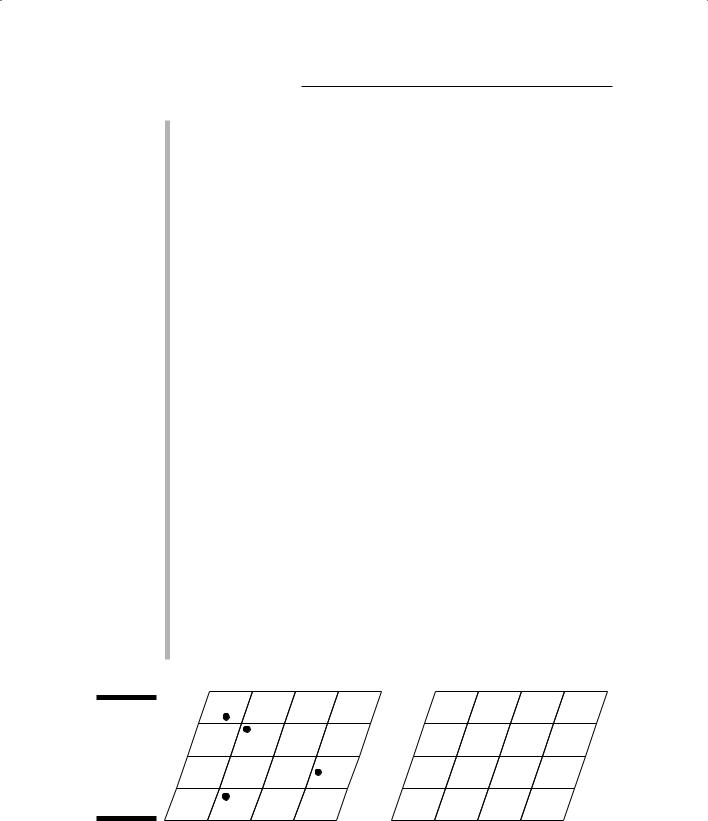
So, if you think about raster GIS as a checkerboard, a single grid cell is a point object (see Figure 4-2), such as a church, mosque, or syna-
gogue. Each different type of place of worship, such as churches, has a unique grid cell color on the raster map that’s associated with a different number inside the computer. So, unlike a checkerboard, you can have more than two colors of squares. Say that you use the number 1 to represent churches, 2 to represent mosques, and 3 to represent synagogues. These different types of features all have something in common — each represents a place of worship associated with a common theme or map layer. This common characteristic limits the number of different codes and colors that you might need for your map of point features.
Lines: In grid cell–based GIS, a string of grid cells represents a linear object (such as a road, a railroad, or a walking path). This string of cells can be lined up orthogonally (edge to edge), diagonally (along the corners), or some combination, depending on how curvy the feature is. Line objects are considered to have only one dimension (length), even though they usually have some width in the real world. So, when you use grid cells to represent lines, you have a bit of the same problem you have with point features — you have to use a symbol that has area to represent an object that doesn’t.
Just like with point features, on a raster map you use different colors or patterns for each line category (see Figure 4-3), and the computer associates those colors or patterns with particular numbers. So, when you input these, you might have the computer program assign roads a value of 1, railroads a value of 2, and walking paths a value of 3. All three of these features share a common theme — in this case, transportation.
68 |
Part II: Geography Goes Digital |
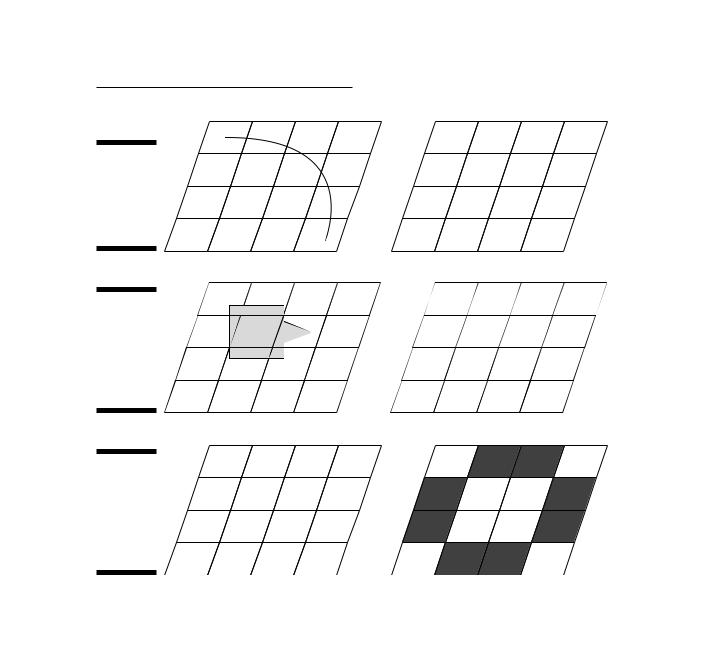
Areas (polygons): The grid-cell system can easily represent areas. The computer symbolizes each unique area — for example, crop types such as corn, soybeans, and potatoes — as a single grid cell (if the area is small enough) or a group of grid cells, as shown in Figure 4-4. And these cells may be connected (contiguous) or disconnected (noncontiguous). The size of each grid cell corresponds to a certain area of
land. So, if a single grid cell corresponds to a land chunk that measures 10 meters on a side, that cell represents 100 square meters (10×10 meters) of land area.
Like with point and line features, each crop type shows up on a raster map as grid cells that have a common color, shade, or pattern, and each type has a unique number associated with it inside the computer. In the crop example, you might use a value of 1 to represent corn, 2 for soybeans, and 3 for potatoes.
Surfaces (volumes): When you’re representing surfaces or their volumes, each grid cell has, in addition to length and width, a number associated with the height or depth of the space. This number may represent elevation above sea level or depth to groundwater for a point at the center of a grid cell. In some GIS, grid-cell values even represent nonphysical surfaces, such as population density or land appraisals.
Grid cells that represent surfaces have so many possible values that each grid cell may have its own unique number. To go along with this number, on a raster map, you could give each grid cell an equally unique color or shading pattern. But if you do, you soon find that — with so many different looks — you can’t really distinguish one from the other.
To make the task of assigning numbers a bit easier, the GIS software usually allows you to designate surface values by groups. For example, if you want to represent elevation, you might have one group of grid cells that ranges in elevation from 0 to 1,000 feet, another group that ranges from 1,001 to 1,500 feet, yet another group that ranges from 1,501 to 2,000 feet, and so on. When you display your grid cells that represent the range of values (like in Figure 4-5), you can actually distinguish among the various elevations. You have control over how you group values to represent surfaces, but the computer still keeps all the myriad original unique values intact.
Figure 4-2:
The point features on the left are represented as grid cells on the right.
Chapter 4: Creating a Conceptual Model |
69 |
Figure 4-3:
The line on the left is represented as grid cells on the right.
Figure 4-4:
The area feature on the left is represented as grid cells on the right.
Figure 4-5:
Surface features on the left are represented as grid cells on the right.
Raster GIS represents points by using a single grid cell, lines by using a line of grid cells, areas by using a group of grid cells, and surfaces by using groups of grid cells that have additional unique values.
Choosing a vector-based model
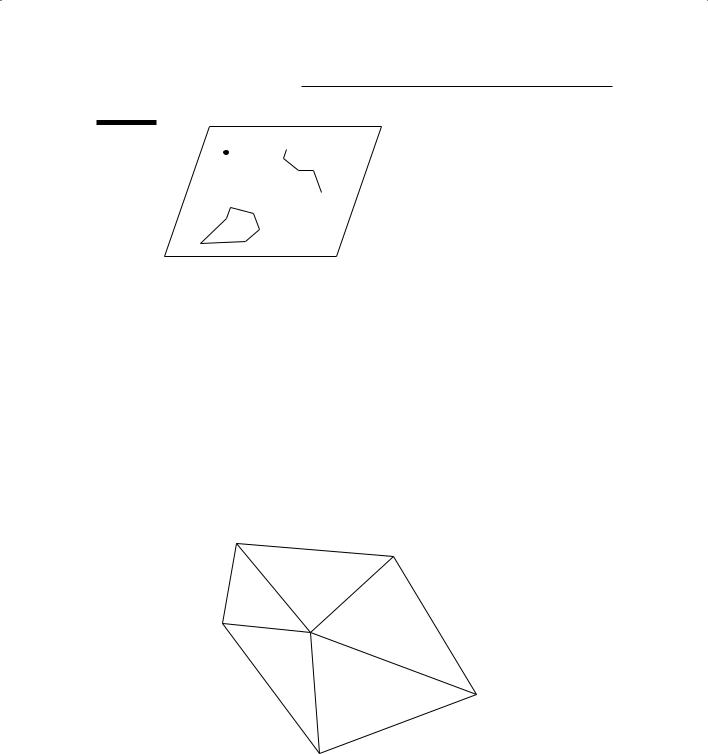
In a vector-based conceptual model, representing point, line, and area features is pretty straightforward. The vector data structure represents each point object by a single X and Y coordinate pair, each line by a set of two or more X and Y coordinate pairs, and each area by at least three lines that create a closed figure (the lines’ start and end points coincide to create closure, as shown in Figure 4-6).
70 |
Part II: Geography Goes Digital |
Figure 4-6: |
|
(X,Y) |
(X,Y) |
|
The |
|
|||
|
(X,Y) |
(X,Y) |
||
vector data |
|
|||
structure, as |
|
|
(X,Y) |
|
|
|
|
||
represented |
|
(X,Y) |
(X,Y) |
|
by X and Y |
|
(X,Y) |
|
|
coordinate |
|
(X,Y) |
|
|
(X,Y) |
(X,Y) |
|||
pairs. |
||||
(X,Y) |
|
|||
|
|
|
||
|
|
|
|
|
Representing surfaces or volumes by using vector data is a bit more difficult than representing points, lines, and areas, but the GIS industry has a well-established and commonly used data structure. This data structure, the
Triangulated Irregular Network (TIN), represents surfaces and volumes as a collection of non-overlapping triangles, which is very similar to the way that computer games model 3-D objects. The vertices (points) of each triangle have unique X, Y, and Z (height) values, but each group of three vertices creates a triangular plane whose surface has a unique angle and direction (as shown in Figure 4-7).
The neat thing about the TIN model is that you can use it to predict (interpolate) missing values, create cross sections through surfaces and volumes, draw contour lines, and create 3-D visualizations, just like its raster equivalent data model (see Figure 4-5).
A (X, Y, Z)
B (X, Y, Z)
Figure 4-7: |
F (X, Y, Z) |
C (X, Y, Z) |
|
||
|
|
|
The |
|
|
Triangulated |
|
|
Irregular |
|
|
Network |
|
D (X, Y, Z) |
(TIN) model |
|
|
of non- |
|
|
overlapping |
|
|
triangles. |
|
E (X, Y, Z) |
|
|
|
|
|