

GIS For Dummies
.pdfChapter 1: Seeing the Scope of GIS |
21 |
Planning city operations and expansion
City, county, and regional planning has long used GIS to track development, zone land parcels, assess available resources, and plan for future growth. GIS allows planners to evaluate master plans, monitor expansion and traffic patterns, predict change, monitor population, and even decide the best place to put the new government planning office. Many GIS operations across the world are called planning departments, not GIS departments. But they often use GIS as their primary tool.
Providing protection and emergency services
Police, human services, and emergency services (the Enhanced-911 call-rout- ing service, for example) are beginning to use GIS. Crime mappers can identify crime hot spots and move officers where needed, corrections officers can track their parolees, hospitals can be placed where they meet the most need, and dispatchers can route emergency services (such as ambulance and fire) to their destinations — all with the power of GIS.
Land management and conservation
The first major implementation of GIS managed the enormous expanse of Canada’s natural and mineral resources. In this and similar applications, the software can help monitor fires and dispatch firefighters, monitor and manage disease and insect outbreaks, control land use and land inventory, select setasides and easements, track and manage wildlife, plan for ecotourism, and much more. Combined with today’s expanding complement of Earth-sensing satellites, the role of GIS in land management is sure to continue to expand.
Military and defense-related tasks
The military and intelligence communities are taking advantage of the GIS toolkit, which includes tools specifically targeted to those users. By combining top-secret satellite data and visual evaluation from unmanned aerial vehicles (UAVs) with the power of GIS and existing datasets, defense departments can evaluate troop movements, target artillery fire, test scenarios, perform supply and logistics operations, and monitor borders. The military and intelligence communities often rely on the same geospatial tools available to the general public — but they have exclusive access to certain data and data sources, as well as some additional and quite sophisticated software.

22 |
Part I: GIS: Geography on Steroids |
A treasure chest of possibilities
Really, the potential uses of GIS have no limit. Jack Dangermond, the president of Environmental Systems Research Institute (ESRI), has been quoted as saying, “The application of GIS is only limited by the mind of the user.” I’ve seen GIS used to reconstruct American Revolutionary War battles, follow the Salem witch trials, track debris from falling space equipment, assist hotline psychics (yes, you read that correctly) with profiling their callers, monitor honey bee movement, control farm equipment, tell ranchers where to move their livestock, and plan interesting entertainment sites.
While traditional applications of GIS technology remain the mainstay of the industry, GIS uses continue to expand. GIS capabilities also continue to
increase while humanity’s knowledge of geography grows and people encode that knowledge into databases and GIS algorithms. If you’re getting into GIS now, you’ll probably spend much of your time figuring out both the concepts that drive GIS and the new software that keeps coming out — just when you think you know what to do with your existing software.
If you enter the term geographic information systems in an Internet search engine, such as Google (www.google.com), you retrieve well over 11,000,000 hits. You may find the volume of information a bit overwhelming, but you can keep up with all the many changes by looking to GIS faculty at colleges and universities, GIS company Web sites, and online GIS communities.
You get over 50,000,000 hits if you enter the keyword GIS in an Internet search engine, but many of the results you get deal with U.S. military GIs, not geographic information systems.

Chapter 2
Recognizing How Maps
Show Information
In This Chapter
Familiarizing yourself with the basic elements of a map
Knowing when to use reference versus thematic maps
Understanding how mapmakers flatten the Earth and measure it
Navigating around your maps
Maps are a compact and elegant method of communicating information. Most folks have used maps in one form or another for a variety of pur-
poses. You’ve probably used road maps to help you find your way from one town to another and street maps to get around in a city or town. The maps in newspapers show what’s happening in different parts of the world. An atlas may be just the key you need to figure out the name of a mountain for a crossword puzzle. If a map is designed correctly, you can find much of what you’re seeking without any help at all, and you can interpret the data with little effort. This chapter sets you on course to understanding the sometimes complex, but usually intuitive, language of maps.
Knowing How Maps Represent
Geography
Like with any form of communication, you must apply some basic standards before a map can effortlessly communicate the information it contains. Even when you sketch a simple map on a piece of paper, the first decision you must make is how much space you need to create the map. You can think of this area as your map extent. When you use a GIS to either create a map or analyze map data, you make decisions about how much area you want
to work with. The area of your digital map is related to the actual amount of geographic space that you’re examining, but it’s much smaller than the

24 |
Part I: GIS: Geography on Steroids |
real geographic space. This relationship, called map scale, also determines how big you can make the graphic objects (symbols) and how many of those objects you can put on the map.
Understanding scale
Naturally, the portion of the Earth represented on a map is much larger than the drawing. The map and the Earth are at different scales. Scale determines how much or how little detail your map can hold.
You can often find a map’s scale represented by a graphic bar and a fraction that shows the relationship between the size of the map in the numerator (the fraction’s top part) and the size of the Earth in the denominator (the fraction’s bottom part). Using this mathematical approach, the smaller the fraction (one with a small numerator and a large denominator), the smaller the scale. The smaller the map scale, the larger the amount of the Earth that map represents.
To get this representation to work, the mapmaker (cartographer) uses a little trick or two. Instead of including all the detail of the Earth, he or she selects which objects to show and decides how much graphic detail of each object he or she can omit to save space while still expressing the necessary information. Table 2-1 — from the U.S. Geological Survey of typical map scales — shows the amount of the Earth that different map scales represent.
Table 2-1 |
Map Scales |
|
Scale |
1 inch represents approximately |
1 cm represents |
|
|
|
1/20,000 |
1,667 ft. |
200 m |
|
|
|
1/24,000 |
2,000 ft. (exact) |
240 m |
|
|
|
1/25,000 |
2,083 ft. |
250 m |
|
|
|
1/50,000 |
4,166 ft. |
500 m |
|
|
|
1/62,500 |
1 mile |
625 m |
|
|
|
1/63,360 |
1 mile (exact) |
633.6 m |
|
|
|
1/100,000 |
1.6 miles |
1 km |
|
|
|
1/125,000 |
2 miles |
1.25 km |
|
|
|
1/250,000 |
4 miles |
2.5 km |
|
|
|
1/500,000 |
8 miles |
5 km |
|
|
|
1/1,000,000 |
16 miles |
10 km |
|
|
|
1/2,000,000 |
32 miles |
20 km |
Chapter 2: Recognizing How Maps Show Information 25
Both the mapmaker and the map user need to know map scale so they can (respectively) create and read the map properly. I show how map scale affects your GIS operations in the section “Grasping the importance of scale,” later in this chapter.
Interpreting symbols
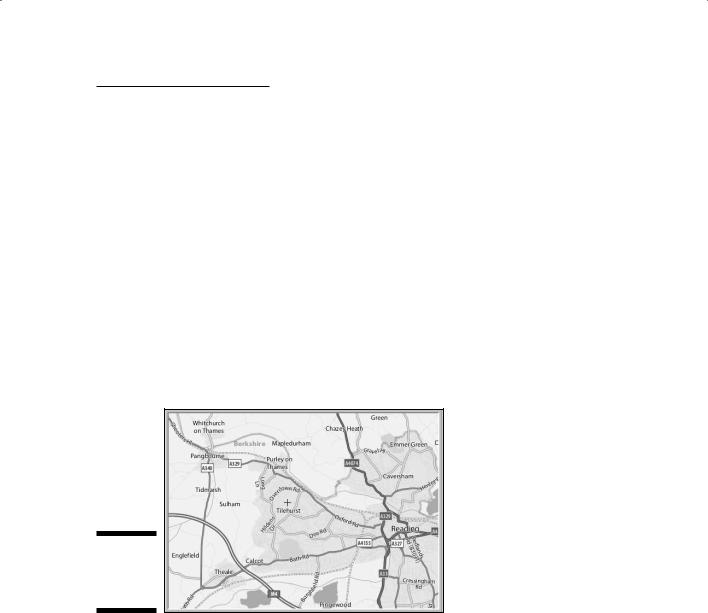
Shades, lines, shapes, and words are the language of a map. A map may contain various shaded lines, little white squares, circles, gray patches, words, letters, and numbers. You may find the number of symbols a little overwhelming. As a GIS and map user, you really need only to recognize that all the symbols do have a purpose on the paper. They don’t just happen (much to the chagrin of the people who have to make them). Cartographers plan out the selection, size, placement, and design of all these symbols before putting those symbols on the map. Figure 2-1 shows a road map, representing part of England, that contains various symbols.
Figure 2-1:
Symbols on a map of England.
At first glance, the map in Figure 2-1 may appear disorganized. But each symbol appears in a particular place because it represents some real-world feature that exists in more or less the same place on the Earth. For example, the city of Reading is on the right side of the map, and Pangbourne is to the left and up a bit. This positioning tells you that Pangbourne is north and west of Reading (if you assume that north is toward the top of the map). Because you can relate the symbols to the features they represent, you can quickly orient yourself to the map. Without ever visiting England, you can see how the various towns are arranged in space relative to one another. You can also see that lines, which represent roads, connect these point symbols.
Chapter 3 explains how to translate map symbols.
26 |
Part I: GIS: Geography on Steroids |
Incorporating symbols into your map
A map’s symbols show you what geographic features are represented on the map and where they occur. Cartographers use symbols that represent point features (such as towns), symbols that represent linear features (such as roads and rivers), and symbols that represent area features (such as lakes and towns). I know, I know — I said towns twice! How can towns be both points and areas?
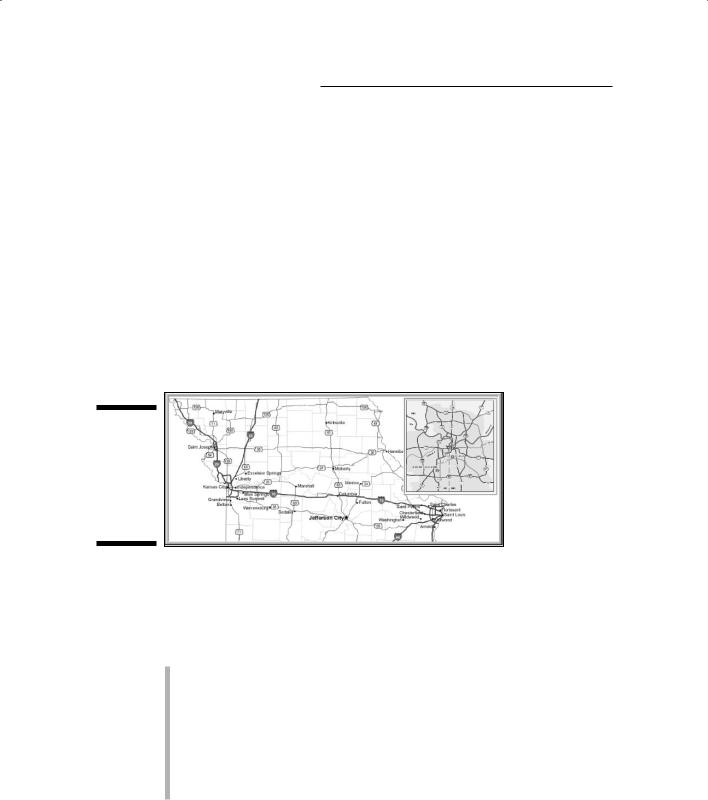
The short answer is that choosing the right symbol to represent a particular feature depends on a map’s scale. If you live in a big city, you might have a whole fold-out map to represent the area that your city occupies. That map is at a fairly large scale (perhaps 1:30,000) and is designed to show small areas in detail. If you look at your city on a map in a world atlas, however, that city may show up as a single dot. Figure 2-2 shows how the same geographic feature looks on maps of different scales.
Figure 2-2:
A city shown on largescale and
small-scale (upper-right inset) maps.
The cartographer has to decide when to represent area features as points and when to represent them as areas. One of the biggest headaches that cartographers deal with is deciding how to generalize map symbols to represent reality as best they can. The factors that they have to consider when they make such decisions include the following:
Scale: Determines how many geographic features can be symbolized on a map. When cartographers have tons of data to represent, their symbol choices have to take into account map readability. So, they make decisions to try to avoid symbol crowding. The cartographer has to decide which features to include, which to omit, which to simplify, and which to move to make room for other symbols.
Data availability: Determines what type of information can be put on the map. Cartographers can’t make up data (if they want their maps to be accurate, that is). For example, suppose that the cartographer wants
Chapter 2: Recognizing How Maps Show Information 27
to portray 12 land-use types on a 2008 land-use map, but has data for only 5 land-use types from 1968. In this case, he or she won’t be able to produce the 2008 land-use map without collecting more data.
Limitations of output devices: The cartographer also has to consider how symbols will print. He or she must know which features are most important to show (at the map scale to be used for printing) and plan the symbols to use accordingly.
Reader characteristics: Not all readers have 20/20 vision, color vision, or any vision at all. Moreover, some maps are designed to be read closeup (a few inches from your face) while others are displayed on walls and read from a distance. So, who reads the map and how they read it affect decisions about
•Whether to use color or black and white
•How large or small to make the scale, symbols, and fonts
•Whether to include tactile symbols for vision-impaired map users
Many traditional maps serve as input to your GIS, so all the generalizations that cartographers make impact the quality of the analysis that results from the system. Also, when you’re ready to produce your own maps (Chapter 19), you need to be aware of these issues.
Recognizing the Different Types of Maps
Anyone who creates a map must consider the content and subject of the map. He or she must assign a topic, or theme, to the map and set the individual details in the proper context. If you’re creating a map to your garden party, for example, you must include roads so that your guests know what pathways to travel. Landmarks and buildings may also help the reader get oriented to your part of town. You may also include text on the map, such as, “Turn left at the ugly purple house.”
In a technical conversation, words often have different or more precise meanings than in a general conversation. The context and the theme are just as important in mapping as in a general conversation. A map needs a unique context, a specific vocabulary, and a set of rules that pull all these parts together so that both the mapmaker and the map reader can understand each other and make the best possible GIS.
The easiest way to categorize maps is to separate them into two basic groups — reference maps and thematic maps, as described in the following sections.
28 |
Part I: GIS: Geography on Steroids |
Reading reference maps
Reference maps offer a great deal of information on a single document. Atlases generally contain reference maps so that many related maps can be contained in the same place. Reference maps often cover very large portions of the Earth, which means they’re created at small scales. Therefore, reference maps aren’t designed to provide extremely accurate depictions of locations. Instead, reference maps offer only the pattern and general locations of things.
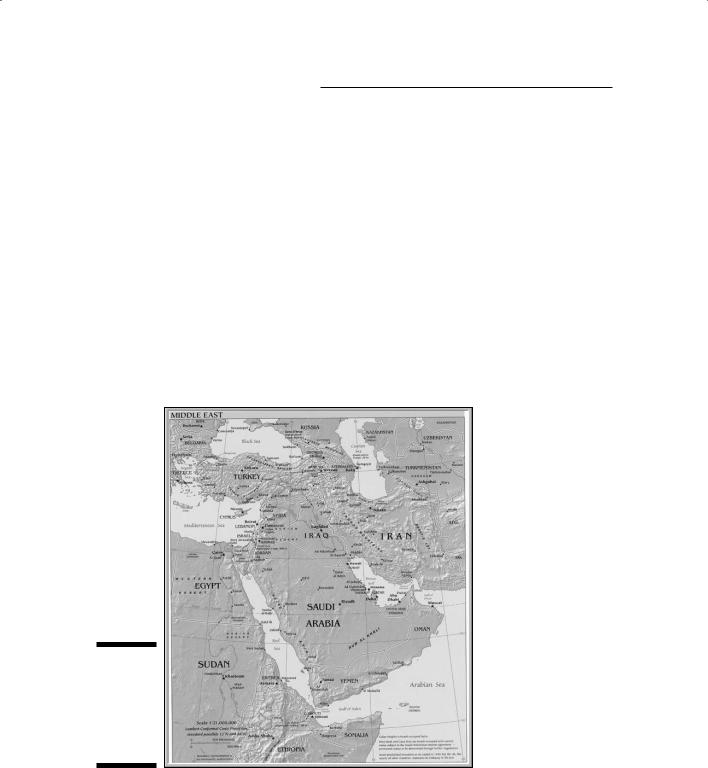
Reference maps also commonly contain several types of information on the same map. In this way, the map helps orient users to the geography of the area represented, as a whole. A typical reference map contains features such as regional borders; names of major cities; major transportation routes; and often prominent physical features, such as major rivers, lakes, and mountain ranges. Figure 2-3 shows a reference map of the Middle East from the CIA World Fact Book, which includes regional borders, transportation routes, and physical features.
Figure 2-3:
Reference maps may contain several types of information.

Chapter 2: Recognizing How Maps Show Information 29
Using thematic maps
A thematic map provides as much accurate, detailed information as possible about a particular subject, such as roads or hills, as compared to a reference map (discussed in the preceding section), which tries to select the most important information about several subjects.
When you view a reference map, such as the one shown in Figure 2-3, you can see a number of themes of data — in this case, regional, transportation, and physical features. The reference map doesn’t present these themes in much detail, and it doesn’t have the primary purpose of communicating specifics. For example, although the map includes transportation information, that information isn’t complete — it’s very general because of the small scale of the map, and the different types of routes aren’t clearly identified. This map wouldn’t help you much if you were trying to navigate within Saudi Arabia or Iran.
For navigating, you need a road map, as shown in Figure 2-1. A road map is one example of a thematic map because it focuses on communicating information about roads. Although such a thematic map might include a few regional subdivisions and other landmarks, the majority of the map is designed so that you know which roads are two lane and which are one
lane, which are dirt roads and which are superhighways, which are one-way streets and which are two-way streets, and so on.
Thematic maps are the primary kind of maps that you use in your GIS activities. Although you might find reference maps useful for some projects that involve large study areas, the small scale of reference maps usually limits their usefulness for analysis. The more familiar you become with the wide variety of thematic maps available to you, the more easily you can recognize which maps might assist you in your GIS work.
The list of potential thematic maps is staggering; here are a few examples:
Medical maps: Cancer mortality, spread of epidemics, and health hazards can be map subjects. Medical professionals may use such maps to determine characteristics of locations where some diseases occur, concentrate, and spread. Knowing these factors can help them in their goals to prevent or cure disease.
Hazardous material maps: These maps give transportation companies information about where trucks carrying hazardous material can travel, as well as the relative locations of people at risk (for example, the elderly or hospital patients).
Law enforcement maps: These kinds of maps show the police crime hot spots, locations of officers, crimes by time of day and season, and socioeconomic factors that might affect crime rates.
30 |
Part I: GIS: Geography on Steroids |
Utility maps: Gas and electric utility infrastructure maps can include data about the type of equipment, its condition and age, and many other factors affecting the energy companies’ ability to provide and sustain services.
If a feature appears or an event occurs on the surface of the Earth, it can be — and often has been — mapped.
Grasping the importance of scale
When compared to thematic maps, reference maps are often created on too small a scale to be particularly useful for GIS. But even thematic maps come in many different scales. A good rule of thumb is that the larger the map scale, the smaller the area covered and the greater the detail. Larger scale maps are generally better for your GIS activities because they provide the largest amount of detail.
If all maps were of the same highly detailed scale, you wouldn’t have to think about what scale a particular map uses. Unfortunately, you find many maps at many different scales. In fact, most GIS databases contain a lot data from differently scaled maps. Each map has more or less detail, more or less positional accuracy, and more or less information content. When you’re looking on a map for data to include in a GIS, the cartographer has already decided what to include and what to leave out, how to symbolize features, and how much to generalize the shapes used on the map.
GIS
Using a wide range of data
Thematic maps come in all sorts of sizes and shapes, and they can cover all kinds of different topics. Think about all the things that actually occur on the Earth, and you start getting some idea about the number of potential thematic maps. Here’s a short list of some of the kinds of maps that contain socioeconomic information and how you might begin to learn to recognize and apply these patterns for business:
Median family income: If you’re trying to start a business that sells expensive jewelry, you probably want to place your store in an area that has a high median family income.
Education level attained: If you sell technical books, you want to know where people with college degrees live so that you can locate near them.
Mean number of children under 5 years old:
If you want to sell baby clothes, you ideally want to establish your store close to large concentrations of people that have young children.
This set of examples uses a useful concept in geography — all things are related to each other in geographic space, but close things are more related than far things.