

GIS For Dummies
.pdfChapter 9: Finding Information in Raster Systems 141
The example in the first two bullets of the preceding list show that time can be a factor in your search. So, if time is coded into your database through layers derived from different time periods, you can search for locations and distributions that satisfy the time attribute code just as easily as any other code.
In a grid-based GIS, areas are comprised of groups of grid cells that share common code numbers. So, like with point and line features, the software begins by searching in the appropriate layer. Then, it identifies the groups of grid cells based on how you formulate your search for the existing codes.
Using the Software to Perform a Search
In raster GIS, you most often search by actually finding the categories within each layer rather than identifying the features as objects (for example, polygons or lines). You can search with your software’s query tools by making selections that pick out categories in each grid layer. And so, you most often search for the attributes contained in each layer by using a menu system rather than by finding the objects on the map itself.
You can also search for objects (for example, a group of cells representing a category you’re interested in) on the map by pointing at the cells themselves. But when you do, your search retrieves all the data for those cells and not just the particular category data you may be looking for.
Searching in simple raster systems
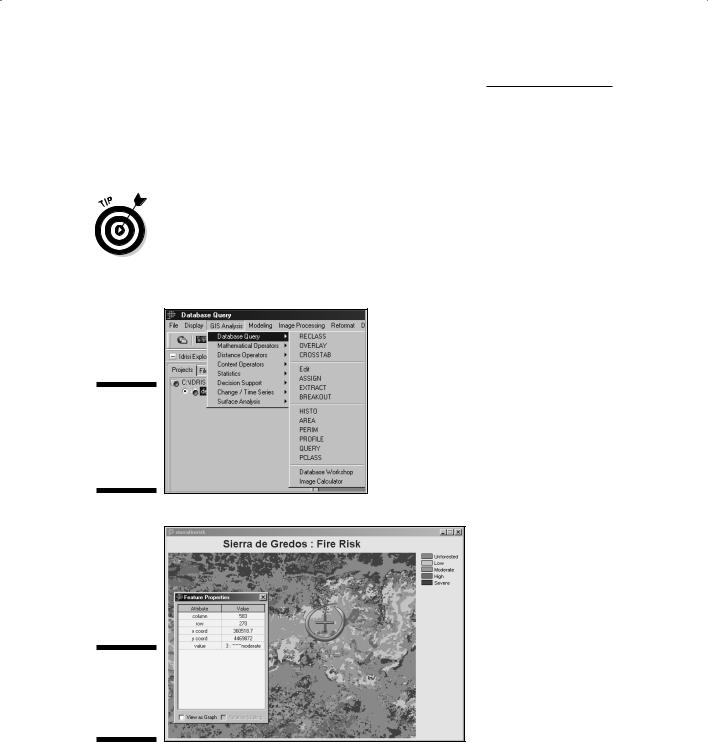
In simple raster systems, you look for grid cells to find collections of cells representing points, lines, or areas. The type of search strategy involves selecting the categories that you want to work with within each layer. This selection process is simple, and you often make selections by using a database query tool like the pull-down menu system shown in Figure 9-1.
The graphical search allows you to define a focused study area (sometimes called an area of interest) right on the map, and it captures the features associated within other map layers and produces a new layer. When you select an area of interest, the software doesn’t separate out different categories, but instead picks up everything that is contained in your area of interest. If you want to find individual categories by using the map, you can point to grid cells within each area you see (check out Figure 9-2), and the GIS provides you with the grid cell’s location and descriptive information about the category it represents.
142 Part III: Retrieving, Counting, and Characterizing Geography
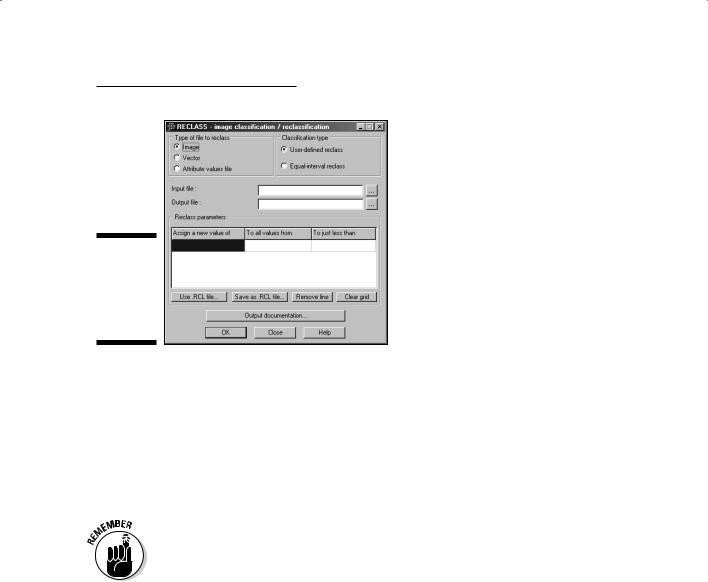
After you retrieve data from your search, you can decide to rename or reclassify it using the same user interface you used to locate it in the first place (see Figure 9-3). This multi-purpose interface gives you the power to pick and choose what you want to see and control how it’s grouped together.
Attribute searches in simple grid-based systems find the codes associated with each category or class of data directly. Because no DBMS tables are associated with these grids, the search is simple and often obvious because the categories and classes of data for each map show up in the legend. So by looking at the legend, you can easily see all the information that’s available (none of the attributes are hidden).
Figure 9-1:
A database query tool with pull-down menus.
Figure 9-2:
Getting a grid cell’s location and description.
Chapter 9: Finding Information in Raster Systems 143
Figure 9-3:
You can reclassify data you retrieve in GIS.
Searching DBMS-supported raster systems
Raster systems that have associated database management systems (DBMS) allow the same approach as vector systems to finding points, lines, and polygons. You can still perform searches based on spatial query, graphic, dimension, data type, and attributes. You can do dimensional searches in these more advanced grid-based systems because they have an associated DBMS, which you need for this approach.
The primary difference between the database supported type of system and the older, more basic grid-based systems is that the software can store and manage far more complex and detailed categories. The attributes aren’t limited by what the map legend can easily display. So, the attribute search is much more powerful with these systems than with their earlier counterparts.
For example, say that you have a forest map in a simple grid system. It contains a set of forest types, each of which appears in the map legend. The more advanced DBMS-supported system could have a set of supporting attribute information (such as age structure, fire frequency, fuel buildup, disease or infestation condition, treatment, estimated board feet, and so on) associated with each forest type. This association removes the need
to have a new map for each of these categories. And now you can search for pine trees (a basic category in your forest map) that are known to have pine park beetle infestation and haven’t been treated, which saves you from having to perform three separate searches and then combine them.

144 Part III: Retrieving, Counting, and Characterizing Geography
Counting and Tabulating
the Search Results
After you find objects and distributions by using your available query language or interface, you want to get some numbers associated with those objects
and distributions — and fast. This tabulation allows you to count numbers of objects, lengths of road, areas of distributions, and even volumes of land. To count the number of point objects, you need only count the number of grid cells. I deal more with measuring geographic objects and distributions in Chapter 11 and 12, but many of these basic counts are displayed without any need for advanced searches that you might want to perform later if you are interested in tabulating complex measurements.
So, with these advanced searches, you can also tabulate and summarize sizes, lengths, areas, circumferences, and other types of measurable data. In fact, most grid-based systems often report some of these numbers immediately upon completing a search.
Getting simple statistics
Among the most powerful basic tools of the GIS is its ability to tabulate the numbers you collect and provide you with descriptive statistics. These descriptions include maximum and minimum values for a search, measures of central tendency (the mean, median, and mode), and measures of dispersion or difference around the measure of central tendency (e.g. standard deviation).
So, beyond collecting and tabulating the number of towns that you find in a search, you can determine which of the towns is the largest and which is the smallest. If you have this information, you know the range of sizes (a measure of dispersion) and can rearrange, compare, and otherwise analyze your results. You can
Sort these statistics or group them by size categories, as well.
Derive basic statistics — such as mean, median, or mode — that give comparative measures with larger and smaller towns.
Look at measures of dispersion — such as standard deviation or other statistical measures — that show how much variation exists from the measure of central tendency.
You don’t need to know the details of basic descriptive statistics, but professional GIS software typically offers basic, as well as more advanced statistical techniques. Of course, you can use these techniques only if you have attribute data for the entities represented by the grid cells you select.
Chapter 9: Finding Information in Raster Systems 145
Interpreting the results
After you collect, tabulate, and prepare summary statistics for your data, you get to decide what you want to do with the information. Descriptive statistics communicate what the data tell you in such a way that you don’t have to be a GIS expert, or even a map reading expert, to understand.
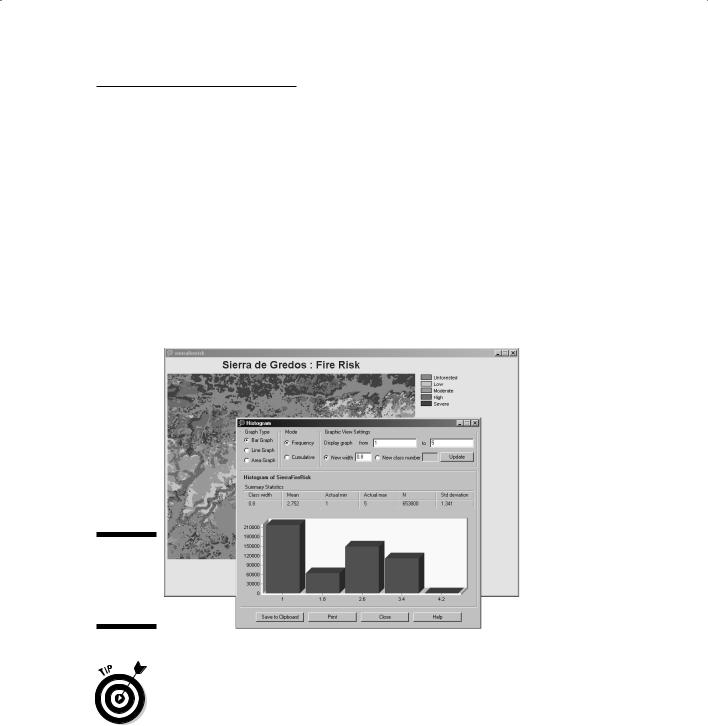
You can often most usefully present the results of your queries and summations by using graphs and charts. When you include graphs and charts, they may be most effective when you present them right on the map itself (but not all software does this automatically). The combination of graphs and charts with an output map (see Figure 9-4) allows you to point to features on the map that are associated with the summaries.
Figure 9-4:
A bar graph from a raster GIS layer.
When displayed next to your map output, or on the map itself, the statistics have a geographic component. Big features aren’t just big — they’re big in a particular place, which communicates the importance of space and place to your audience. In other words, this type of presentation can often enhance your ability to communicate all your ideas. And the better able you are to communicate, the more effective you are in your position. So, GIS makes you look good.

146 Part III: Retrieving, Counting, and Characterizing Geography

Chapter 10
Finding Features in Vector Systems
In This Chapter
Looking at vector GIS structure
Searching with two basic strategies
Summing up what you find
Making sense of the data retrieved
The most graphically accurate method of representing maps in a GIS is the vector system (which I describe in Chapter 4). Vector systems rep-
resent geographic space by using a series of points, lines, and polygons. This method differs from raster GIS, in which geographic space is stored as a collection of squares called grid cells. Because data storage differs between raster and vector systems, the way you search for those data also differs.
Not to worry. In some ways, how you find geographic objects in a vector GIS is more like how you find them on paper maps. Vector GIS allows you to work with geographic features in a more realistic way than you can in raster systems because the points, lines, and polygons are more realistically located and correctly sized. For example
Point objects: Such as wells and houses display like they don’t take up huge chunks of space (or an entire grid cell).
Lines: Have the appropriate lengths but aren’t so thick that they’re unrealistic.
Polygons: Represent the boundaries of areas much more exactly than grid cells and don’t have that blocky, checkerboard appearance.
Some books include lists of advantages and disadvantages of vector over raster GIS, but I prefer to think of these items simply as differences. Vector GIS is different in the ways it stores data (see Chapter 4), lets you retrieve data, and displays the results of data analysis. In this chapter, I tell you about the retrieval of data, and I concentrate on the differences only in the way that they affect retrieval.
148 Part III: Retrieving, Counting, and Characterizing Geography
Getting Explicit with Vector Data
On paper maps, you read the symbols that represent features to identify those features visually. In vector GIS, you use the power of the computer to identify the stored features by name or description. You usually need to find features on maps so that you can use them in more complex tasks, such as finding routes from place to place, comparing different maps, and finding the best place to put a business. (GIS can lead you to business success by helping you evaluate potential markets. I talk about some of these exciting applications in Chapter 1.)
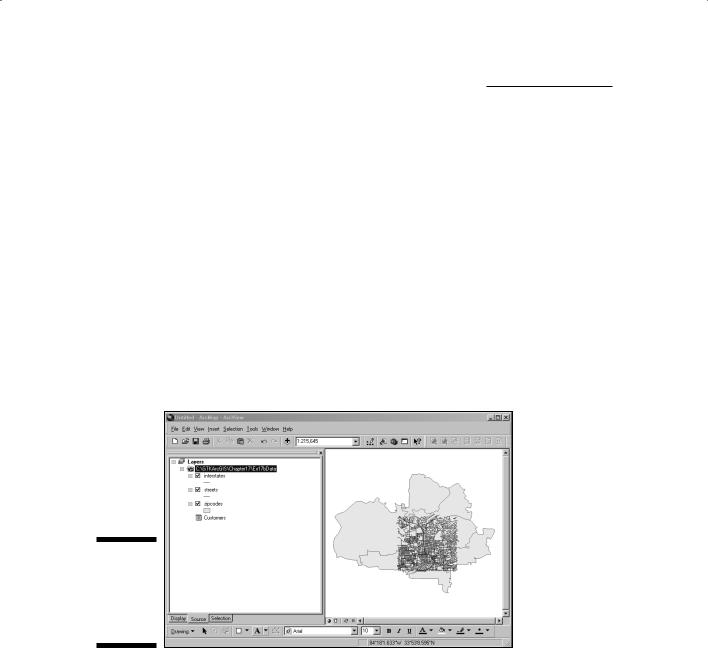
Unlike raster systems, vector GIS systems have location information that’s more accurate and visually more like the real world, so you can search geographic space to achieve more accurate results. You can search by looking at the tabular information or by selecting the graphics on the screen. Typically, the software has its own graphical user interface (GUI) that enables you to do these searches (see Figure 10-1).
Figure 10-1:
The ESRI
ArcGIS vector GIS user interface.
From your perspective, this approach to finding features might appear pretty much the same as in raster systems because you don’t really need to know what’s going on inside the computer. The differences show up in certain types of analysis — particularly those involving measurement of distance, direction, perimeter, area, and so on — and are often an automatic result of the data retrieval process.

Chapter 10: Finding Features in Vector Systems 149
Seeing How Data Structure
Affects Retrieval
Like grid-based GIS (those that divide geographic space into little squares called grid cells), polygon-based GIS also comes in different flavors. These flavors are often not so much a function of the user interface, but rather how the computer goes about retrieving the data you ask it to retrieve. The three major types of systems are network, relational database management system (RDBMS), and object-oriented GIS (see Chapter 6 for details on these systems). In the following list, I describe the two systems that you’re most likely to encounter in your GIS work (I purposely ignore the network systems because they’re pretty rare):
DBMS-based vector GIS: In this traditional structure, you use some on-screen graphics to pick out features for retrieval, or you use a search engine query to find the features’ attributes. The graphics link to the tabular data containing the attributes in the DBMS, and the two elements (graphics and tables) work together to supply you with data that satisfies your search. When you find the attributes, you get the associated graphics, and when you find the graphics, you also pull up the tabular data. Your searches enable you to combine data and link features together in any way you want so that you can create new maps.
|
One example of a DBMS-based GIS is Intergraph’s GeoMedia package. |
|
|
Emergency services and military applications often use this software |
|
GIS |
package to plan routes and determine the placement of troops and |
|
equipment. |
||
|
Object-oriented vector GIS: For object-oriented systems, you use pretty much the same search strategy you would in the traditional DBMS system. But the object-oriented system is somewhat smarter about how it retrieves the data. In an object-oriented system, each object represents a geographic feature and is associated with not only descriptive attributes, but also a set of rules about how the objects relate to each other and to their environment. In object-oriented systems, such properties (the attributes) and methods (the rules) belong to a grouping of objects called a class. Any object that’s part of the class group is said to inherit these properties and methods. In short, the rules prevent you from making mistakes by retrieving and linking incompatible objects.

150 Part III: Retrieving, Counting, and Characterizing Geography
|
Here’s a classic illustration of how object-oriented systems can assist you in |
|
|
retrieving valid and useful information. Suppose you’re the Director of |
|
GIS |
Transportation Planning for the City of Barstow, and you have a new develop- |
|
ment coming in. You know this new development needs roads, and you |
||
|
||
|
include the following interaction with the GIS in your planning process: |
1.You establish criteria and assign an assistant to create a proposed set of roads and streets for the new subdivision inside the GIS.
The network of new streets must be able to handle a certain flow of traffic (number of cars), must be accessible by all the future homeowners, and must comply with the usual traffic rules. You also remind the assistant that this road network must link to the existing roads.
2.Your assistant searches the map of the development area with queries designed to match all the criteria for new roads to be placed in the new subdivision.
Here the assistant tries to find where links to existing roads should be, where roads need to connect to new subdivisions, and what traffic laws might exist. Then the assistant produces a new map, and adds additional roads that are meant to satisfy these criteria, including a few oneway streets that allow traffic to flow from north to south only.
3.You look at the assistant’s map and review the new street pattern.
Here’s what you find in the new development’s street map:
•From a GIS with a traditional RDBMS structure: You point out that the new one-way streets (with traffic flow from north to south) are connected to one-way streets that flow from south to north in the developed part of the city. Because the traditional DBMS does not contain rules that prevent such mistakes, your assistant has been able to place streets with connecting roads that flow in opposite directions.
•From an object-oriented GIS structure: You see street patterns showing traffic flow that follows the proper direction of one-way streets. If your assistant had used an object-oriented structure, no matter how hard he or she tried, the system would not have
allowed the two opposite street patterns (north to south and south to north) to merge — because doing so violates the rules contained in the objects themselves (the streets). Figure 10-2 shows
a traffic route that skirts a bad road connection on the way to its destination.
If you’re often concerned about how certain data types that you retrieve will work together, choose a GIS package that has the object-oriented data model. This model’s structure validates the proper relationship of the data during retrieval and helps ensure that your combinations work together to produce legitimate results.